Workforce Analytics Productivity Reports & Dashboards

Trusted by 9,500+ global brands and organizations
DASHBOARDS & REPORTS
Data-driven workforce insights
Get a complete view of how work happens with real-time dashboards and historical reports. Uncover productivity insights to balance workloads, improve focus and support healthy habits across every team.
Get started free
“What I like most about ActivTrak is how it gives me clear visibility into how the team is spending their time without being intrusive. It helps me spot productivity patterns and potential bottlenecks quickly, so I can address issues before they impact the operation.”
— Ops Manager
DEEP-DIVE PRODUCTIVITY REPORTS
Detailed insights for continuous improvement
Drill down to the metrics that matter most. Track trends, uncover bottlenecks and measure progress over days, weeks or months to guide smarter decisions.
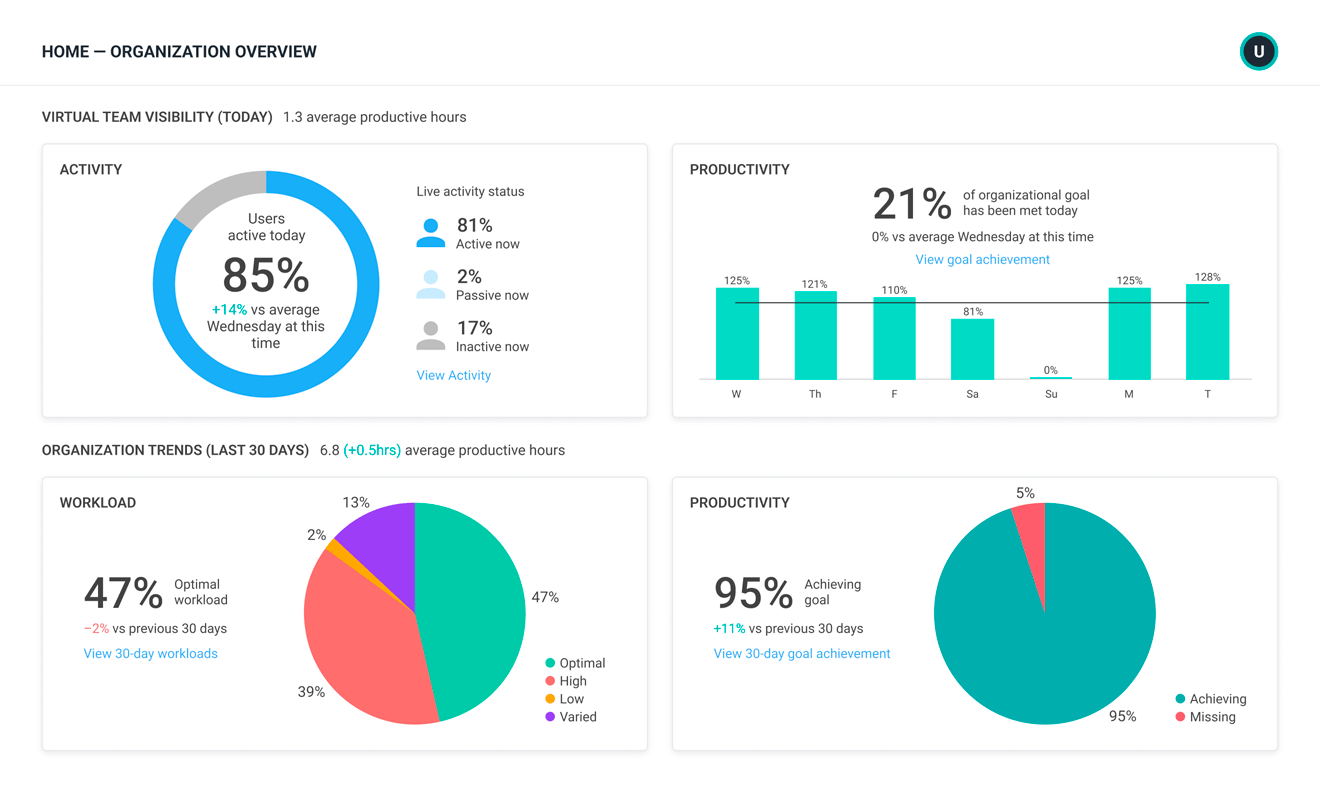
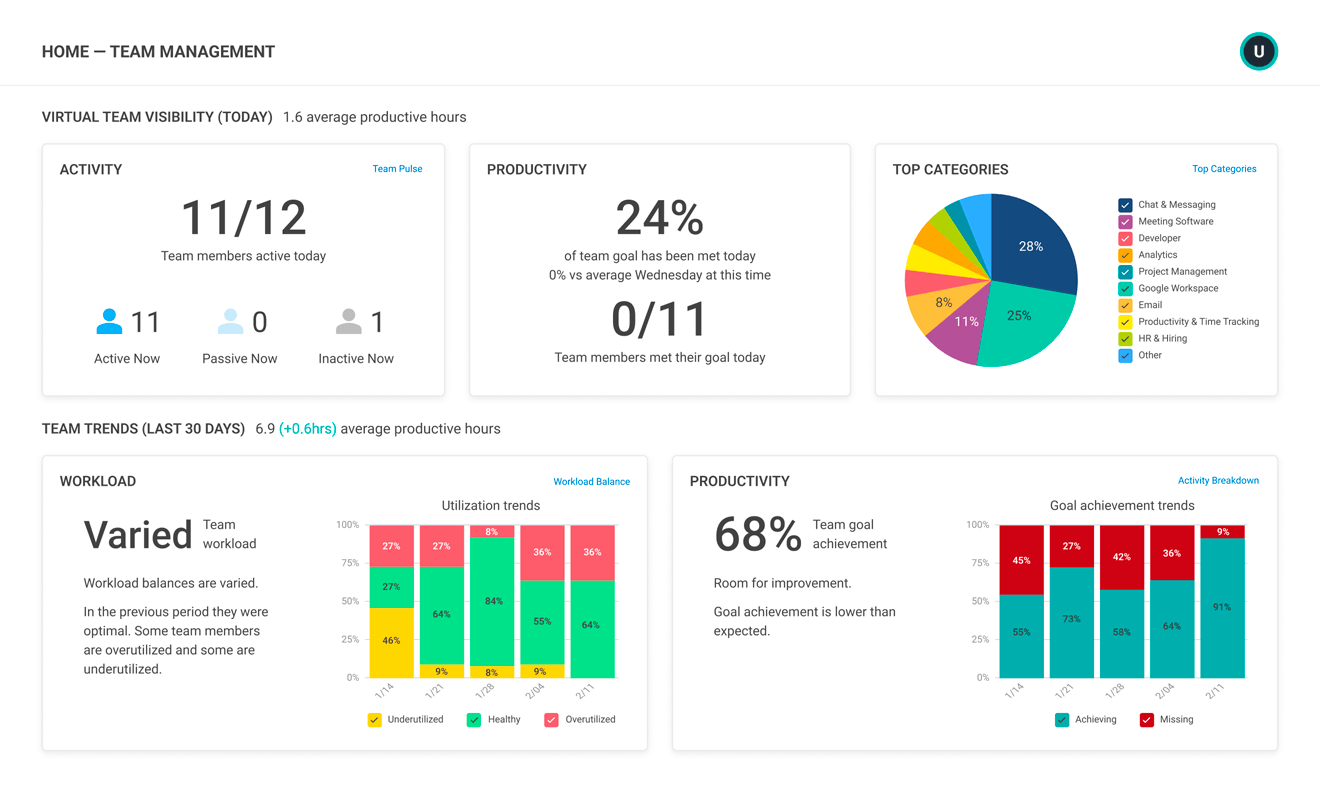
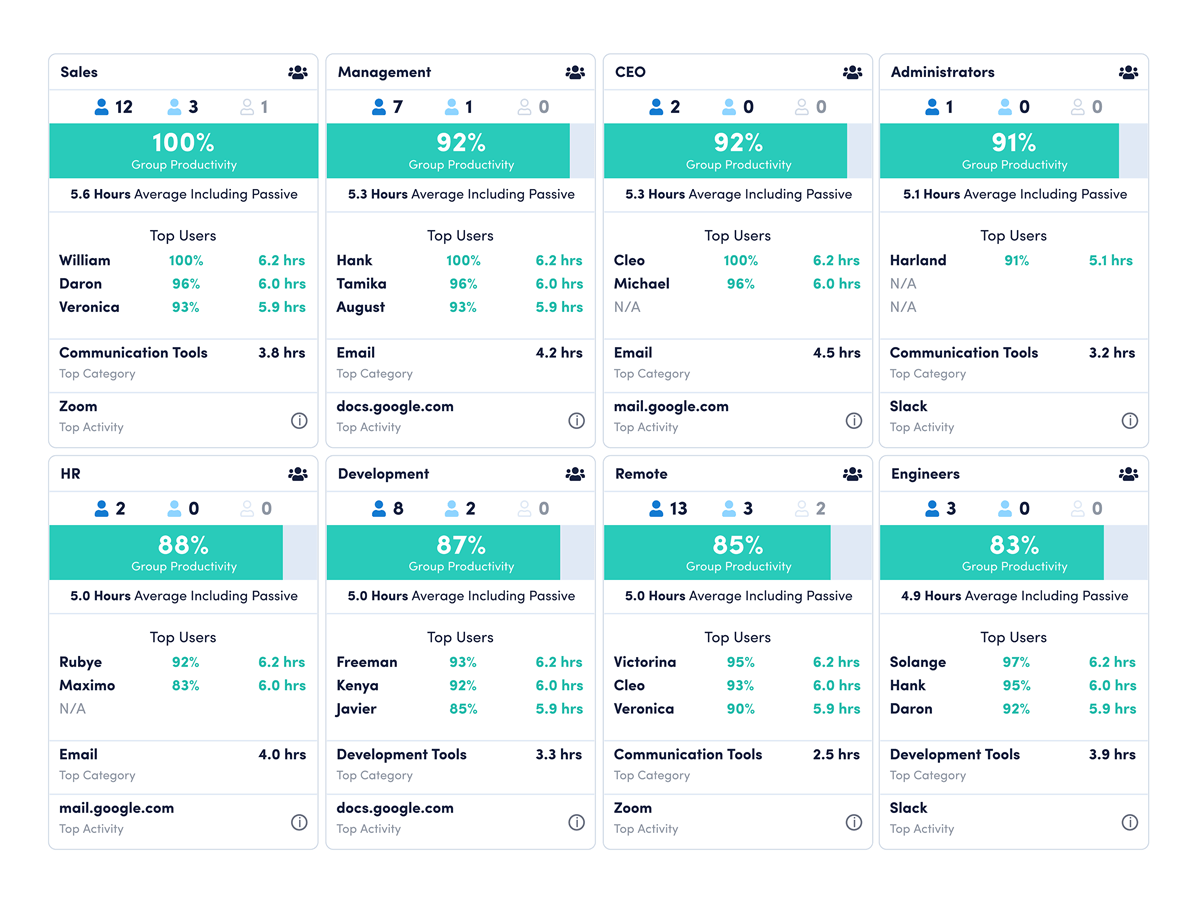
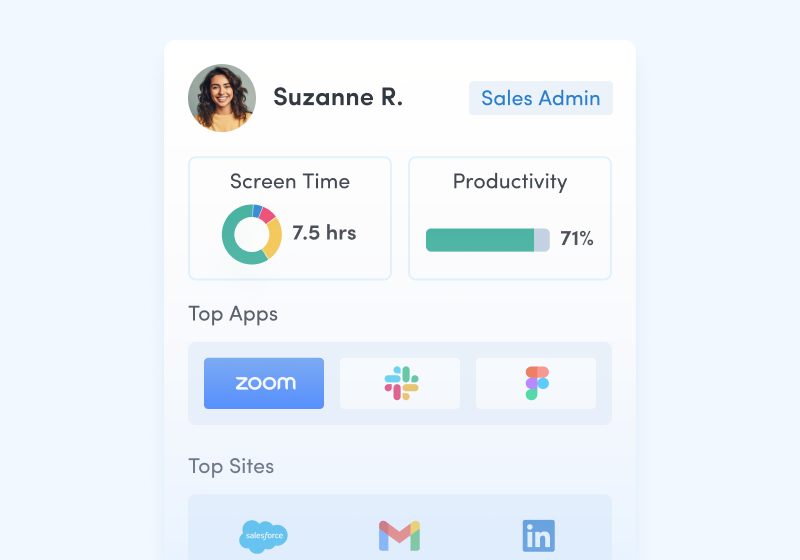
Team Productivity
Review daily breakdowns of productive vs. unproductive activities. Track trends by week, month or year and understand average working hours across dispersed teams.
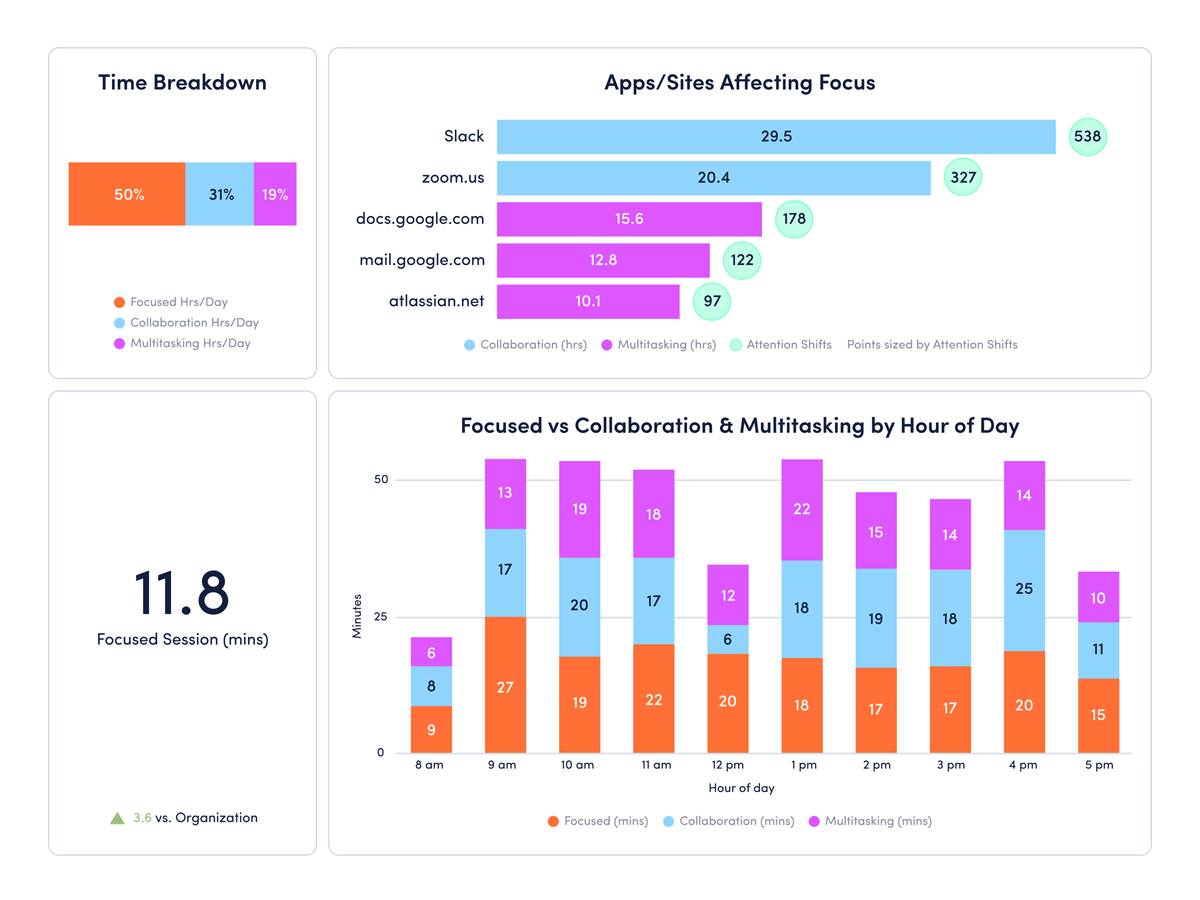
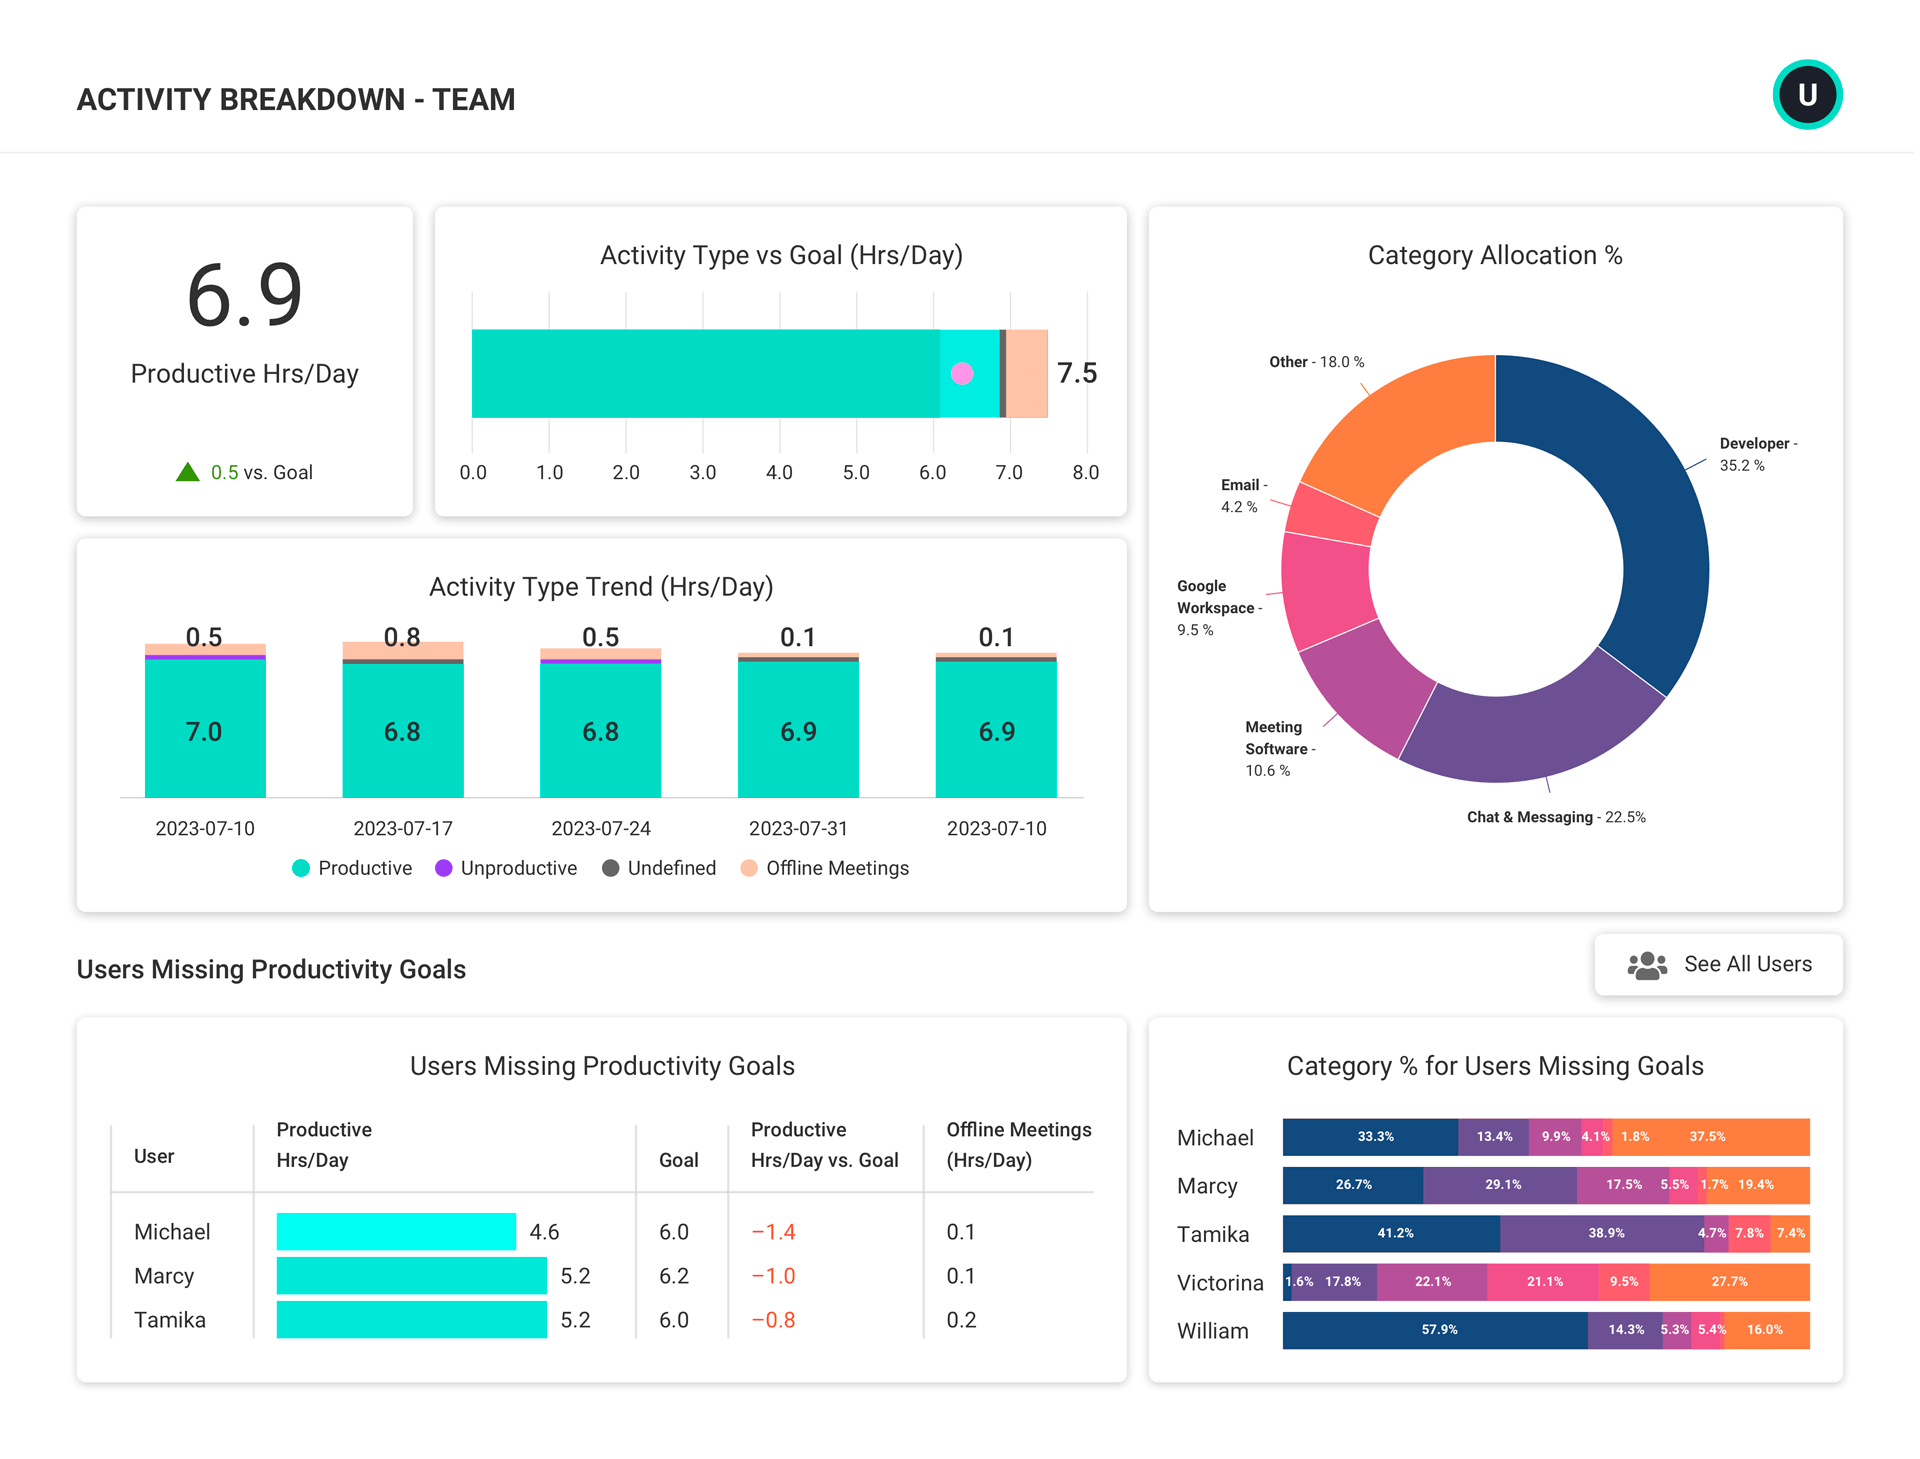
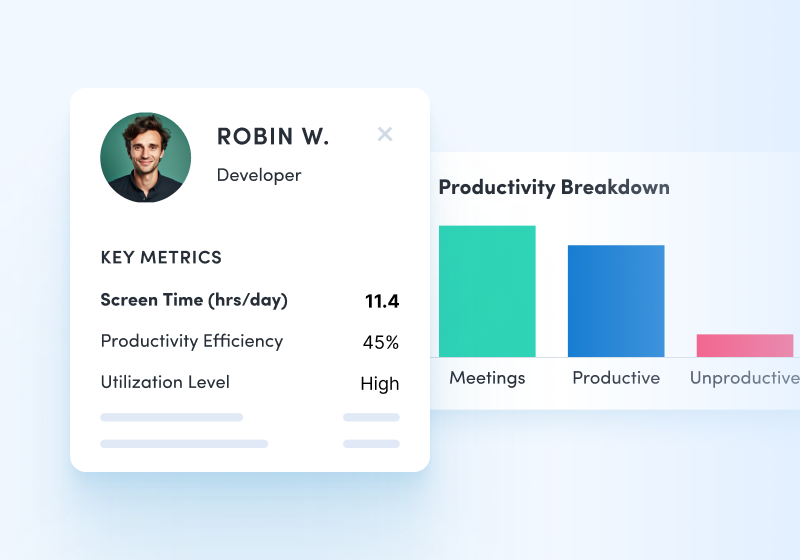
Activity Trends
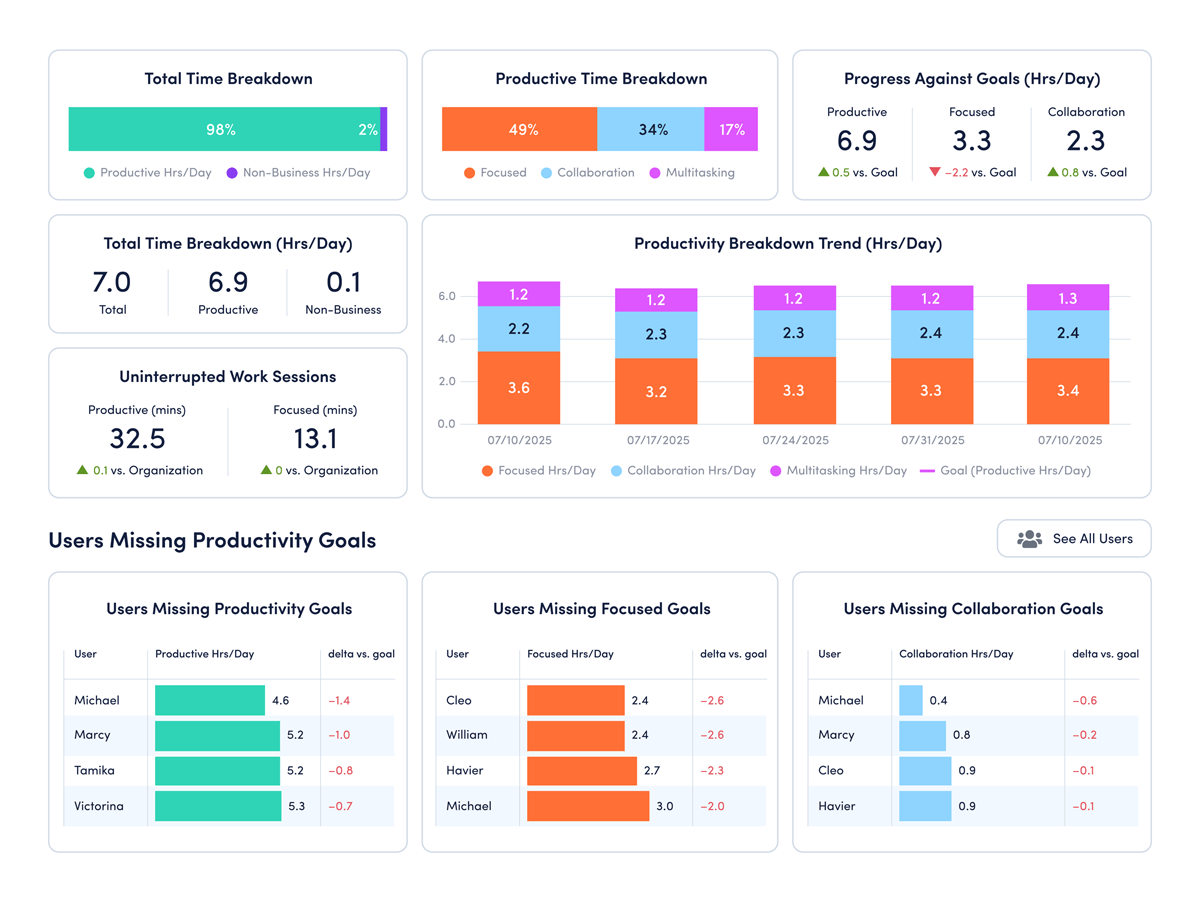
See how individuals perform against productivity goals. Analyze long-term trends and application usage by category to ensure alignment with roles and priorities.
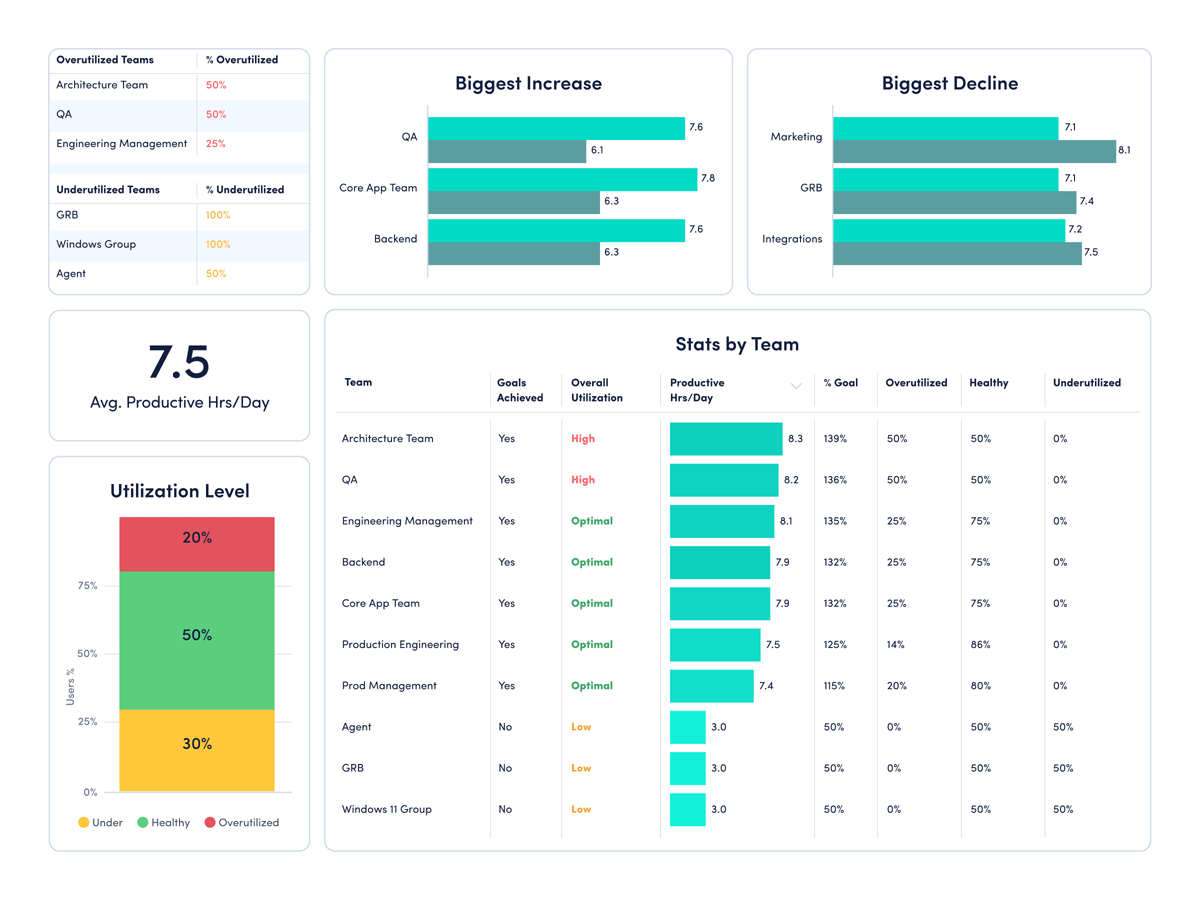
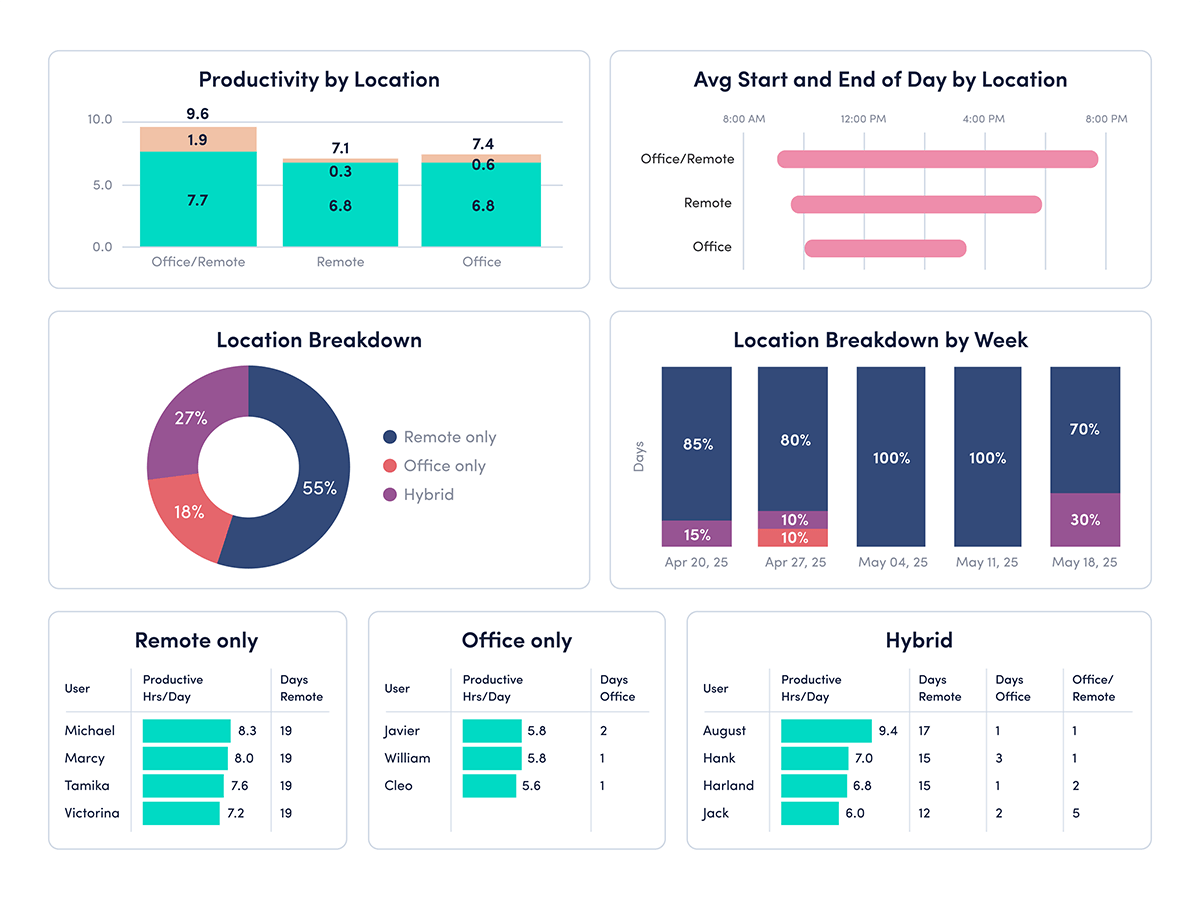
Productivity by Location
Compare remote, in-office and hybrid activity to reveal the most productive environment and guide space planning or policy decisions.
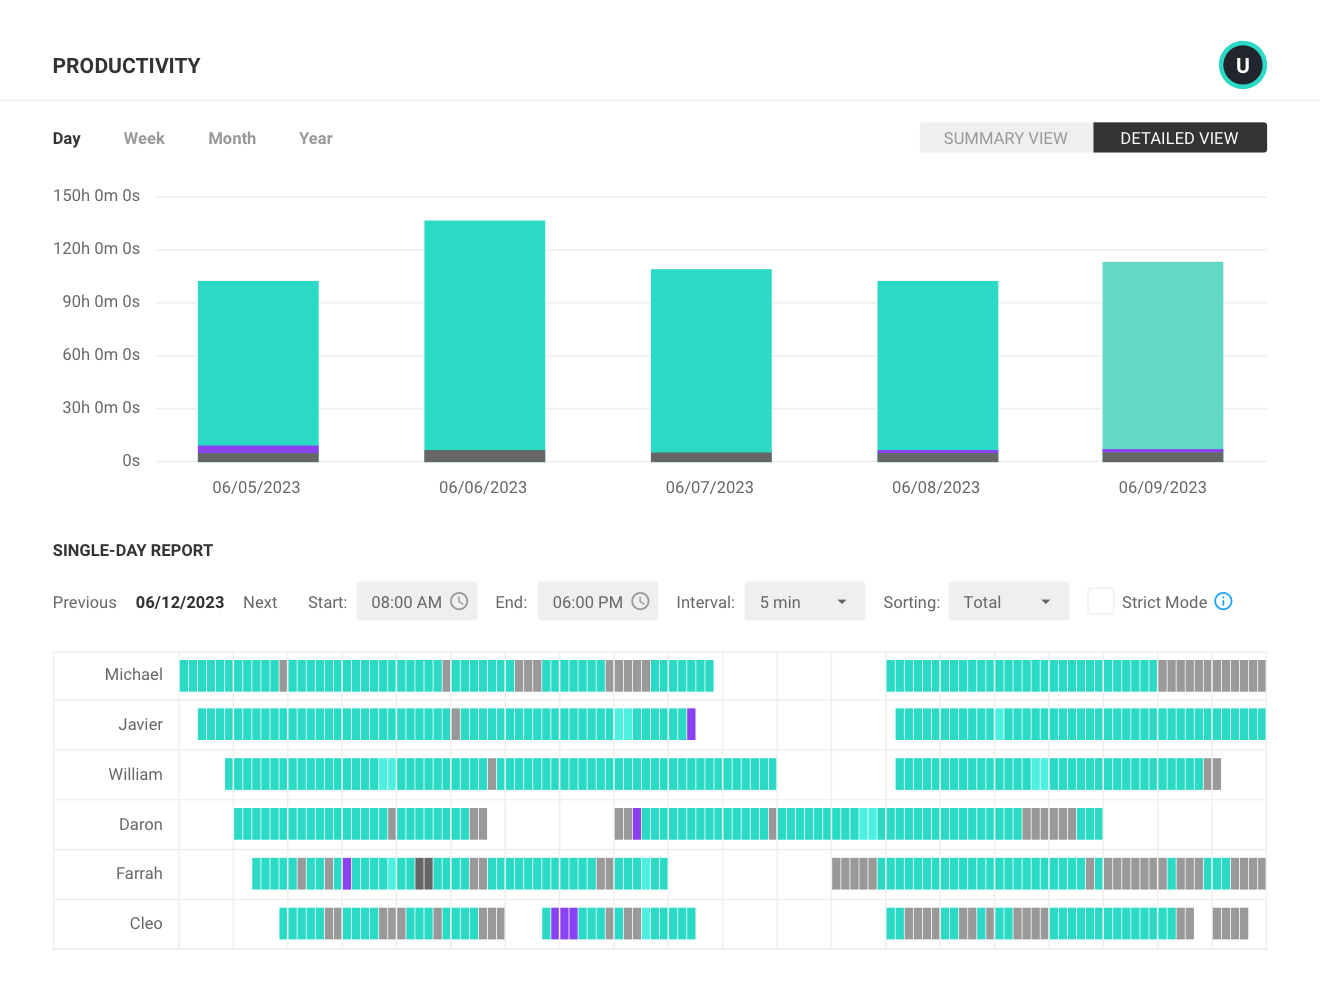
Productivity Summary
Spot spikes in working hours and assess daily team coverage to keep workloads healthy and balanced. View data by day, week, month or year to benchmark and improve.
Connect work intelligence across your tech stack
Integrate existing tools to combine workforce activity, AI usage and business data for deeper, more actionable insights.
Workday
ADP

Microsoft Teams
Outlook

Google Calendar
ServiceNow
Zendesk
ChatGPT
Claude
Gemini
Microsoft Viva
Jira Software
Salesforce
Slack
How It Works
Capture behavioral activity
Capture behavioral activity including hours worked, schedule adherence, location policy compliance and app & website usage.
Analyze productivity trends
Analyze productivity trends on employee focus, engagement and utilization to make data-informed decisions on resource allocation.
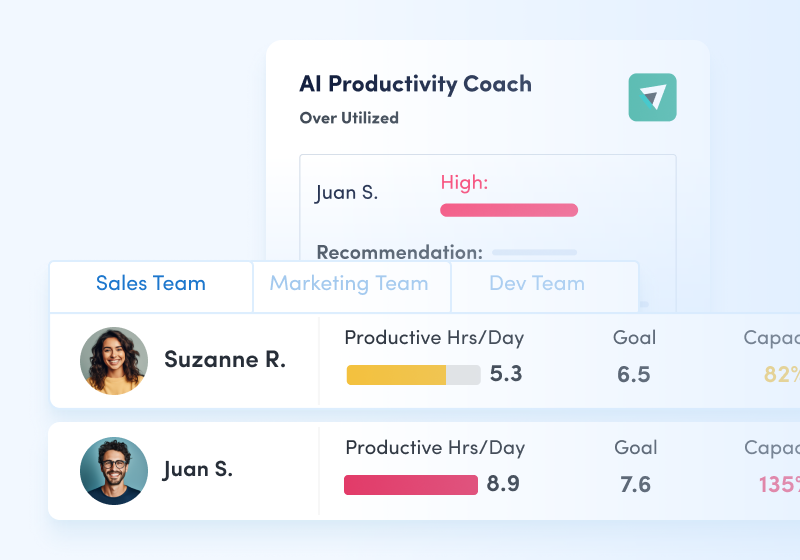
Optimize team performance
Optimize team performance with benchmarks, goal-tracking and AI coaching recommendations to improve workforce productivity.
Hear what everyone is saying about Activtrak
Powered by![]()
Getting started is easy.
Be up and running in minutes.