Productivity Optimization That Drives Results

Trusted by 9,500+ global brands and organizations
OPTIMIZE PRODUCTIVITY & PERFORMANCE
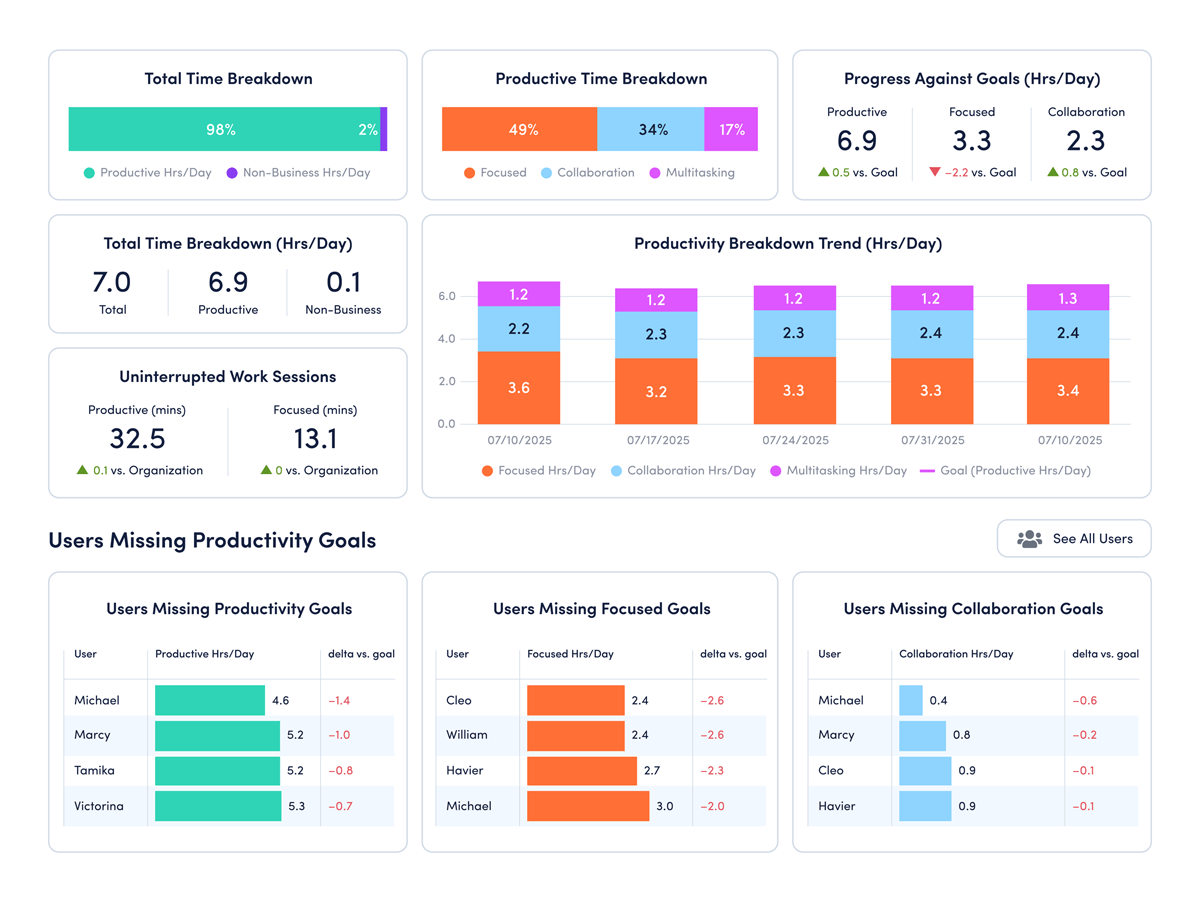
Real-time visibility into performance at every level
Unlock daily activity data to understand how employees work, where performance lags and what drives results.
- Turn daily activity into insight
- Focus teams on what matters most
- Achieve consistent shift coverage
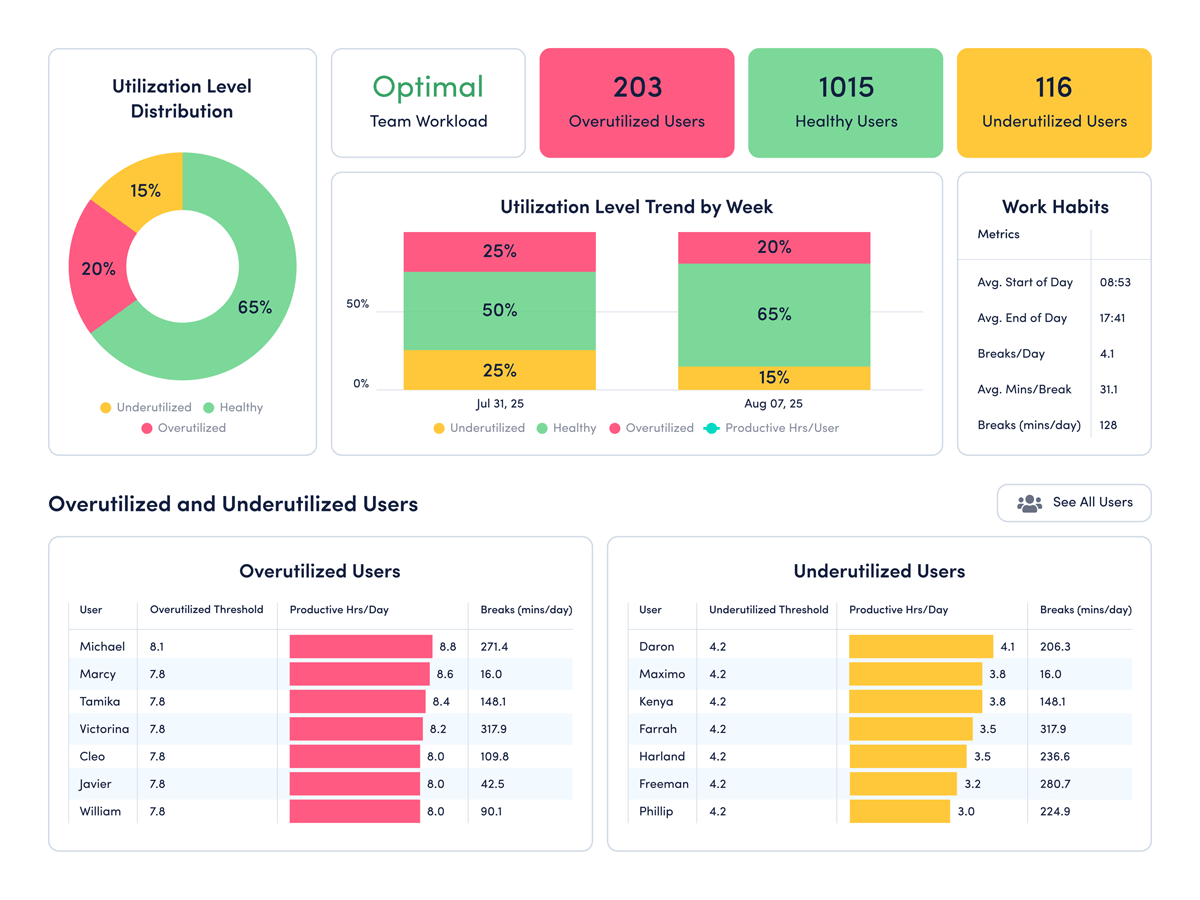
- Balance workloads to protect well-being
- Use data to shape workplace policies

ActivTrak provides highly relevant insights and enables us to measure individual performance against the averages for someone in their position, based on their peers at the company.
— C-Level Executive
RTO POLICY OPTIMIZATION
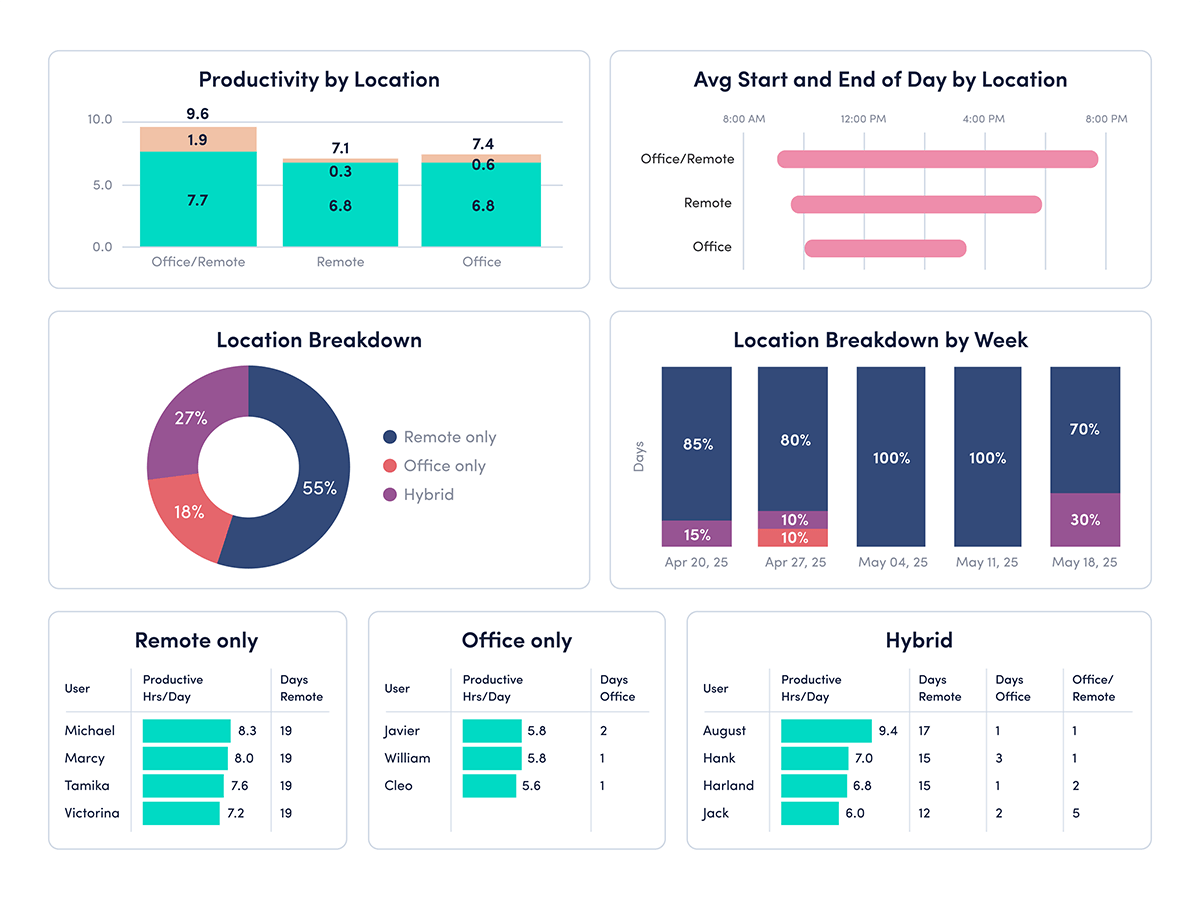
Use data to shape workplace policies
See how productivity compares across office, remote and hybrid locations to guide return-to-office policy decisions.
Connect work intelligence across your tech stack
Integrate existing tools to combine workforce activity, AI usage and business data for deeper, more actionable insights.
Workday
ADP

Microsoft Teams
Outlook

Google Calendar
ServiceNow
Zendesk
ChatGPT
Claude
Gemini
Microsoft Viva
Jira Software
Salesforce
Slack
How It Works
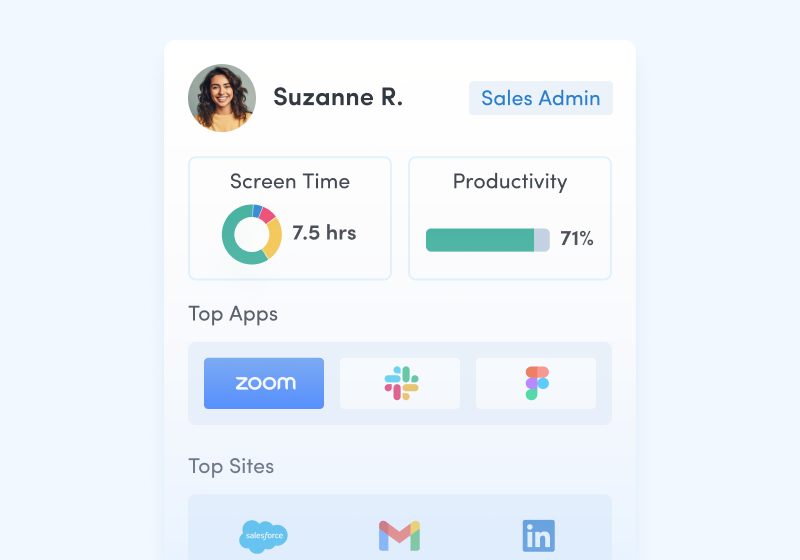
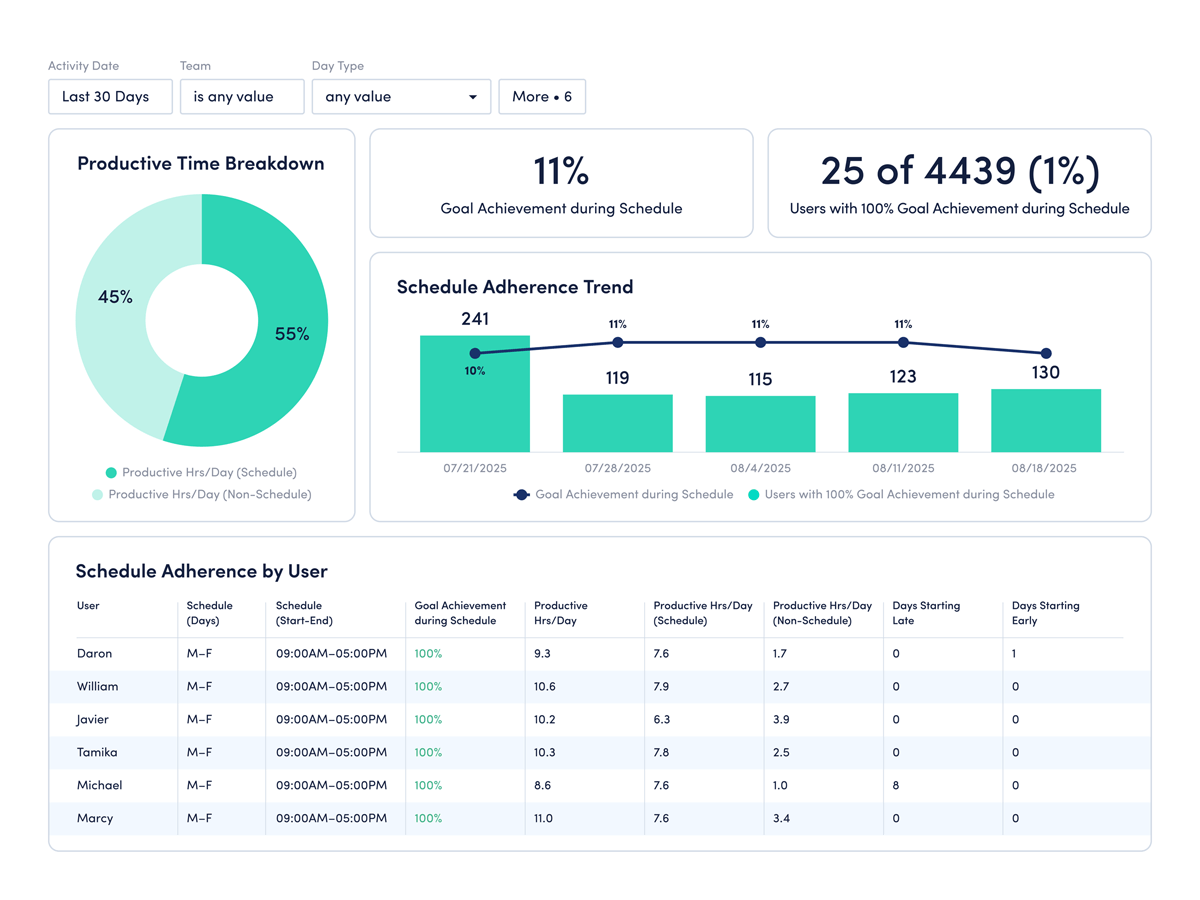
Capture behavioral activity
Capture behavioral activity including hours worked, schedule adherence, location policy compliance and app & website usage.
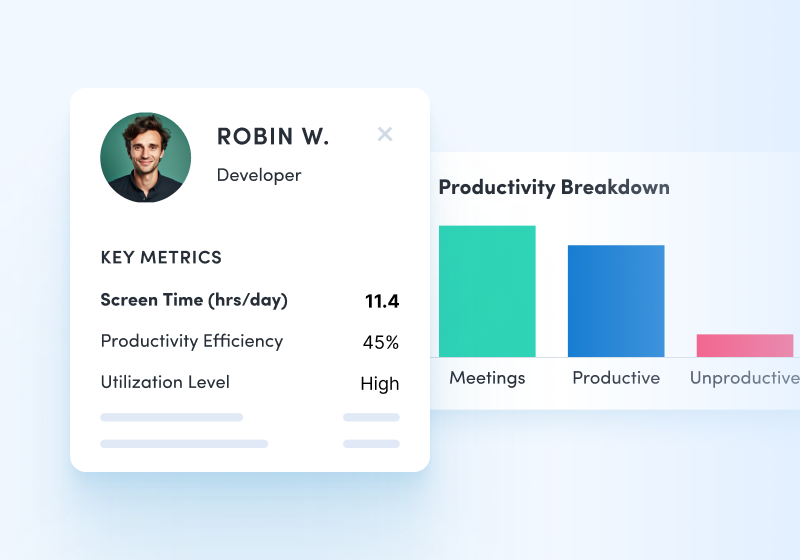
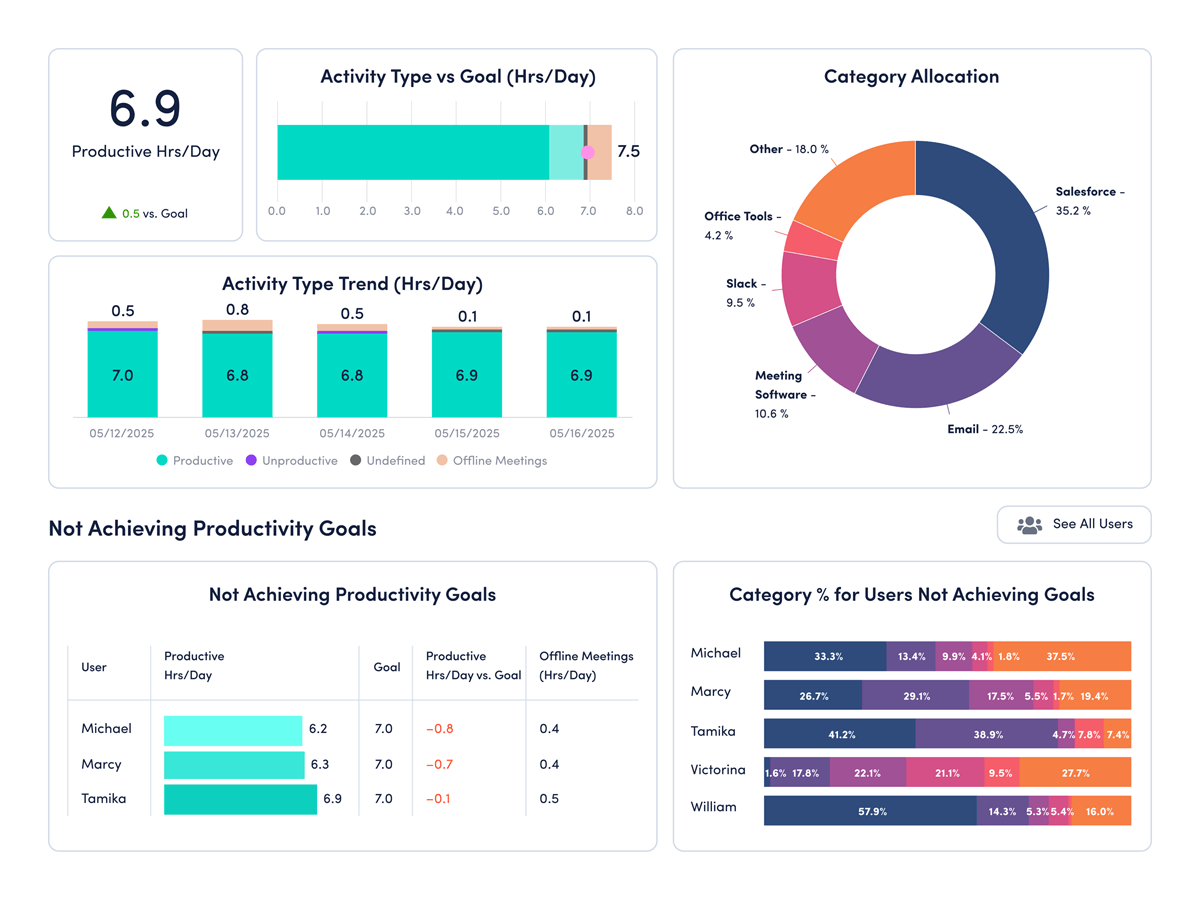
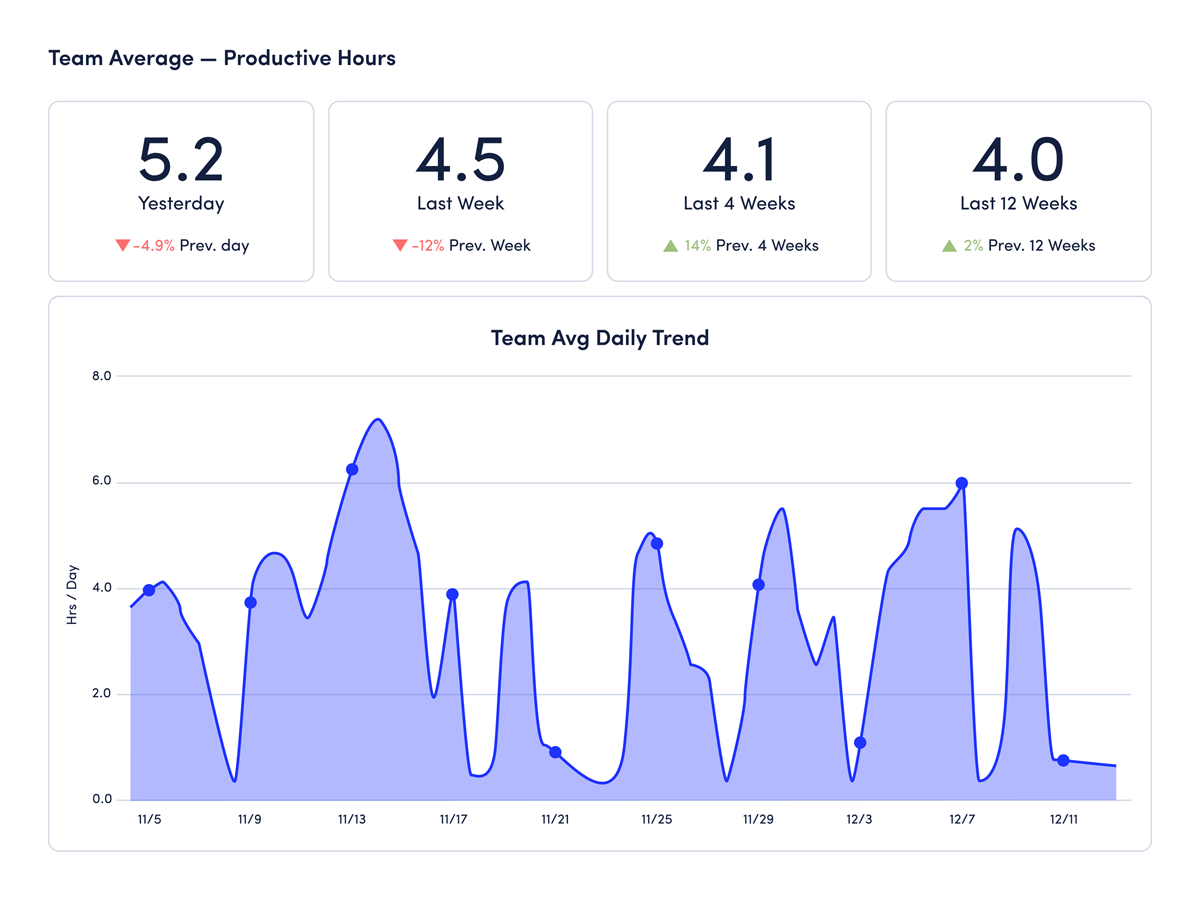
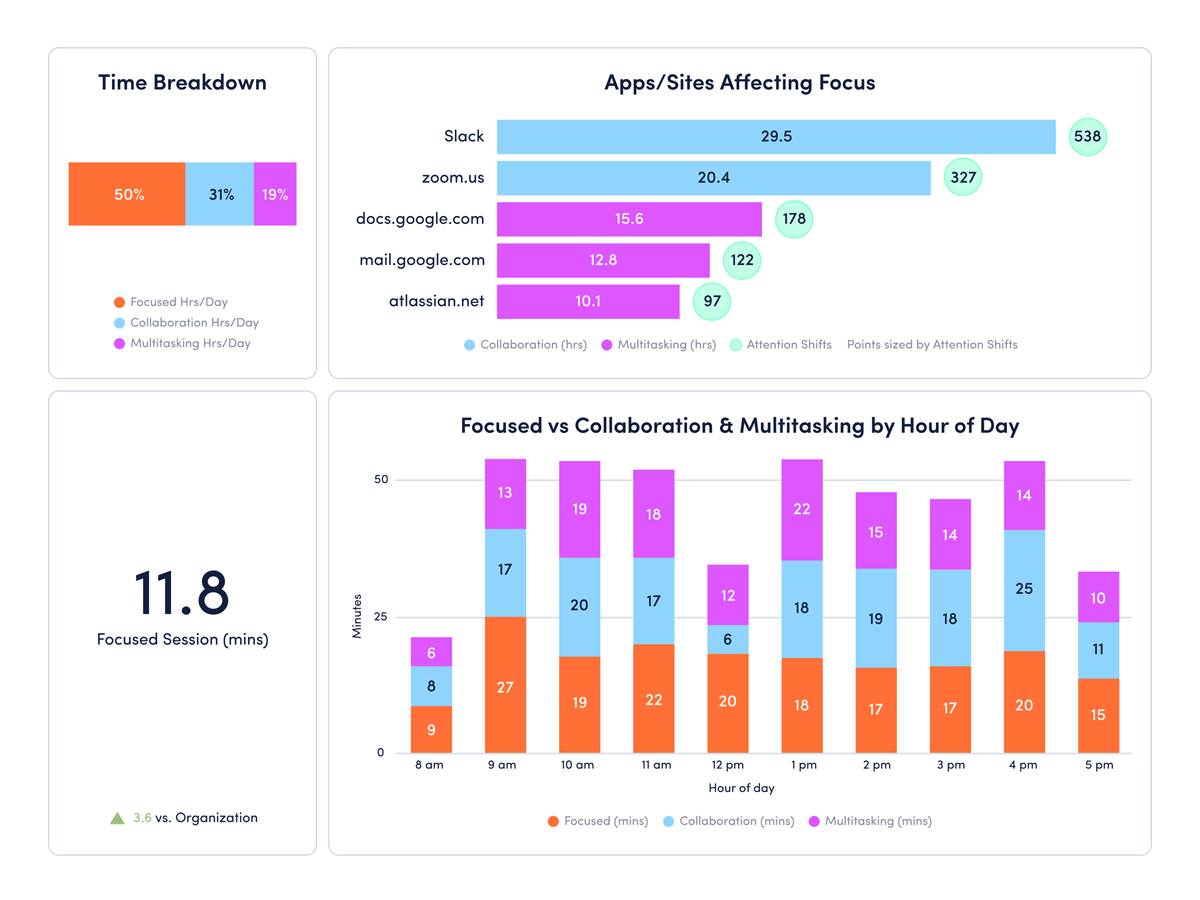
Analyze productivity trends
Analyze productivity trends on employee focus, engagement and utilization to make data-informed decisions on resource allocation.
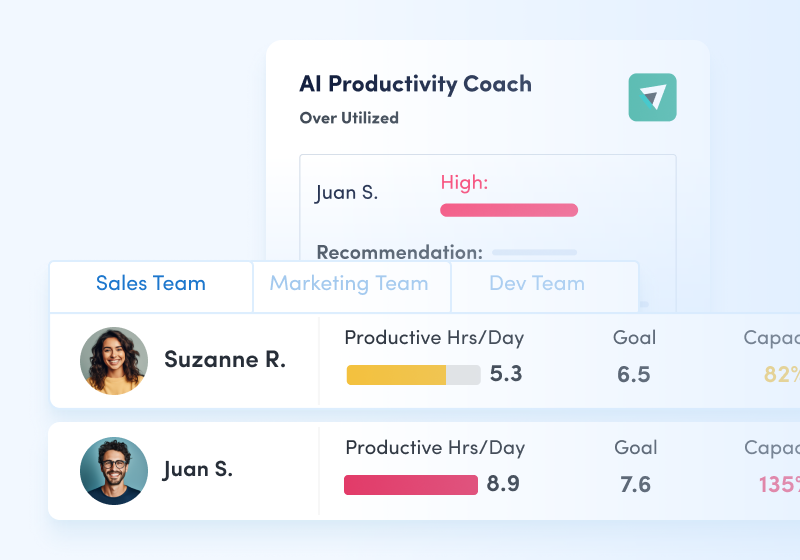
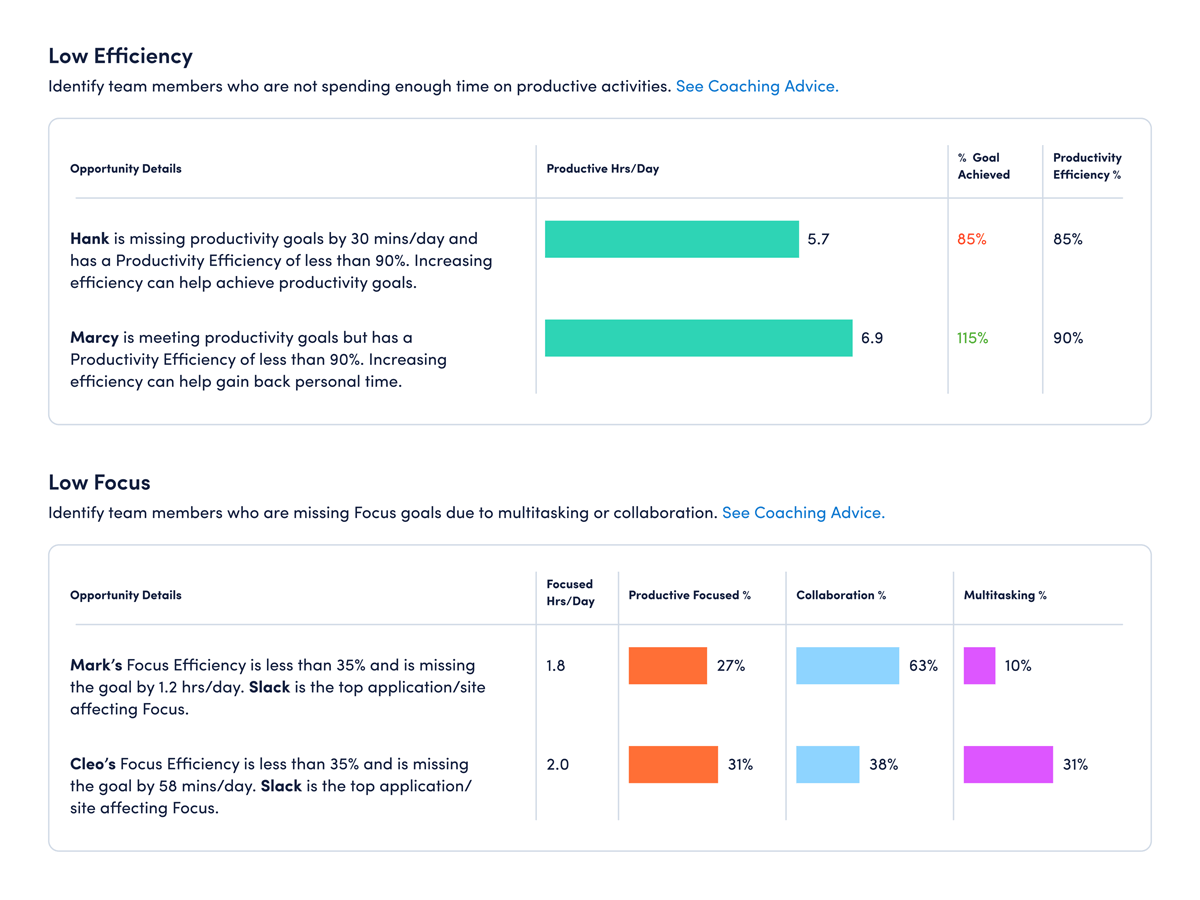
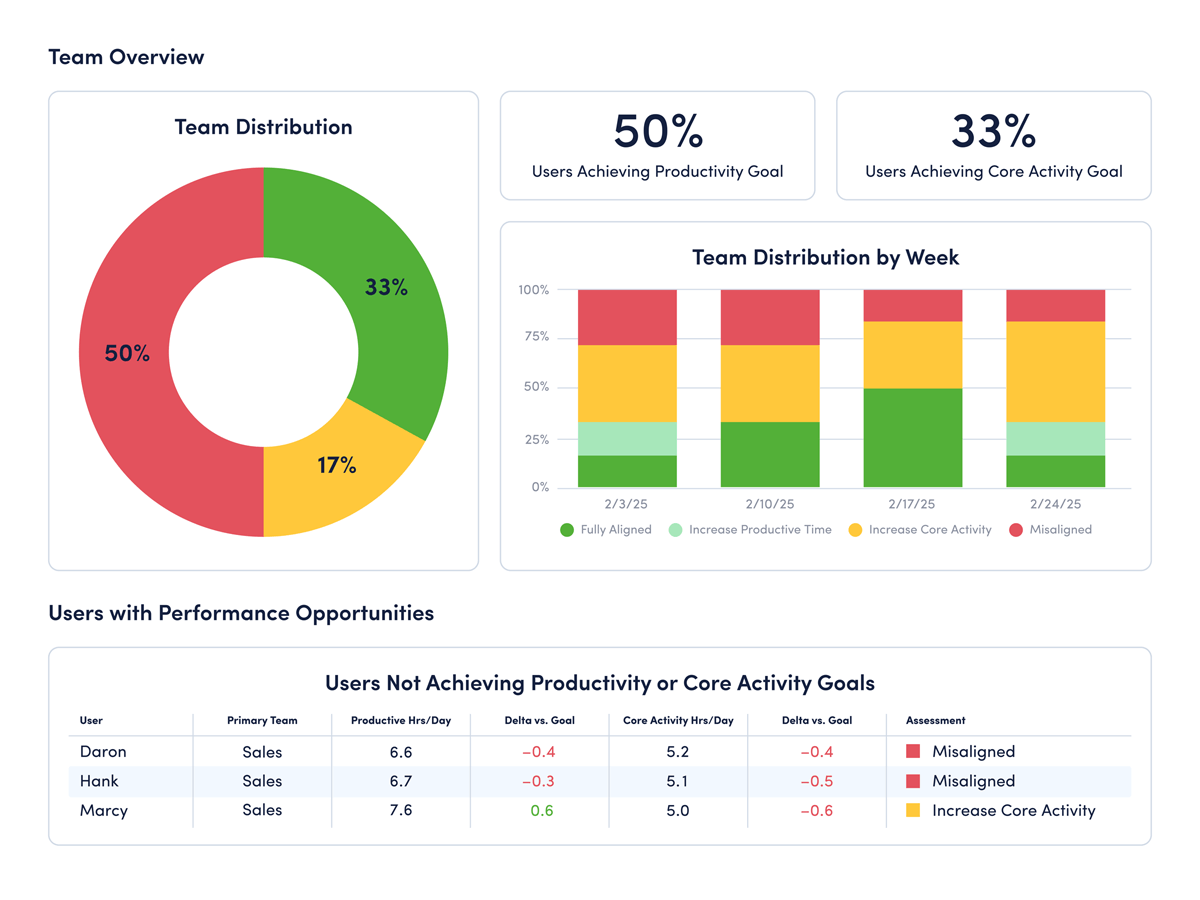
Optimize team performance
Optimize team performance with benchmarks, goal-tracking and AI coaching recommendations to improve workforce productivity.
Hear what everyone is saying about Activtrak
Powered by![]()
Getting started is easy.
Be up and running in minutes.