Workforce optimization software. For leaner operations and faster growth.

Trusted by 9,500+ global brands and organizations
WORKFORCE OPTIMIZATION SOFTWARE
Make smarter, data-driven workforce decisions
Eliminate inefficiencies with ease. ActivTrak equips you with data-driven insights to reduce waste, optimize your workforce investments and drive growth.
Discover how ActivTrak helps you:
- Calculate the cost of untapped workforce capacity
- Right-size teams and workloads
- Reign in technology spend
- Eliminate low-value work
- Measure workforce productivity

Vice-President in IT
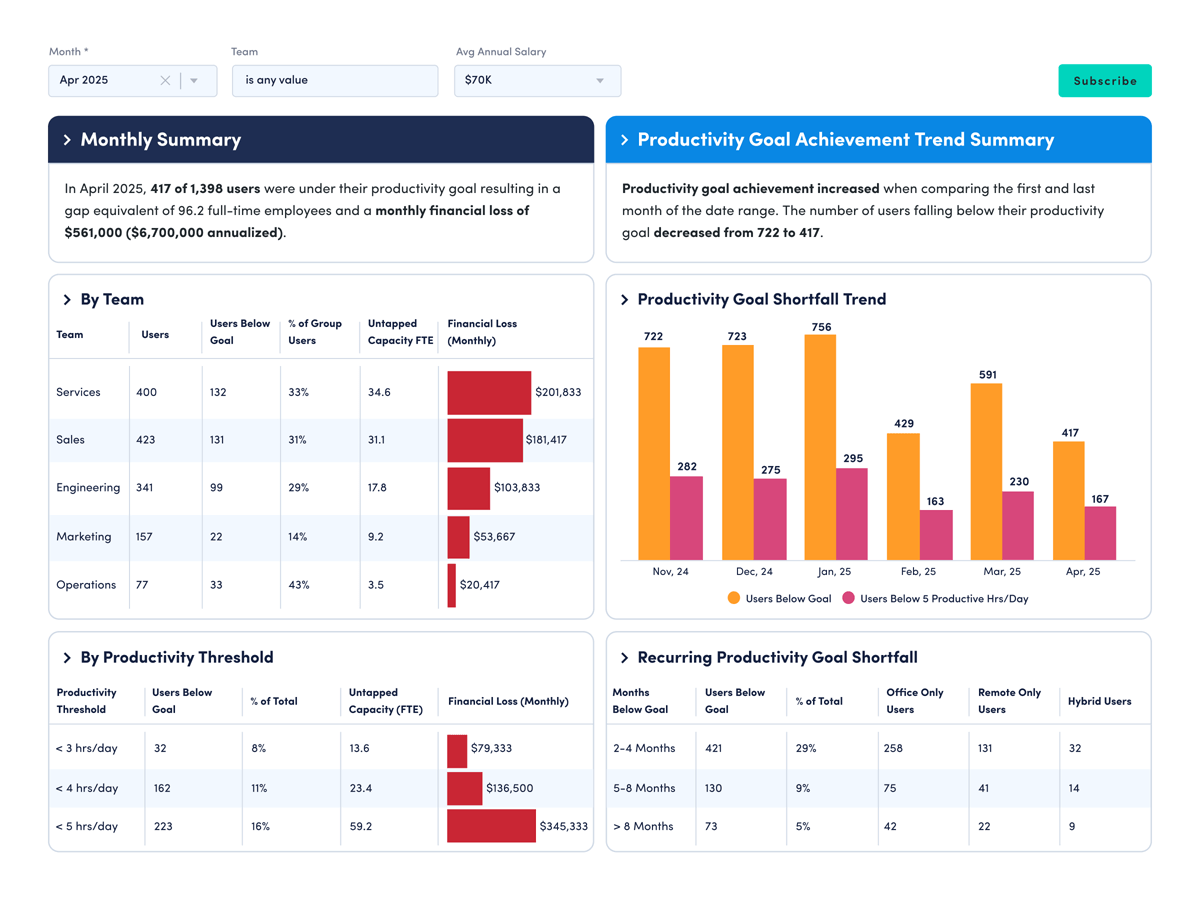
WORKFORCE UTILIZATION
Gain real-time visibility into untapped workforce capacity and costs
- Give executives a clear view into workforce utilization and ROI.
- Reduce excess capacity and improve resource allocation.
- Unlock data-driven decision making that boosts profitability and workforce effectiveness.
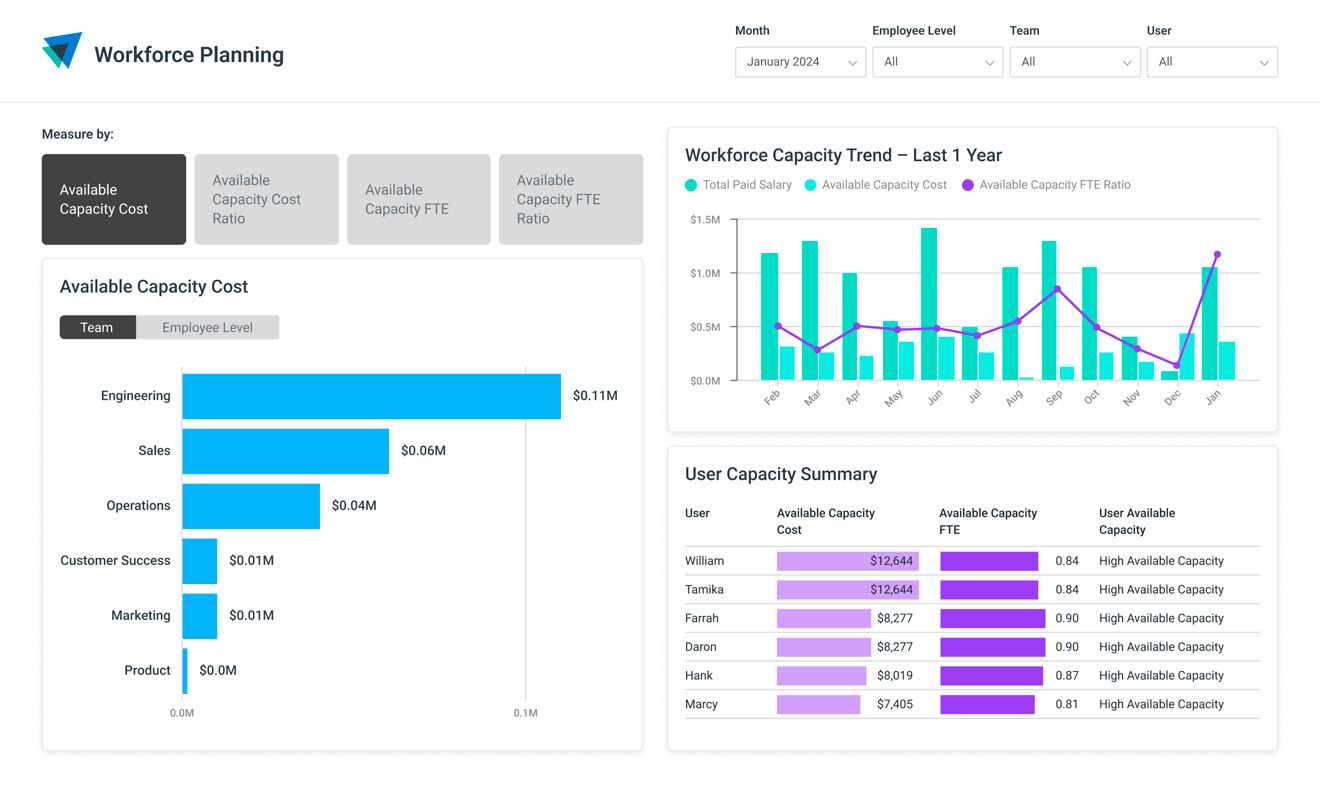
HEADCOUNT AND CAPACITY PLANNING
Improve ROI with “just right” staffing
- Transform your workforce data into strategic staffing insights.
- Identify untapped capacity to prevent excess hiring.
- Make data-informed decisions with real-time reports on workload balance, capacity costs and more.
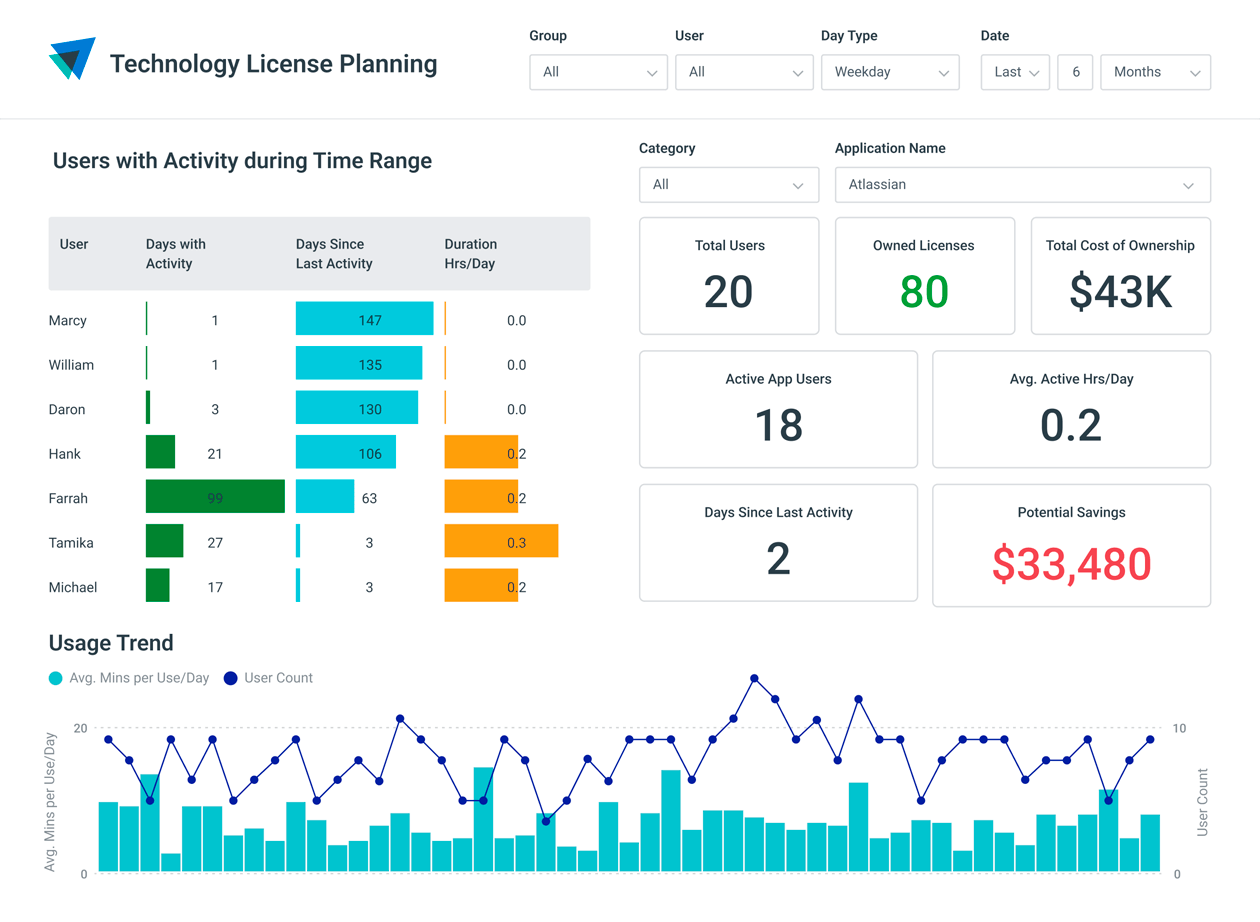
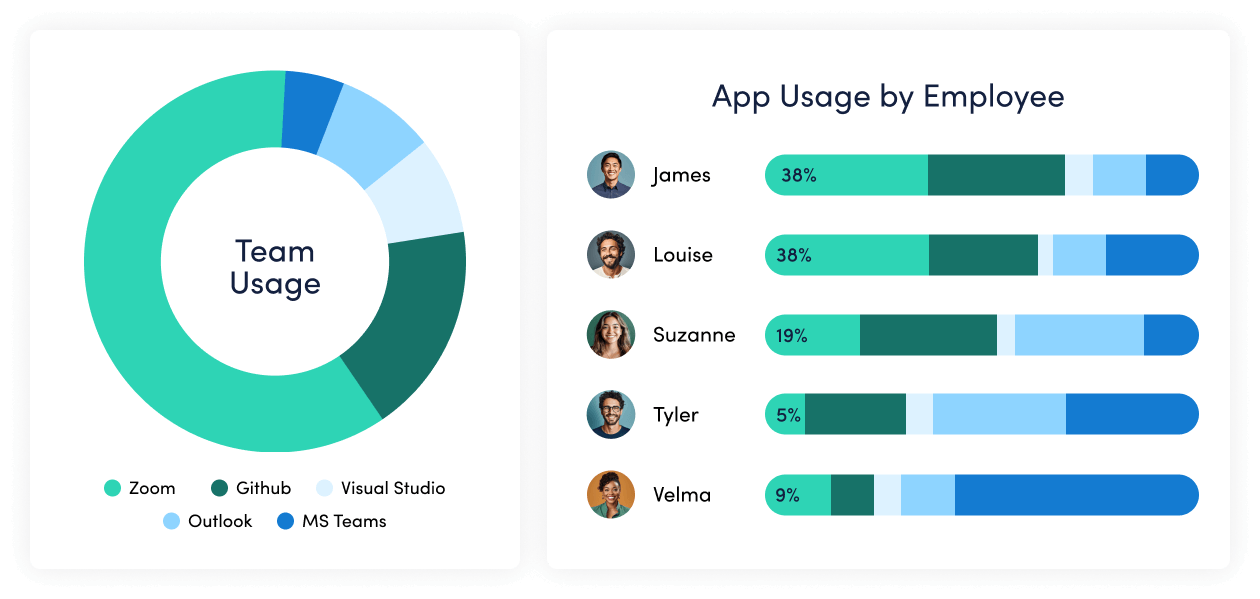
TECHNOLOGY UTILIZATION
Control your tech costs
- Identify unused licenses, underutilized apps and duplicate tools.
- See which apps and websites your workforce uses most.
- Reign in tech spend and make more accurate budgeting decisions.
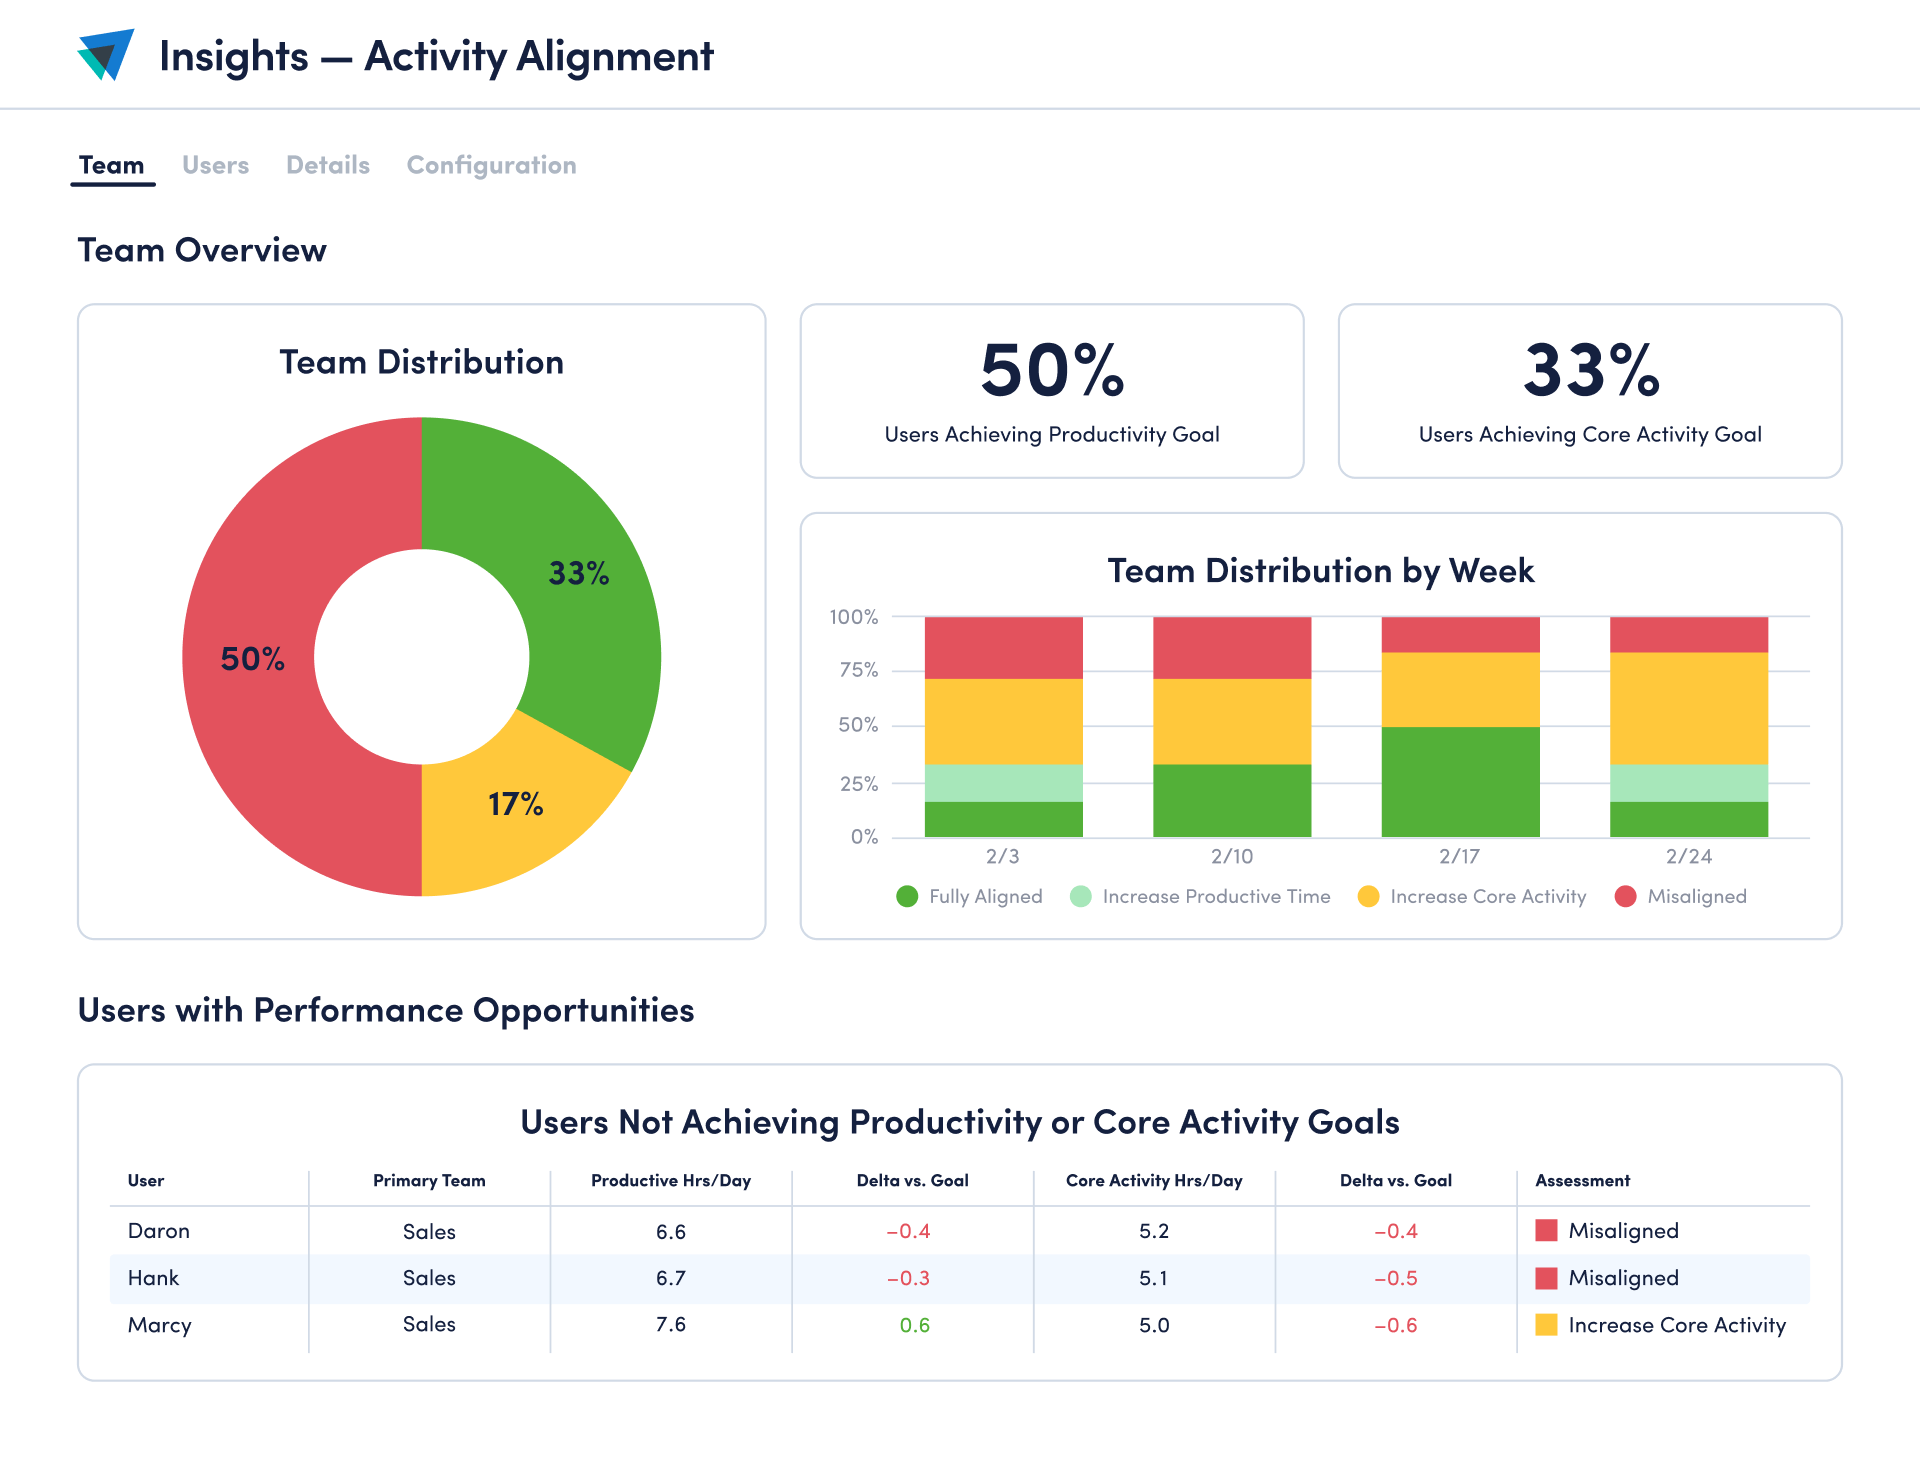
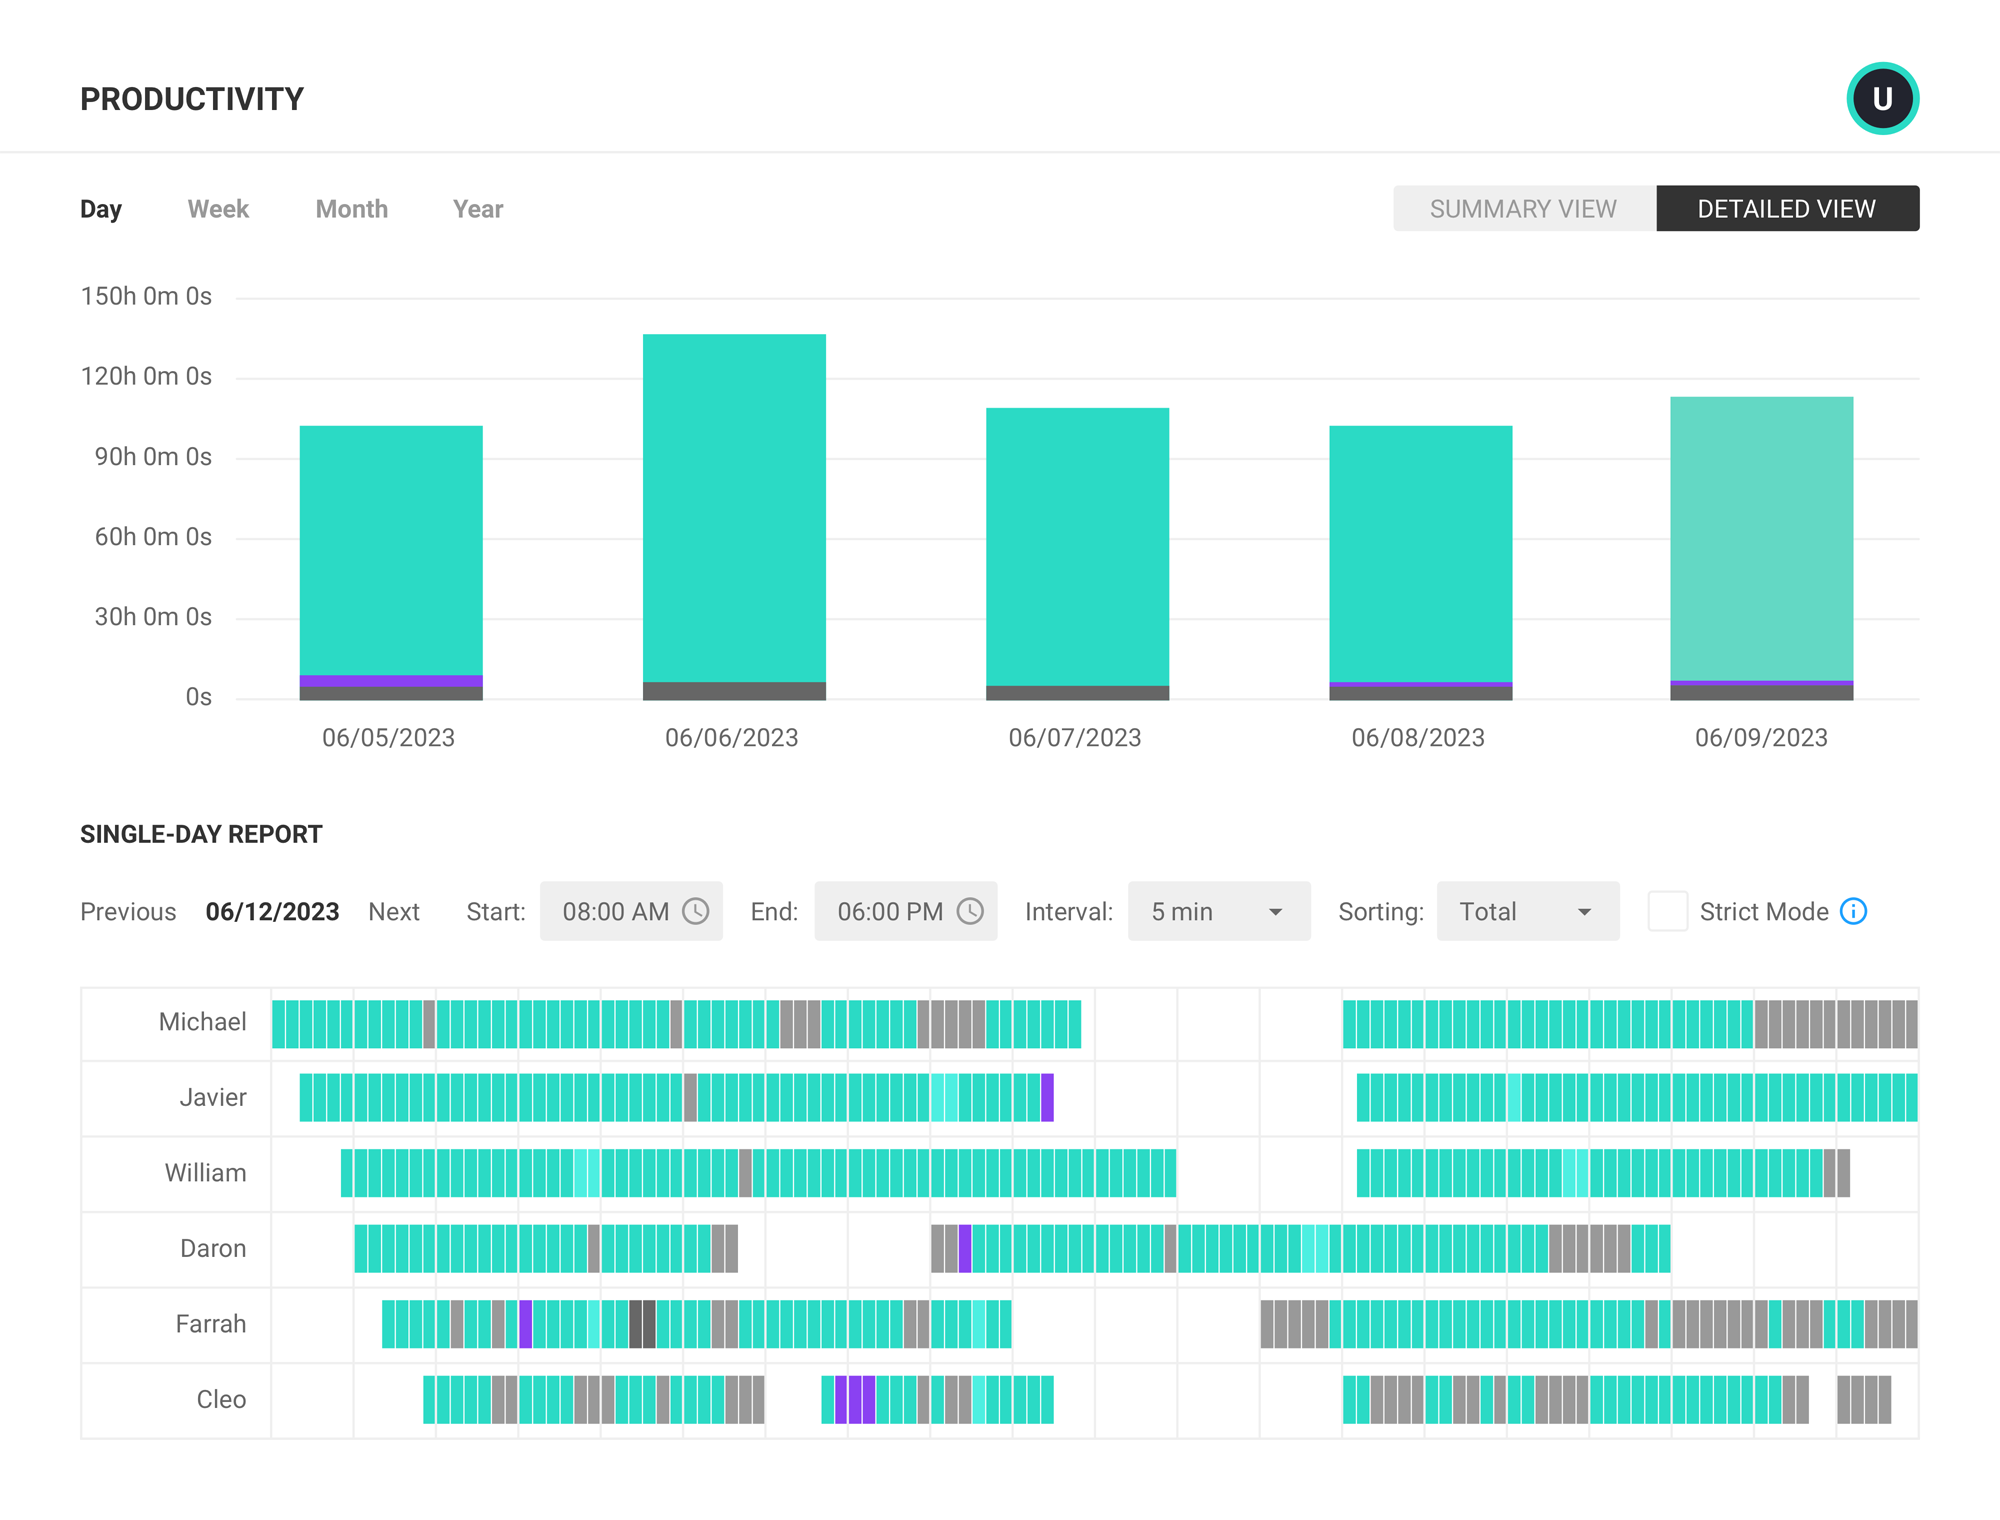
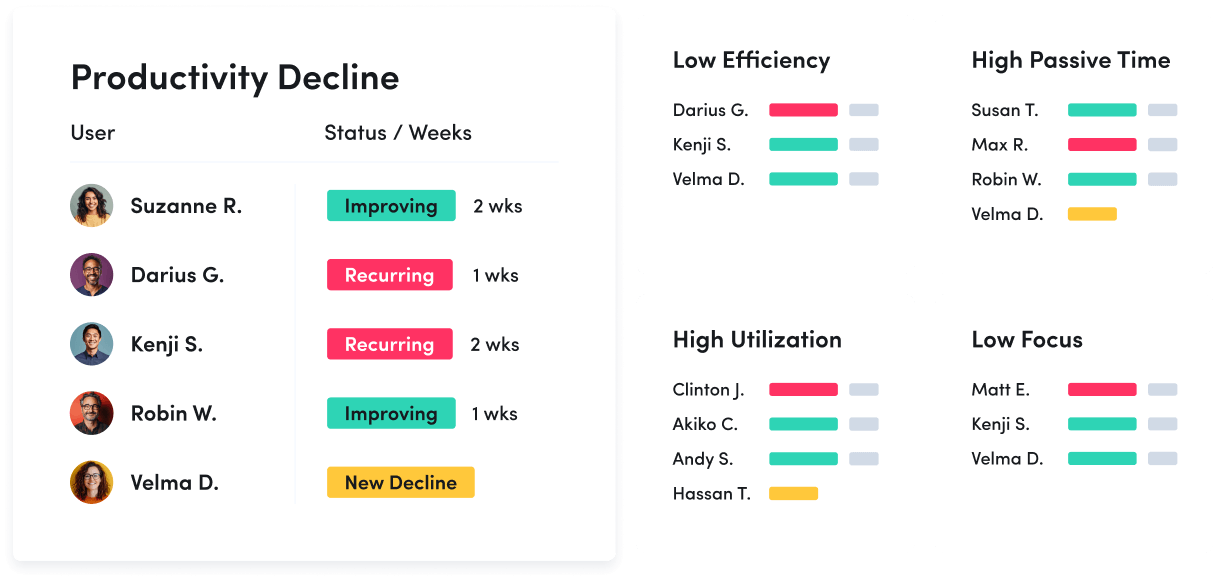
ACTIVITY ALIGNMENT
Monitor time spent on work that drives results
- Identify and eliminate time spent on low-value work.
- Ensure core activities contribute to business results.
- Uncover distractions and opportunities for performance coaching.
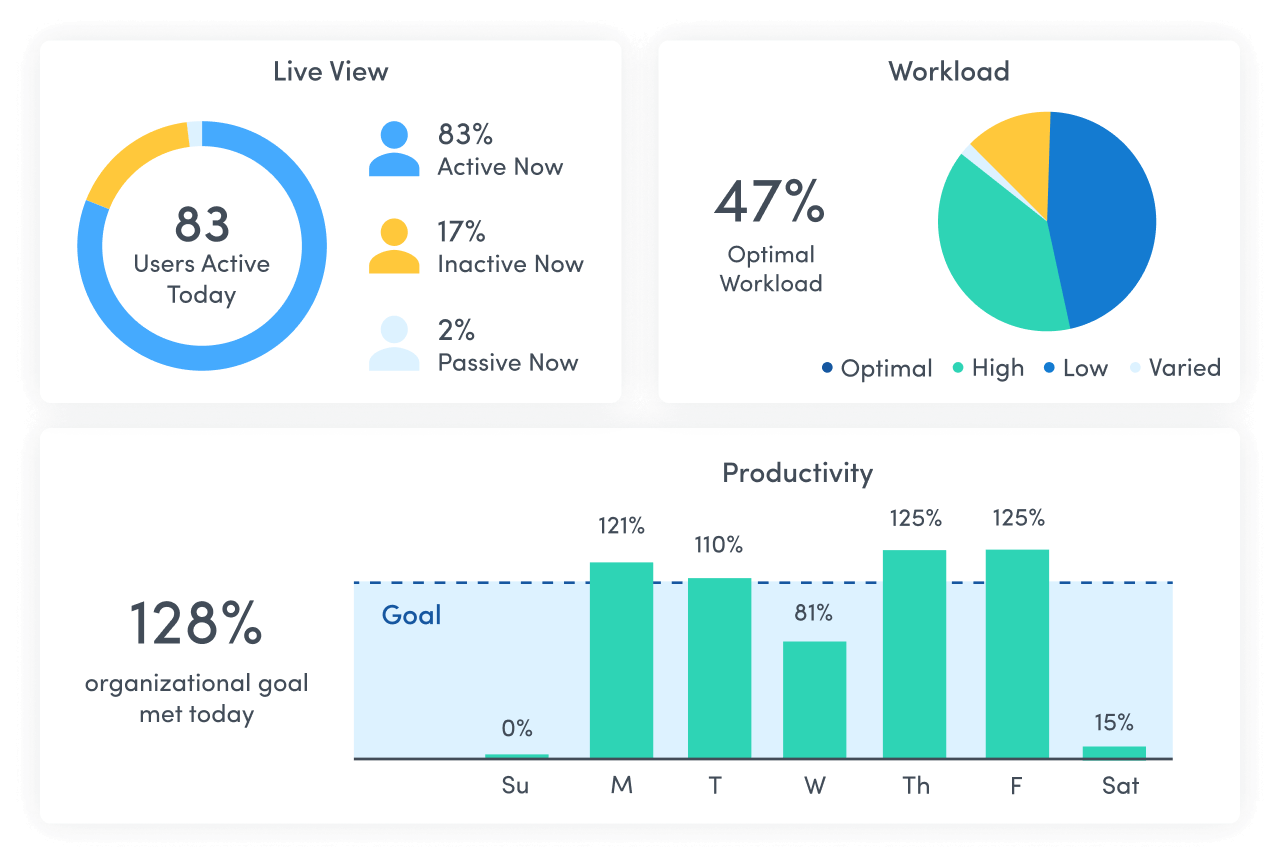
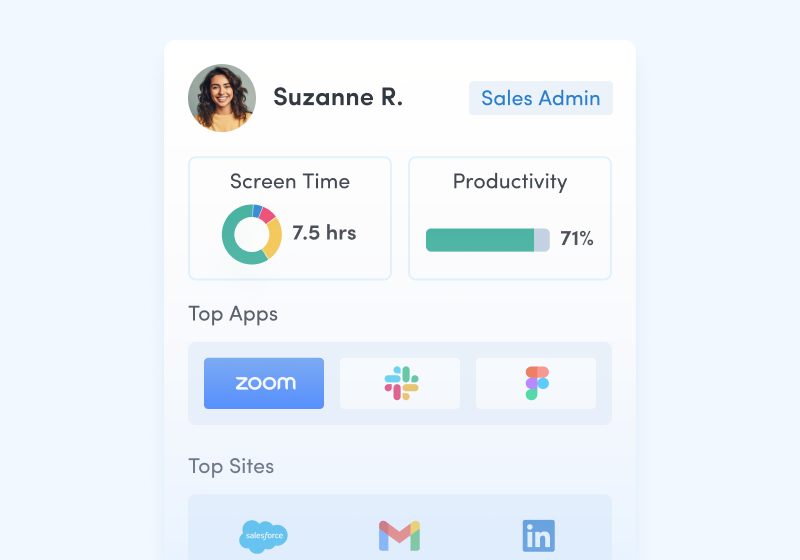
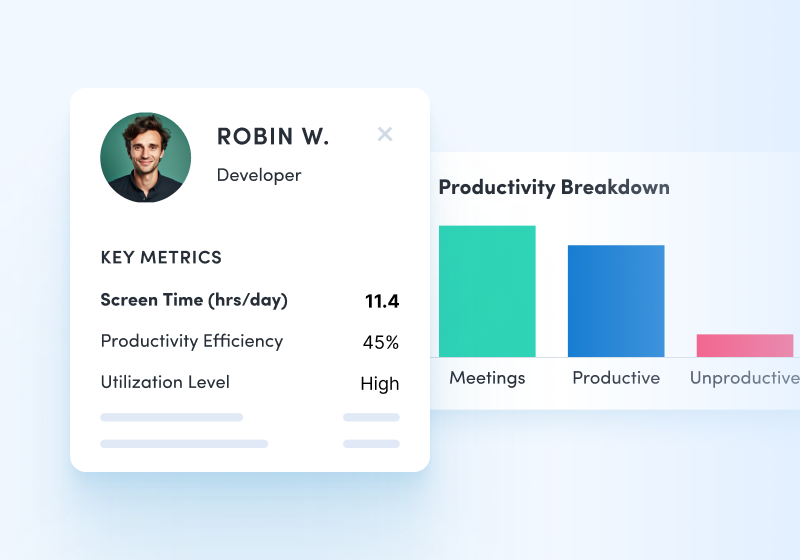
PRODUCTIVITY INSIGHTS
Measure workforce activity with ease
- See how employees divide time between focused work, collaborative activities and multitasking.
- Compare productivity levels of remote, hybrid and in-office teams.
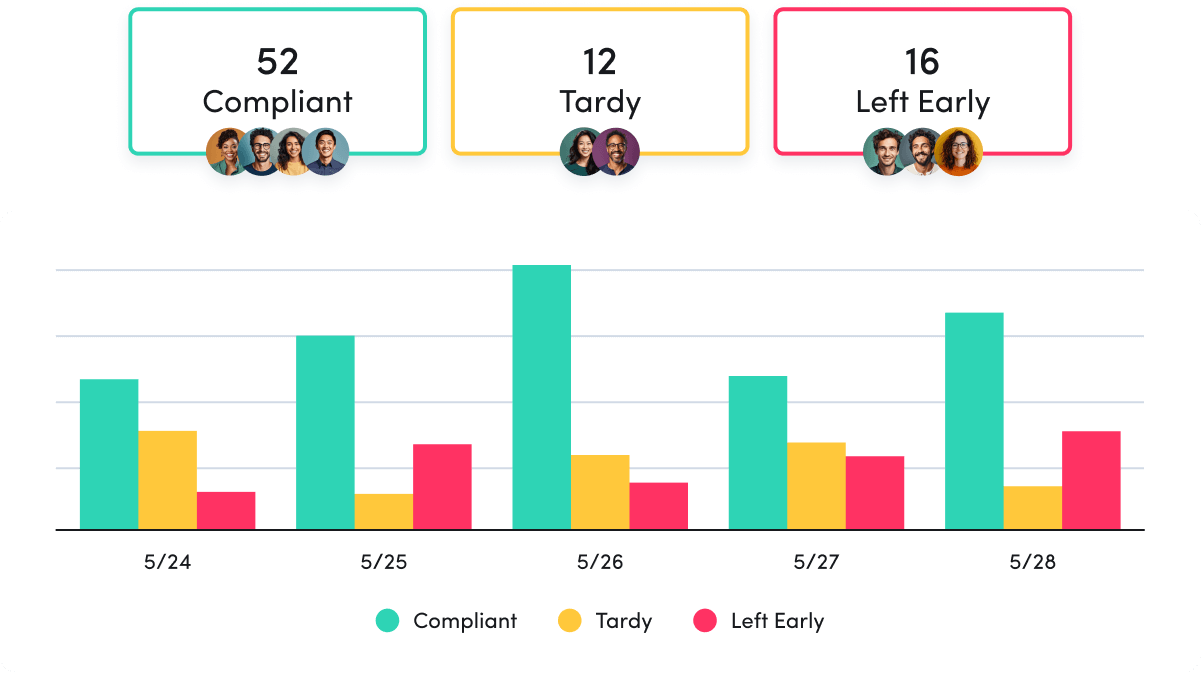
- Enforce workplace policies with real-time compliance data.
What you can do with ActivTrak
ActivTrak gives you the work intelligence to understand how work happens across people, tools and AI. Measure productivity, improve efficiency, and see how AI is changing workflows—so you can improve performance across your organization.
Executive Insights
Transform workforce data into boardroom-ready insights. See cross-team performance, identify hidden cost savings and make confident decisions that drive measurable business outcomes.
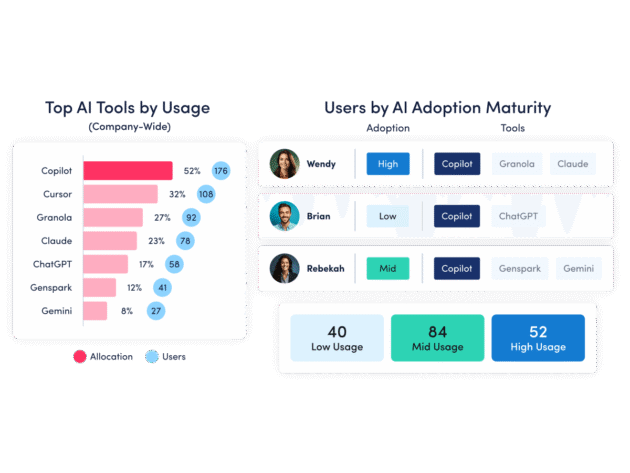
AI Insights
Understand how tools — and AI — are shaping work. See how applications and AI tools are used. Identify what’s driving value, where licenses are underused and how workflows are evolving.
Workforce Management
Understand how work happens across your organization. Analyze work patterns across teams, roles and tools to see where time goes, where friction exists and where performance can improve.
Productivity Optimization
Improve performance with data-driven insight. Quantify productivity, identify capacity and help teams work in more effective, sustainable ways.
Technology Usage & Compliance
Optimize technology investments and ensure compliance. Understand which applications and websites employees use to drive adoption or cut costs, and enforce policies aimed at mitigating risk.
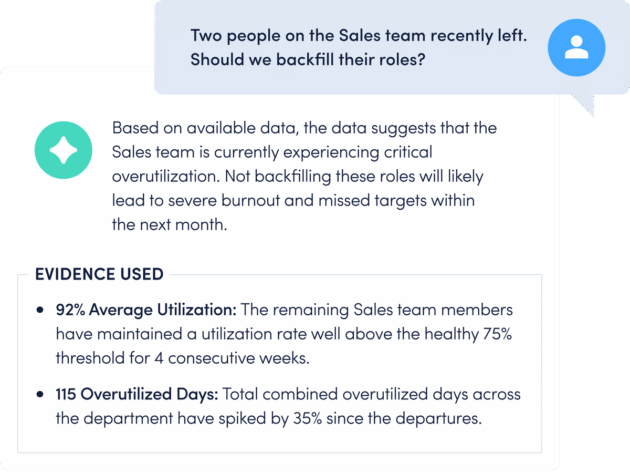
Work Advisor
Let ActivTrak’s conversational AI assistant pull directly from your data for evidenced-backed answers to pressing questions. Skip the manual analysis and get instant insights on work habits, staffing needs, attendance and more.
Connect work intelligence across your tech stack
Integrate existing tools to combine workforce activity, AI usage and business data for deeper, more actionable insights.
Workday
ADP

Microsoft Teams
Outlook

Google Calendar
ServiceNow
Zendesk
ChatGPT
Claude
Gemini
Microsoft Viva
Jira Software
Salesforce
Slack
How It Works
Capture behavioral activity
Capture behavioral activity including hours worked, schedule adherence, location policy compliance and app & website usage.
Analyze productivity trends
Analyze productivity trends on employee focus, engagement and utilization to make data-informed decisions on resource allocation.
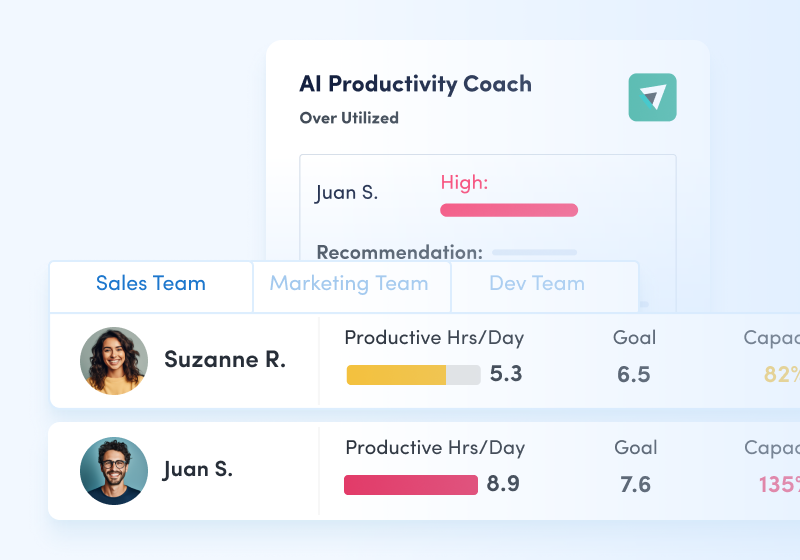
Optimize team performance
Optimize team performance with benchmarks, goal-tracking and AI coaching recommendations to improve workforce productivity.
See what customers say about ActivTrak
Powered by![]()
Getting started is easy. Be up and running in minutes.
Workforce Optimization Software FAQs
What is workforce optimization software?
Workforce optimization (WFO) software is a type of software that improves employee productivity by gathering information about work habits to identify patterns that fuel success and areas for support. Workforce optimization tools and applications give insight into how employees spend their time, workload balance and productivity levels among in-office, hybrid and remote workers. By understanding how employees work best, managers can provide personalized coaching to improve productivity in the workforce. For example, using workforce optimization software, managers can create schedules based on demand and availability or help employees learn to manage their time more efficiently.
What is an example of workforce optimization?
Workforce optimization is a strategic process that combines data, technology and best practices to improve efficiency across the organization and on a team or individual level. For example, if a company wants to decide whether or not a new technology is worth its cost, managers and leaders can implement WFO software like ActivTrak to collect and analyze data about the technology. This could include uncovering unused licenses for apps or if tools duplicate processes unnecessarily. Leaders can also see which apps or tools employees use most and how effectively they use them.
With this data, IT leaders can cut costs and more accurately forecast technology needs. Managers can also implement training on tools and apps that individuals struggle with and cybersecurity teams can block websites that distract employees from work. In this way, workforce optimization software helps organizations cut technology costs and get a better return on their tech investments while also helping employees manage their time and uplevel their skills in data-driven ways.
What are the benefits of workforce optimization software?
The use of workforce optimization software is growing across organizations due to its benefits. Spherical Insights reported the global workforce optimization market size was valued at $8.25 billion in 2023 and is expected to reach $22.45 billion in the next decade. According to Verified Market Research, about 68% of large U.S. enterprises had already implemented sophisticated workforce management software as of 2023.
WFO software provides many benefits to businesses, such as:
- Boosting productivity: A WFO system provides managers with data about the work habits that empower top-performers to succeed so they can encourage those habits across the team to replicate the results. On the other hand, managers can also identify ineffective work habits or training gaps among employees and offer personalized coaching to help each worker perform their best. Outside of individual insights, managers may also uncover team or organizational bottlenecks to empower better productivity across teams.
- Increasing engagement: Workforce optimization software helps managers understand which employees are engaged or if any have signs of burnout, which can lead to low productivity and turnover. By proactively watching engagement, managers can step in to support at-risk employees before it becomes a larger issue for the employee or team.
- Reducing costs: Workforce optimization software provides insights about work habits, including activity data about the applications and technology your team uses. Using these insights, managers can reduce costs by eliminating expensive tools that aren’t being used or offering training to improve their usage.
- Improving customer satisfaction: Organizations that use WFO tools can provide better service to customers through more timely and effective delivery and more positive customer service experiences. By streamlining productivity, optimizing scheduling and increasing skills, organizations empower employees to provide a better customer experience overall.
What is the difference between workforce management and workforce optimization?
While they often go hand-in-hand, workforce management software and workforce optimization software have distinct characteristics. Workforce management (WFM) software focuses on logistics, such as efficient planning and scheduling or tracking employees’ time usage and attendance. WFO builds on this data and provides insights into how to improve the workforce, including resource management, performance management and coaching tools. Workforce optimization software often provides more predictive analytics for forecasting.
For example, ActivTrak’s WFM solution provides team management, location insights, impact analysis, workforce capacity planning, workflow visibility, productivity reports and operational compliance data to manage your workforce. ActivTrak’s WFO solution includes financial loss analysis, headcount and capacity planning, technology usage, activity alignment and productivity insights to push your business to be better. Learn more about ActivTrak’s workforce management solution here.
Who needs workforce optimization software?
Any organization that wants to improve how its workforce functions can use WFO. The software is best suited to organizations that want to use data to reduce costs or waste, improve productivity and performance across teams and enhance customer satisfaction. Large corporations, distributed teams and service-based organizations are likely to have the resources to implement an effective WFO software solution and see the best results.
Several industries benefit most from the software, such as:
- Call or contact centers
- Hospitality groups
- Retail organizations
- Logistics companies
- Enterprise organizations
- Distributed workforces or organizations that offer remote or hybrid work environments
Can small businesses benefit from workforce optimization software?
Yes, businesses of all sizes can benefit from workforce optimization software. However, it’s important to note that WFO implementations require resources and attention to function optimally. If your small business has the time and resources to commit to a workforce optimization software solution, it may be the right choice. There are cost-effective WFO options for small businesses, many of which can scale with your company, such as ActivTrak.
Should you purchase workforce optimization software?
Leaders may wonder if purchasing workforce optimization software is actually necessary, but a solution can recoup its cost in many ways. Productivity improvements drive better business results; higher engagement reduces turnover and application usage insights reveal which programs can be cut to reduce expenses. By providing data-backed insights, managers use WFO software to make better decisions that help employees and the organization.
When it comes to choosing a workforce optimization solution, you may find that some tools and applications provide limited functionality while more comprehensive software like ActivTrak offers enhanced capabilities. Consider your business size and goals to determine the scale of the solution you need.
What is the best workforce optimization software?
Finding the right WFO software for your organization will depend on your company’s size, industry and specific needs. Workforce optimization software solutions need to collect and analyze the right data and provide tailored insights. Look for WFO software that includes:
- Financial loss analysis: Uncovers untapped labor capacity and associated salary costs, translating productivity gaps into concrete metrics automatically and providing filters to nail down immediate cost-saving opportunities.
- Headcount and capacity planning: Provides strategic staffing insights to identify hiring needs, including data on untapped capacity and skills-based issues to prevent overhiring and empower training programs. The program should provide real-time reports on workload balance, capacity costs and other workforce-related information so you can make data-driven decisions.
- Technology usage: Shows clearly which apps and websites your employees use to do their work and which tools may be a distraction, as well as unused licenses, underused apps and duplicate tools to reign in tech spend.
- Activity alignment: Shows you which low-value work would be best to automate so you can free employees up for work that contributes to business goals. Also, this data should include insights into focused performance coaching for individuals and teams.
- Productivity insights: Shows how employees spend their time, including focused work, collaboration and multitasking, as well as how productivity is affected by location (in-office, remote or hybrid work environments). This should include real-time compliance data to enforce workplace policies before a potential breach becomes a real problem.
Beyond the type of data a WFO software should collect, it should also have the following features:
- Customizable to your organization’s needs
- Easy-to-use and understand dashboards and reports
- Data-based insights
- AI-powered analytics and automation
- Real-time data and tracking
- Privacy, security and compliance tools
- Integrations with other software for seamless implementation
- Excellent customer support and service
ActivTrak’s workforce optimization software provides these features and more. Over 9,500 businesses rely on ActivTrak for workforce optimization and management. Get in touch with our sales team to get customized solutions for workforce optimization at your business.