We all know sales productivity is key to driving your company’s success. But what makes a great sales rep? Do you know what sales productivity metrics lead to sales force effectiveness? You may have assumptions, but what if you had real, unbiased data at your fingertips?
Relying on CRM Data Doesn’t Tell the Entire Story Around Sales Productivity
Sales reps often spend a majority of their productive time completing tasks in applications like Salesforce to qualify leads and build a pipeline of opportunities. Still, it’s nearly impossible to tell the entire story of your sales team by only relying on your CRM data. Because your organization likely uses countless tools to keep everything running smoothly every day, an over-reliance on one set of data can be problematic.
Most CRM data is generated through manual input from sales staff. Sometimes this data is accurate and complete, but oftentimes it is not. High-performing team members can become too busy to keep up with their administrative tasks, and lower-performing team members may intentionally inflate metrics to avoid attention on their performance.
The only real way to understand sales productivity patterns, such as which activities or habits lead to successful, qualified pipeline generation, is to combine workforce analytics with your CRM data. This gives leaders a clear picture of what is working and what’s not, allowing swift adjustments that can be essential to meeting sales quotas, and invaluable to the company’s bottom line.
Integrate Sales Productivity Metrics with Sales Activity Metrics
ActivTrak, a leading workforce analytics platform, integrates with popular business tools to unlock deep, data-driven insights about how work gets done in your company.
We’ve released our integration with Salesforce, which enables you to combine workforce productivity metrics from ActivTrak with the lead and opportunity metrics in Salesforce. With this integration, sales leaders can identify work habits that contribute to improved sales outcomes.
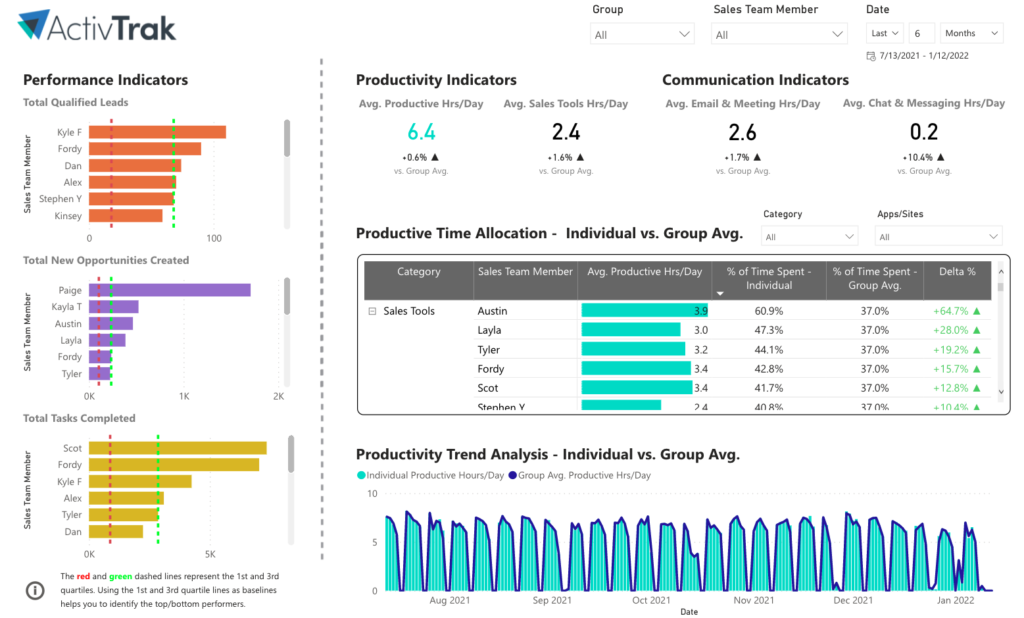
By combining sales productivity metrics with workforce productivity metrics, you can identify the activities and behaviors that contribute to sales productivity metrics like new deal creation and task completion, including:
- Side-by-side productivity metrics
- New leads qualified vs. productive time
- New opportunities created vs. productive time
- Tasks completed vs. productive time
- Time spent in collaboration and sales tools
- Number of leads qualified, opportunities created, and tasks completed
Understand Sales Force Effectiveness & Help Your Team Succeed
With a complete picture of sales processes and key insights gathered about work habits and time spent on digital activities, sales managers can more effectively coach sales reps. This includes recognizing successes, intervening early with low performers, and effectively onboarding new reps faster.
How it Works
ActivTrak’s integration with Salesforce offers several ways to leverage the data. The easiest way to get started is by leveraging pre-built templates for Microsoft Power BI (included). These dashboards make visualizing deep sales productivity insights of sales reps easy, offering side-by-side metrics from Salesforce and ActivTrak that show correlations and ratios for lead and opportunity management. Learn more about each pre-built dashboard in the following sections.
User Analysis:
With this dashboard, you can gain an understanding of which work habits drive the most success and pipeline generation.
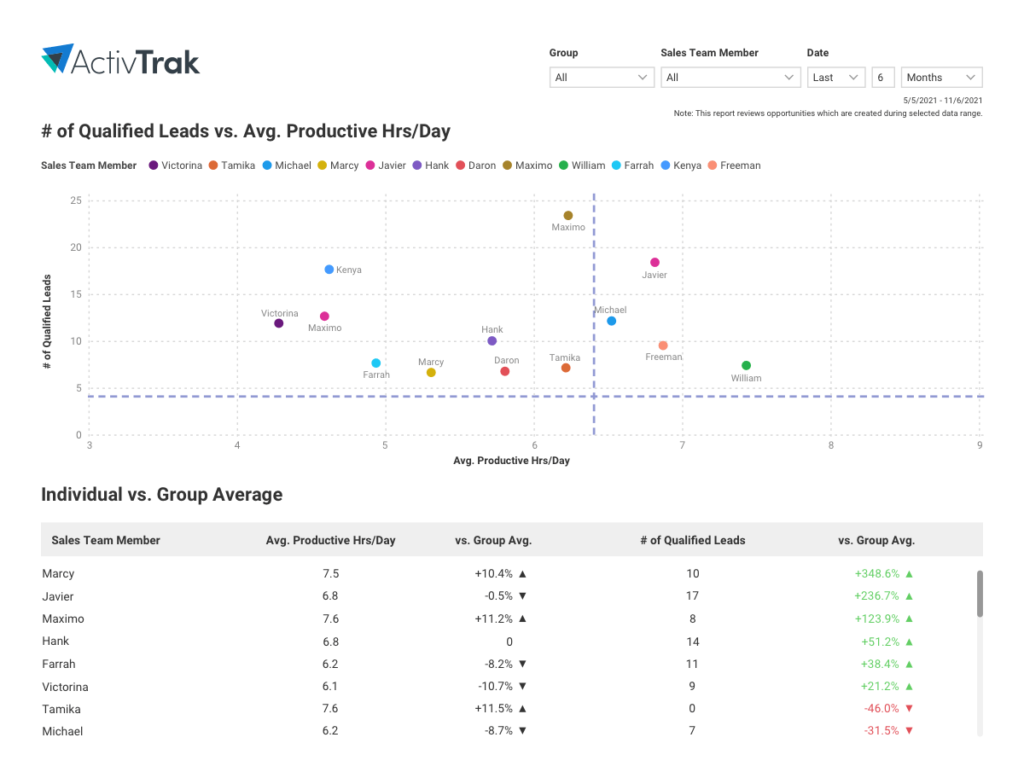
Leads Versus Productive Hours:
With this dashboard, you can compare the performance of sales team members by correlating the number of leads each sales rep qualifies per day versus the average productive hours per day.
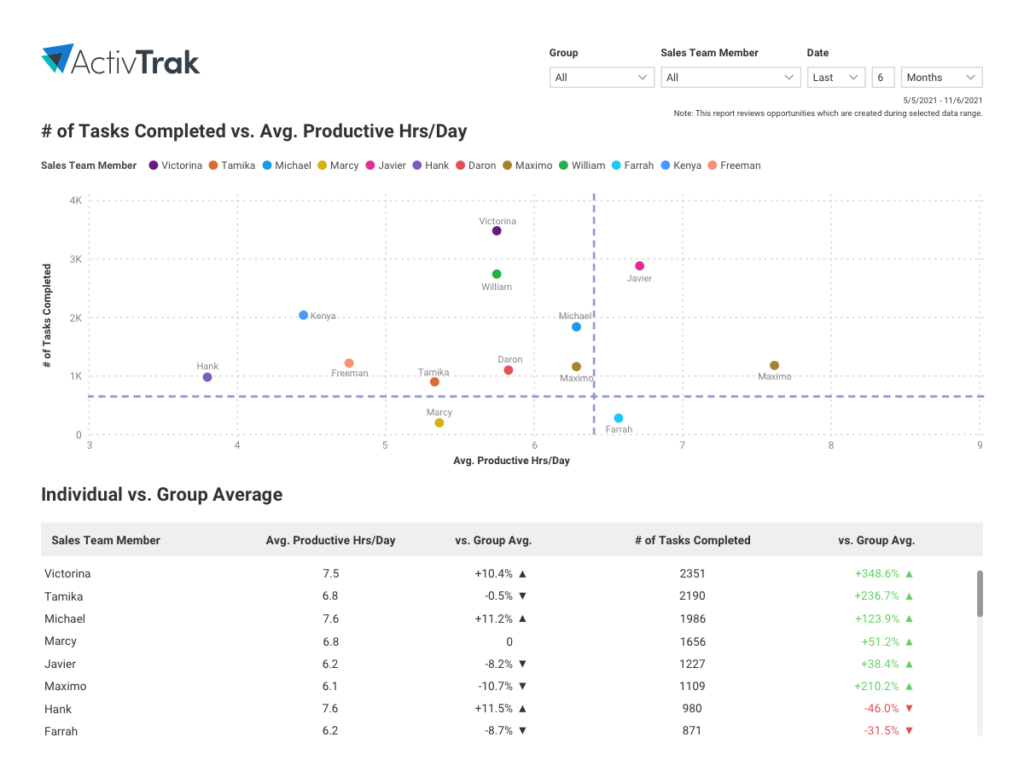
Tasks Versus Productive Hours:
With this dashboard, you can compare the performance of sales team members by correlating the number of tasks completed per day versus the average productive hours per day.
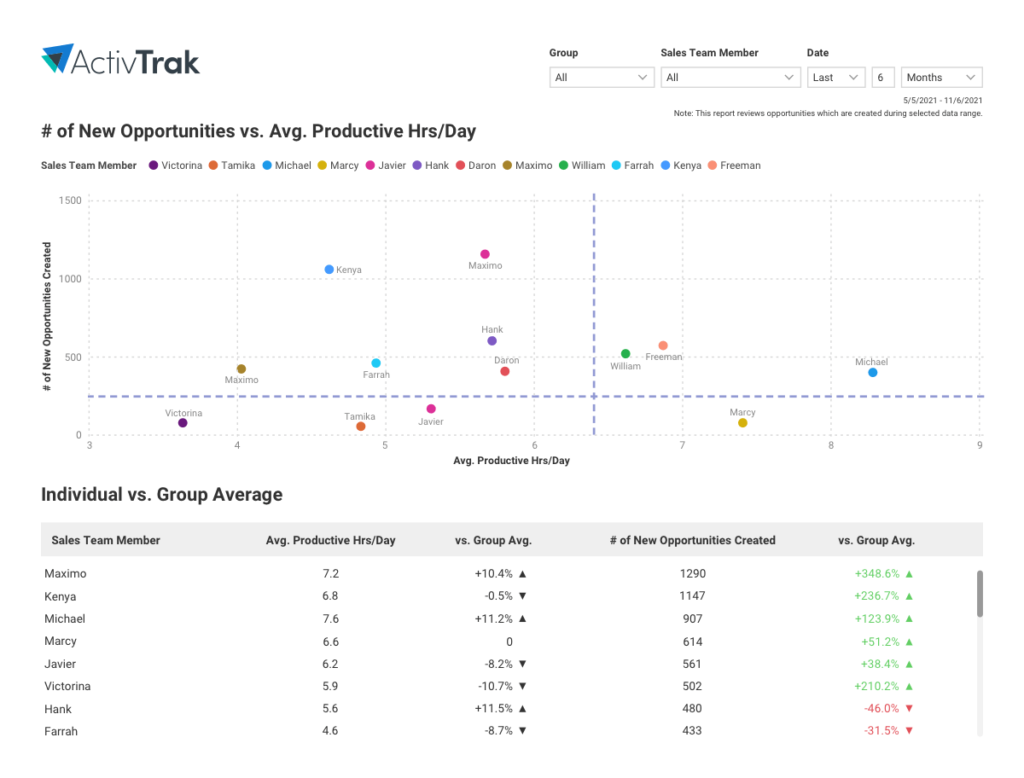
Opportunities Versus Productive Hours:
With this dashboard, you can compare the performance of sales team members by correlating the number of opportunities created by each sales rep per day versus the average productive hours per day.
For broader analysis and reporting on salesforce effectiveness, you can pull your Salesforce data into our data repository to correlate ActivTrak workforce metrics with Salesforce performance data, matching users by username and email.
Bringing it All Together
ActivTrak’s Salesforce integration is available for paid plans with the ActivConnect add-on and an activated Microsoft Power BI Pro license for content publishers and viewers. Using combined, deep sales productivity insights, sales managers can easily coach and empower sales reps to focus on what matters most – getting results.
This is just the beginning for ActivTrak integrations. To learn more about how to combine workforce productivity data from ActivTrak with other business applications, such as Lattice, click here.
Take the Next Step
- Read more about ActivTrak integrations
- Don’t have ActivTrak? Sign up for a free account in minutes
- Contact us with questions
About ActivTrak
ActivTrak helps companies unlock productivity potential. Our award-winning workforce analytics and productivity management software provides expert insights that empower people, optimize processes, and maximize technology. Additionally, with data sourced from more than 9,500 customers and over 450,000 users, ActivTrak’s Workforce Productivity Lab is a global center for ground-breaking research and expertise that helps companies embrace and embody the future of work.