Collecting data for the first time is exciting and eye-opening. We suddenly identify insights that we may have never seen through mere observation. I love observing the insights at the 30 and 60-day mark with our customers.
Operations professionals are blown away at the productivity highs and lows across the organization while HR professionals immediately take note of where burnout and disengagement hide from the view in engagement survey results that are occasionally reported.
CIOs and FP&A professionals lean into the conversation – curious to understand how ActivTrak data answers pertinent questions around spend and efficiency. And while all of this excites me, my favorite conversations are those where customers have amassed 18, 24 and 36 months of data.
These companies can see the impact of their productivity investments and organizational efforts over time — right at their fingertips. This is where we can track business transformation. Here are the three trends categories we look at with ActivTrak customers to better understand the health of an organization over time.
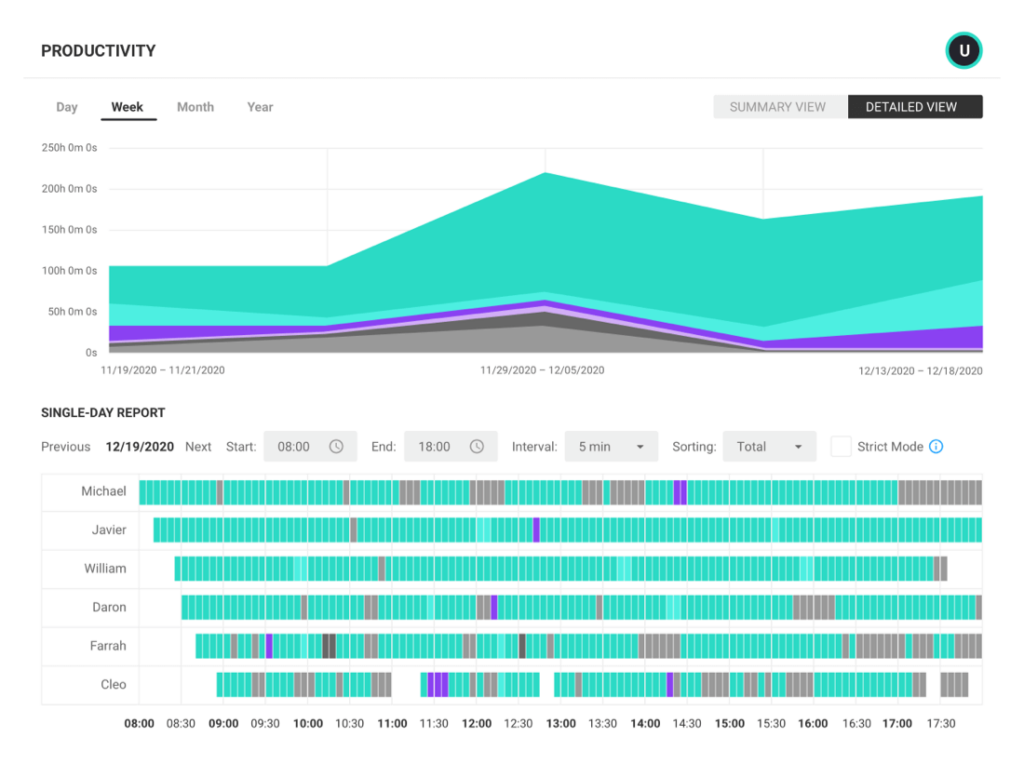
1. Productivity & performance
When we assess productivity over time, we can understand how the organization behaves on average versus in specific moments of deadlines or disruptions. While it’s not uncommon to have spikes or lulls in productivity within any given day, healthy organizations seek consistency over time.
When week-over-week declines surface, leaders gather to talk about not only the impact of the decline but also the root cause. When productivity steadily climbs, they’re apt to pinpoint the transformational efforts and investments contributing to the improvements.
At the heart of our product, we aim to showcase productivity trends over time to drive greater visibility into sustainable improvement. So it’s not surprising that this is our most frequently visited trend analysis by leaders across each role.
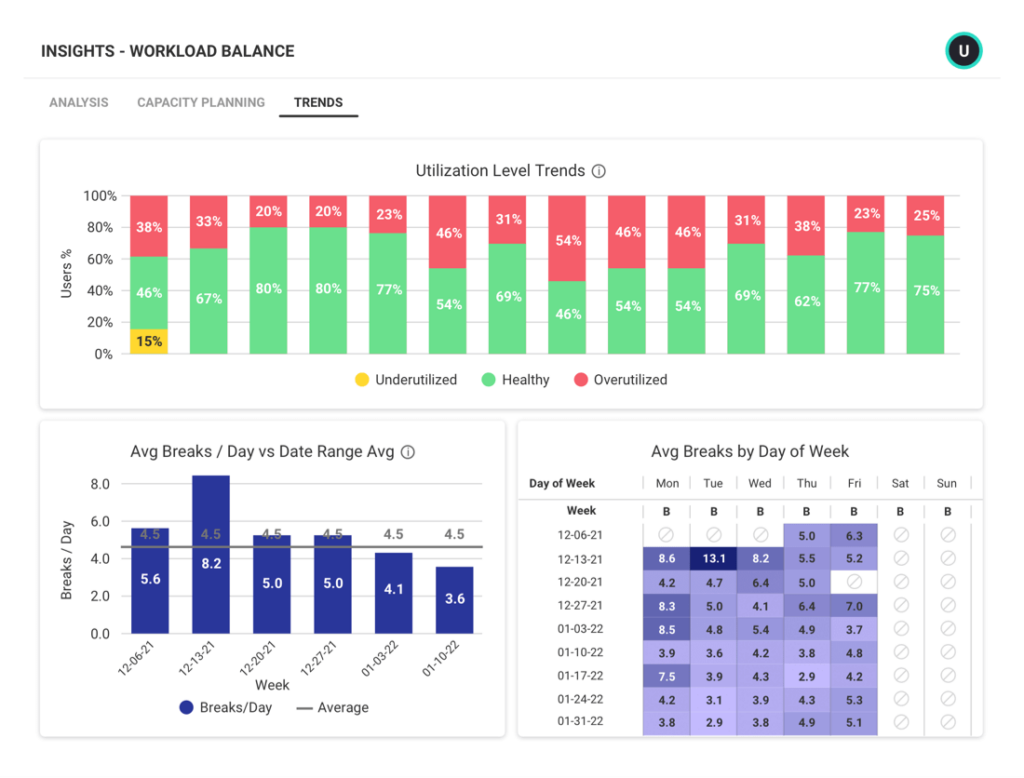
2. Engagement & burnout
With themes of overhiring, burnout and quiet quitting, HR leaders leverage the same ActivTrak data set but with a different lens in mind. In viewing workload balance trends at the organizational level, the HR leader can see when and where to hire or where they may have excess capacity.
With additional context, they’re apt to identify a team in need of support due to employees well over capacity (overutilization) or a team with a struggling manager whose team is rapidly disengaging (underutilization). Moreover, when investments are made to increase the productivity and retention of existing employees (i.e., manager training, at-home office stipends, wellness benefits, etc.), people leaders leverage ActivTrak engagement and burnout trends to gauge the impact of their investments.
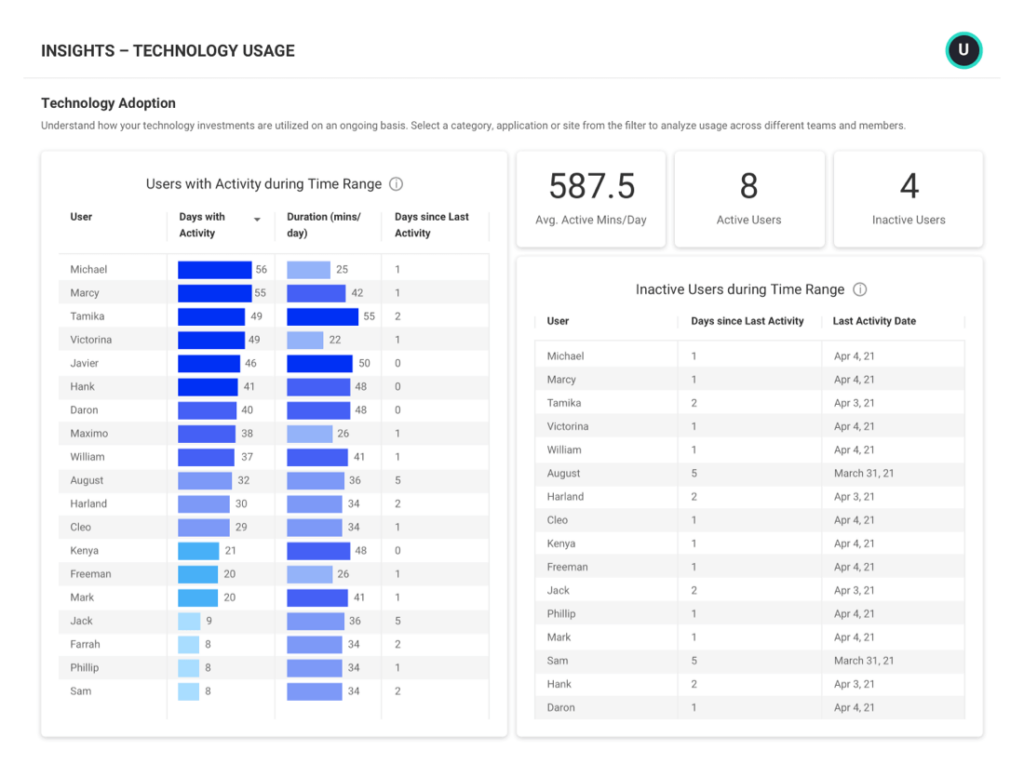
3. Technology adoption
The newest tool in the tech stack often gets the most attention…until there’s another new tool. And at this rate, new tools are frequent. The ActivTrak 2023 State of the Workplace Report indicated that organizations added 20% new tools, apps and sites to their environment in 2022.
CIOs leverage ActivTrak data to better understand how technology solutions are used over time. Technology adoption trends that reveal the ongoing usage habits of the workforce may surface where licenses can be downsized or reallocated. Alternatively, for teams achieving exceptional results, these same trends will highlight the solutions used in their environment and assess how tools can be scaled to assist other teams across the organization.
CIOs are eager to understand how they can optimize their tech stack amid the noise created by unadopted, misaligned or untrained solutions proliferating the space.
Leaders often ask me, “What do we do next?” after looking at their trends and insights. Well, it depends on what we’re looking at. With the insights from the last 18 months, leaders can make more informed decisions. For example, they may cease certain efforts that are expensive and don’t yield productivity gains. And other insights will suggest they further invest by scaling solutions to other parts of the business or ramping up their efforts to yield even greater productivity.
Historical look-back data coupled with routine analysis helps guide our customers to strategically make start, stop and continue decisions across their businesses to ensure higher efficiency and exceptional results.
Learn about ActivTrak’s Top 10 Productivity Insights or request a demo with one of our experts.