Over the past 3 years, ActivTrak has seen tremendous growth, most recently ActivTrak was ranked 299 in the Deloitte 500 of the fastest growing companies in North America. Not only did our infrastructure need to scale to support the influx of new customers and their employees, but many grew from accounts with hundreds of users to accounts with tens of thousands of users. This growth has been a welcome opportunity for us to deliver powerful workforce analytics to organizations that rely on productivity data to navigate workforce-related challenges of the COVID-19 pandemic and economic uncertainty.
Keeping up with this growth at scale required the ActivTrak engineering teams to evolve our infrastructure to support access to critical data and insights at the speed of their business.
As a level set, ActivTrak is 100% built on the Google Cloud Platform (GCP).
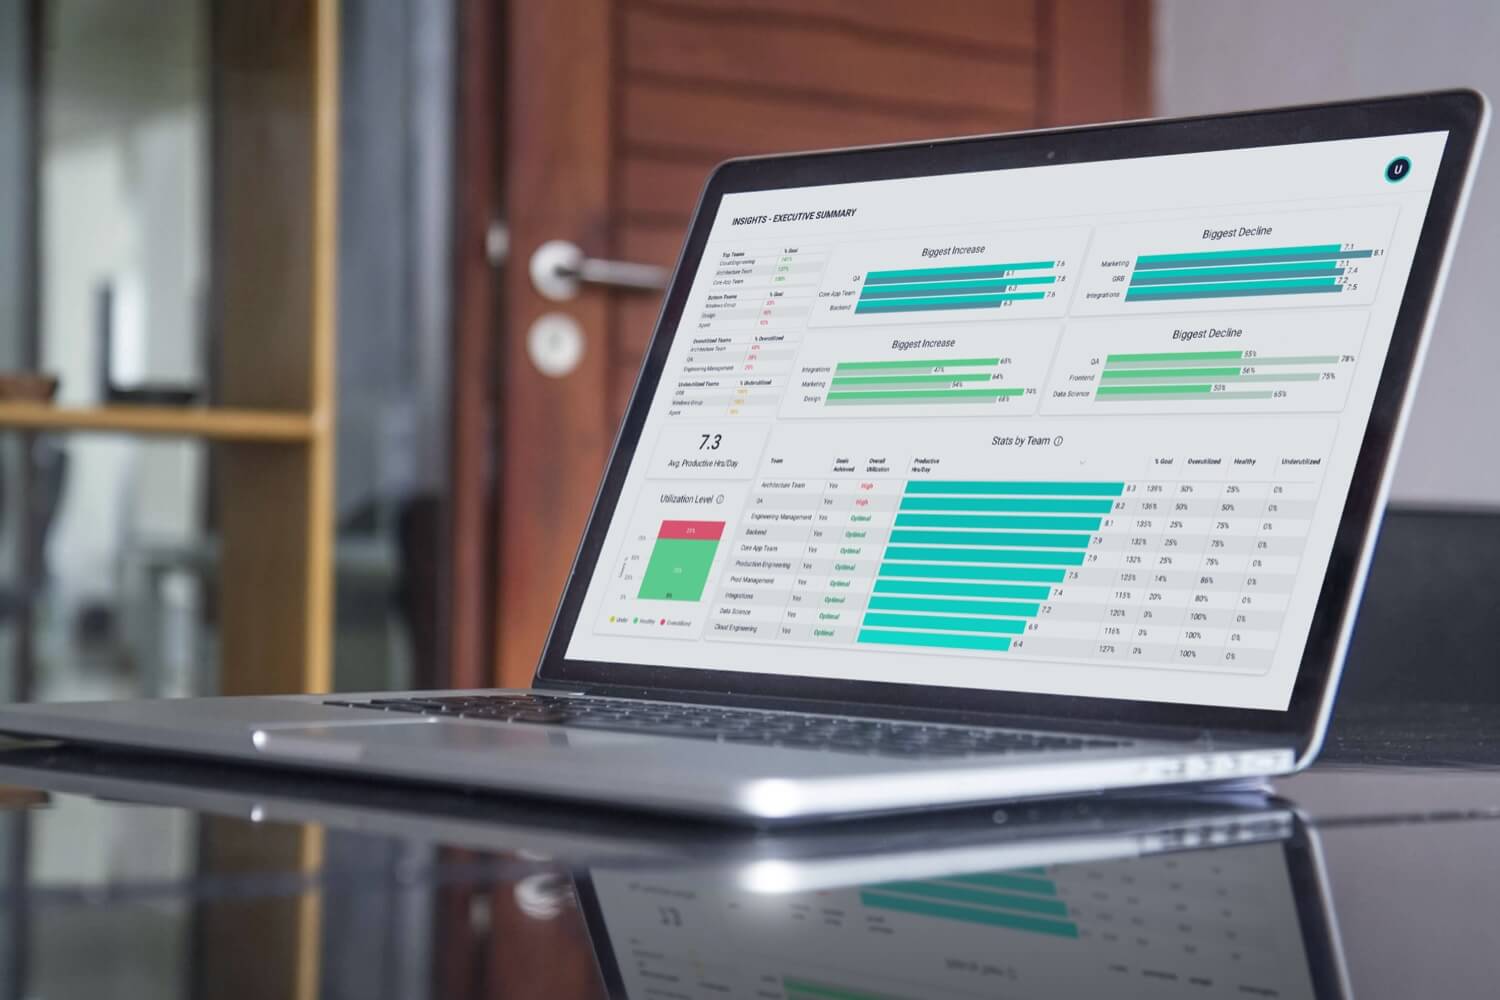
Our first order of the day was to reimagine ActivTrak’s Live Reports that provide real-time data on how an organization is working. They help managers and decision-makers understand the effectiveness of hybrid work. The data identifies where teams are excelling as well as areas of improvement or individuals that may need coaching while empowering employees with their own private and personal insights for self-awareness and digital well-being.
Our engineering team was challenged with the task of re-architecting the way data is both cached and queried to allow reports to load faster, while also enhancing the overall user experience, export capabilities and laying the foundation for a new public API.

The above picture shows a simplified view of the original architecture. Smaller accounts primarily query against Cloud SQL and large accounts primarily query against BigQuery
So why did we need to take these steps as the volume of customer data grew larger? First, we should talk about the type of data our system manages. ActivTrak activity data is primarily time series data. We capture activity events for each user/computer and for each application/website – including timestamps and durations. As an account adds more users, it generates more events. Small accounts may generate a few thousand records in a day. Large accounts generate millions of events per day. If a user requests a Live Report, a query might execute against hundreds of millions of records at a less-than-optimal speed.
For most reporting systems, the solution to this problem is pretty clear; aggregate your data ahead of time and add a caching layer. If you aggregate the data ahead of time(instead of millions of records), the query only has to scan thousands of records. The requirements for ActivTrak’s Live Reports introduce technical challenges to this approach. To start, customers can query the data across multiple dimensions. These dimensions include varying the date range (which is adjusted based on timezone), the users or computers to include (or groups thereof), the productivity status (productive, unproductive, undefined), and even free-text searching on specific applications or websites. But all of those dimensions pale in comparison to the added complexity caused by the classification system.
Classifications allow an administrator to assign both category and productivity status for each application and website. These classifications can be set at the group level, account level, or even a global level (auto-classification across all customer accounts). Classifications also allow the user to configure an app or website to selectively be ignored from report data. And most challenging of all, classifications impact reports retroactively. If you classify an application today and then look at a report with data from last month, the new classification needs to be represented historically. For more details on classification see our recorded Classification 101 webinar.
To avoid recalculating aggregations for an account’s data on each classification change, account time zone adjustment, or group assignment updates, we came up with a hybrid approach to pre-aggregating the reporting data. Our hybrid approach splits the report data into two parts: immutable data and mutable data. Immutable data is data that cannot change. This data can be precalculated and cached with ease. Mutable data can be changed which makes it less cache-friendly. If we can find a way to get most of our data to fall into the immutable side of things, and aggregate the immutable data ahead of time, we can simply combine the pre-aggregated immutable data with the much smaller mutable data on each request. This should allow us to provide answers to our users much faster.
Live Report queries can dynamically select any combination of users (individual users, groups of users, or all users) and classifications can be associated at the group level (container of users). This means we can’t aggregate data across multiple users or we’d have to recompute it every time an account updates its classifications or group assignments. Because of this, the first dimension we aggregate to is at an individual user level.
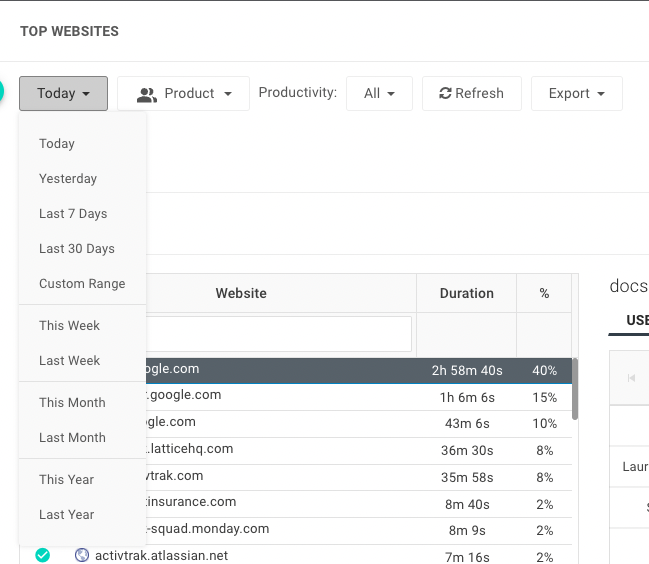
Image of date filters available for Live reports.
Live Reports provide data as granular as a single website or application. So when we aggregate user data, we need to bin it per unique website and application. Now the question comes down to which time interval to use? The larger the time interval, the more performance we can gain, as it allows us to collapse more records into fewer records. Unfortunately, our time intervals are bounded by the dynamic nature of users and time zones.
Most individuals that haven’t dealt with time and time zones before may believe there are at most 24 time zones in the world, one for each hour of the day. If that were true we could easily aggregate our data into 60-minute intervals (one per hour) and move on. Unfortunately, it’s not so simple. At the time of writing, there are currently 38 different local time zones around the world. This means they are not all aligned perfectly with an hour offset from UTC. Furthermore, there are 8 time zones that are 30 minutes offset from hour alignment to UTC. There are also 3 time zones that are 45 minutes misaligned from the UTC hour offsets.
The largest market with a 30-minute offset from UTC hour intervals is India. The 45-minute offset from UTC hour intervals includes the Chatham Islands (near New Zealand), some remote parts of Australia and Nepal.
For now, we’ve opted to not go more granular than 30-minute offsets to strike a balance in performance against cost, with the option to adjust in the future if necessary.
We now have our dimensions defined for immutable data by user and application or website, and aggregated into 30 minute intervals which are cleanly offset from UTC time (the form in which all data is stored internally). This leaves the mutable data which is simply all group assignments and application/website classification data. When a query comes into the API, we can fetch all immutable data that is possibly relevant to the request, combine it with the mutable data and filter out any records which are now classified to be ignored or don’t meet the request filters.
How do these changes impact performance?
Prior to the introduction of the reporting services, there were a few instances of performance being inconsistent across reports. In the graph below you can see how some reports were returning within 2 seconds, but longer date ranges were taking over a minute to return.
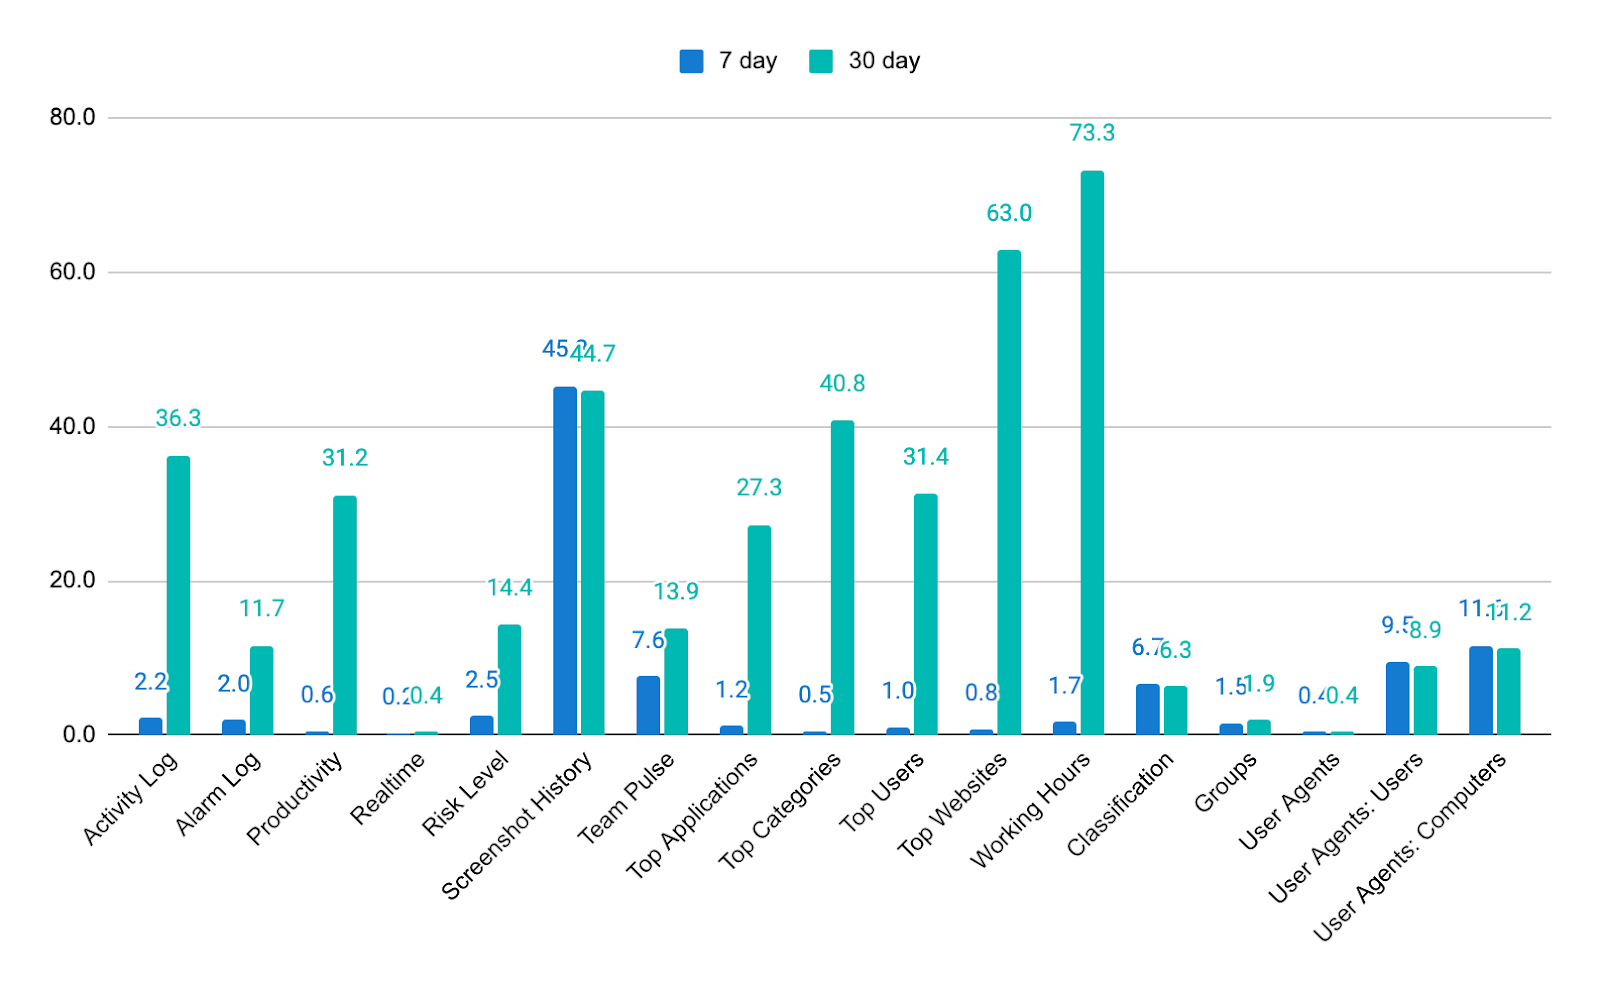
Inconsistencies in reporting service performance observed when comparing Live Reports data across 7 and 30 days, prior to the modernization effort.
After the Reporting Service was turned on, all cached data returned within 2 seconds.

The above diagram shows the new architecture. We’ve added a reporting cache (Redis) along with a brand-new Reporting API (service). We leverage stream processing to hydrate the cache and fall back to existing/legacy implementations when the new cache cannot serve the user’s request.
The new Reporting Service has been rolled out to all of the Live Reports. We are currently working to extend the reporting service for both the report exports as well as a new intraday Data API as our workforce analytics data is fast becoming a real-time operational backbone for many of our customers. Developed with the same approach, we are iteratively taking each report’s Reporting Service implementation and connecting it to the related export to ensure there is consistency across the UI and exports. Plus this shows noticeable performance improvements vs the legacy exports.
The success of our design approach in rebuilding the reporting service infrastructure is a key milestone in our journey of continuous innovation in order to evolve and scale our platform to stay ahead of business growth. Through an iterative process our architecture team was able to re-architect our data layer to ensure customers can access the data on demand to meet their business needs. Going forward we have a scalable and future-proofed architecture upon which to rapidly add new features. Stay tuned!