Like many, I have come to appreciate the flexibility and freedom that the remote/distributed work lifestyle affords me. However, fine tuning my work habits to ensure my success as a remote employee has taken time, trial and error, and most importantly, tremendous reflection and insight into my unique daily tendencies. While we all seek to maximize our productivity and productivity efficiency, we can agree that what works for certain individuals most certainly won’t for everyone. This is precisely why I am so excited to introduce you to ActivTrak’s NEW Personal Insights Dashboard, developed specifically for the individual employee seeking to better understand how they work.
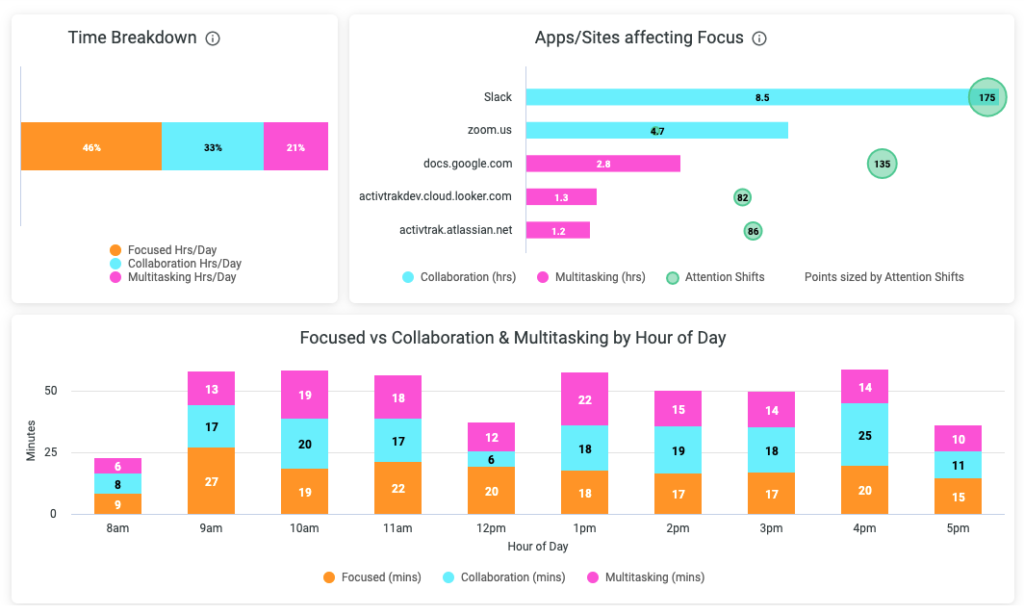
This new dashboard provides a weekly snapshot of Productive Time, which is broken down into three categories —Focused, Collaboration, and Multitasking Time — plus Workload Balance & Wellness and Technology Usage directly to an individual employee so they can understand their own work habits.
Seeing my own daily tendencies on my Personal Insights report has enabled me to better understand my work environment and personal needs in order to be more successful. I can see when I work best, how I can better focus, what apps are causing my disruptions (um, Slack!!), and perhaps most importantly, when I may be at risk of burnout. With this data, I can proactively manage my habits (turning off Slack notifications for blocks of time throughout the day) and optimize my work so that more time remains for all the other things in life that sit well beyond the computer screen. Most importantly, beyond the self-management of my own practices, I can engage in far more fact-based discussions about what I need from my team members and manager to work smarter, not harder. Here’s a bit more information on how to optimize your productivity using data from the new report:
Productivity Habits
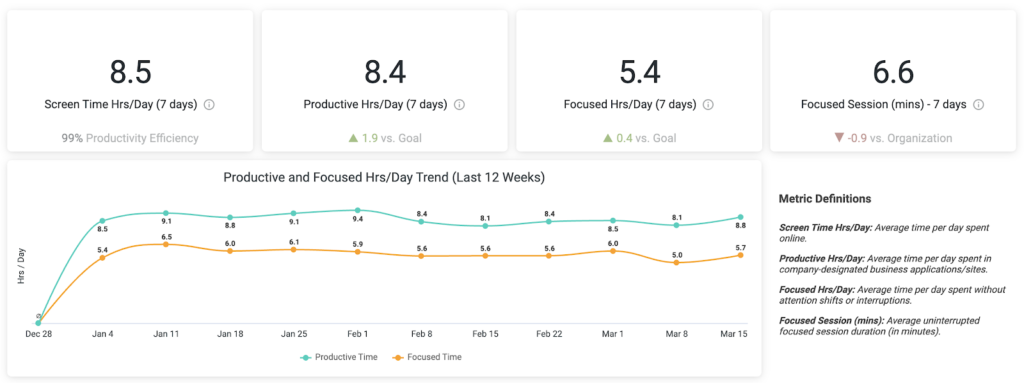
Time, by itself, is not a sufficient depiction of productivity. This is why the dashboard provides a breakdown of our daily productivity, efficiency, and focus data. While insight into productive time (the time spent on work-related apps and sites) is useful, the real value is in understanding how many hours it takes to complete our productive work — our productivity efficiency. For example, if our screen time is 12 hours/day and our productive time is 8, then we are far less efficient than if our screen time is 8.5 hours/day and our productive time is 8. This additional screen time could be valuable in terms of giving our minds a break from our work; however, it points to inefficiencies that could be otherwise draining us. (Moreover, breaks behind the screen seldom yield the intended outcome. You’re much better off going for a walk outside).
Focused Sessions shed light on the average number of minutes we are able to work without being pulled into a new activity — collaboration or multitasking. Productivity and focus behaviors are constantly fluctuating. Business priorities and deadlines, personal matters, political discourse, community unrest — they all contribute to whether we are productive or distracted throughout a given week. That’s why the dashboard emphasizes 12-week trends as a key way to evaluate deviations from the norm. While everyone’s numbers will vary based on the nature of their role, understanding changes over time can help us better understand where we may raise our hand for additional support.
The dashboard further expands on productivity breakdown. Focused time reflects deep work — a term coined by Cal Newport, the author of several books about the intersection of digital technology and culture, to describe “activities performed in a state of distraction-free concentration that push your cognitive capabilities to their limits.” Understanding when you’re most likely to achieve deep work is essential. This is why the dashboard shows not only the breakdown of productive work (focused versus collaboration versus multitasking), but also sources of distraction and our daily average breakdown timeline. With these additional insights, we can better understand how to improve. Deep work requires practice, time, and clearly set boundaries (e.g., scheduled time on the calendar, eliminated distractions). Newport explains, “…for a novice, somewhere around an hour a day of intense concentration seems to be a limit, while for experts this number can expand to as many as four hours—but rarely more.”
3 Quick Tips for Taking Action on your Productivity Data:
- Focused Sessions take time to improve. Aim to increase your sessions a little at a time. Set a goal to increase your average session time by 50%. Use a timer tab on your computer (www.timer-tab.com/) as a reminder of your goal.
- Schedule your time based on when you’re most likely to be focused, using the data provided. Set your breaks for when you typically grow distracted.
- Learn what most often distracts you at work. Notifications from email, collaboration, and messaging tools are common sources of distraction. Silence these applications for 2-3 hours a day and see how it impacts your ability to stay on task.

Workload Balance & Wellness
Burnout is a complex topic and is often thought of as synonymous with fatigue, strain, stress, or disengagement. The truth is, each of these topics contributes to the multi-faceted ailment that is burnout. For this reason, ActivTrak aims to provide a number of leading indicators that can help us better identify when burnout may be approaching. While working hours contribute to burnout, so do other factors such as break frequency, break duration, and working evenings and weekends. When we are able to manage our break times throughout the week, we are able to manage our energy. What we learn from this section of the dashboard is that we must care about our recharge times as deeply as we care about our productive and focused time.
While we appreciate the flexible working hours of the remote model, it can be difficult to identify where work starts and ends throughout the day. Instead, we find ourselves weaving work and personal life together. Newport explains, “Even if these work dashes consume only a small amount of time, they prevent you from reaching the levels of deeper relaxation in which attention restoration can occur.” This is why one of the best ways to avoid burnout is to establish a set time to conclude your day and fully disconnect.

Technology
Many of the technologies we use on a daily basis serve their purpose in automating, organizing, and expediting our work activities. However, these technology applications are only effective when adequate training is provided, processes are in place for how to use them, and access to the user is simple. Therefore, it becomes helpful to routinely take inventory of our most common tool usage and how it varies week over week.
As I consider the ways I’ll use my Personal Insights Dashboard on a routine basis, I have a handful of goals in mind:
- Track my focused sessions duration and aim to achieve average sessions of 25 minutes.
- Track my break frequency and duration and aim to achieve two 30-minute breaks a day.
- Track my sign-off time and aim to conclude my day by 7:00pm.
Working wiser starts with visibility
Everyone’s goals will vary—and that’s the beauty of having access to data like this. We: 1) are able to identify when and where we work best throughout the day, 2) can set goals to improve our working habits on an ongoing basis, and 3) can communicate to our team members when and how we work best. While topics such as productivity, wellness, burnout, and technology enablement are initiatives empowered by entire organizations, ActivTrak’s Personal Insights Dashboard empowers individuals to unlock their own productivity potential on a daily basis so that organizations can provide the relevant and critical support where it’s most needed.
About ActivTrak and The Productivity Lab
ActivTrak helps companies unlock productivity potential. Our award-winning workforce productivity and analytics software provides expert insights that empower people, optimize processes, and maximize technology. With data sourced from more than 8,500 customers and 250,000 users, ActivTrak’s Productivity Lab is a global center for ground-breaking workforce productivity research and expertise that helps companies embrace and embody the future of work.