Table of contents
- About the data
- Key findings: Productivity standards across industries
- Financial services: Largest percentage of weekend workers
- Logistics: Largest percentage of AI users
- Insurance: Longest productive sessions
- Healthcare: Most focused time
- Location insights¹
- Definitions
- How to use these benchmarks
- Calculate your company benchmarks with ActivTrak
In a continuously evolving business environment, understanding productivity trends is crucial for organizations aiming to optimize performance. ActivTrak’s Productivity Lab has refreshed its latest benchmark report for 2025. This in-depth analysis provides an objective view of workforce behaviors across industries, helping organizations assess their current position, identify areas for improvement and reinforce positive trends.
About the data
The ActivTrak Productivity Lab benchmarks are based on aggregated data collected from January 1, 2022 to December 18, 2024. This extensive dataset encompasses:
- 774 companies
- 218,900 employees
Unless noted, all findings represent year-over-year comparisons between 2022 and 2024.
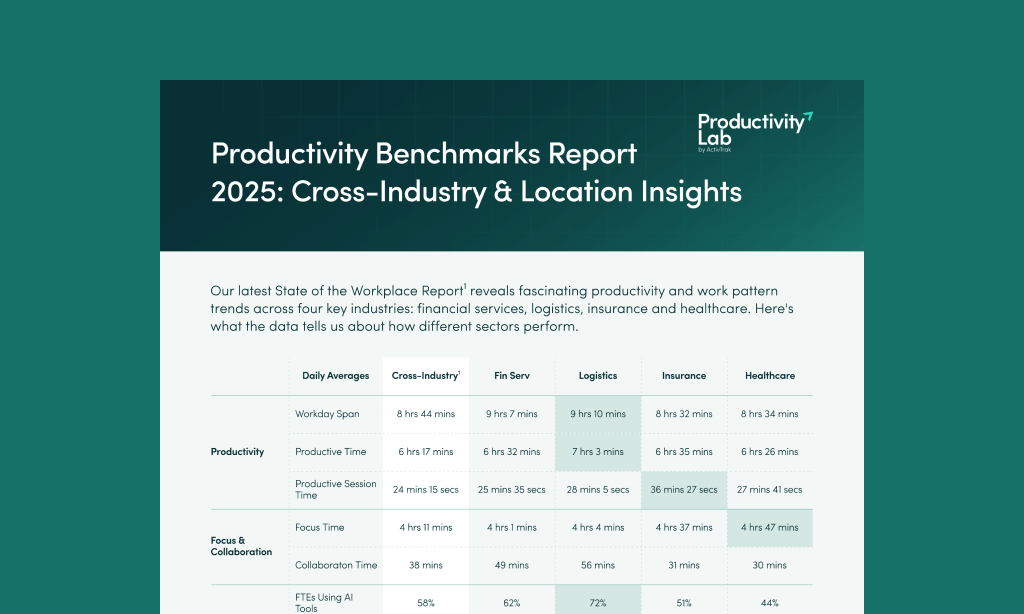
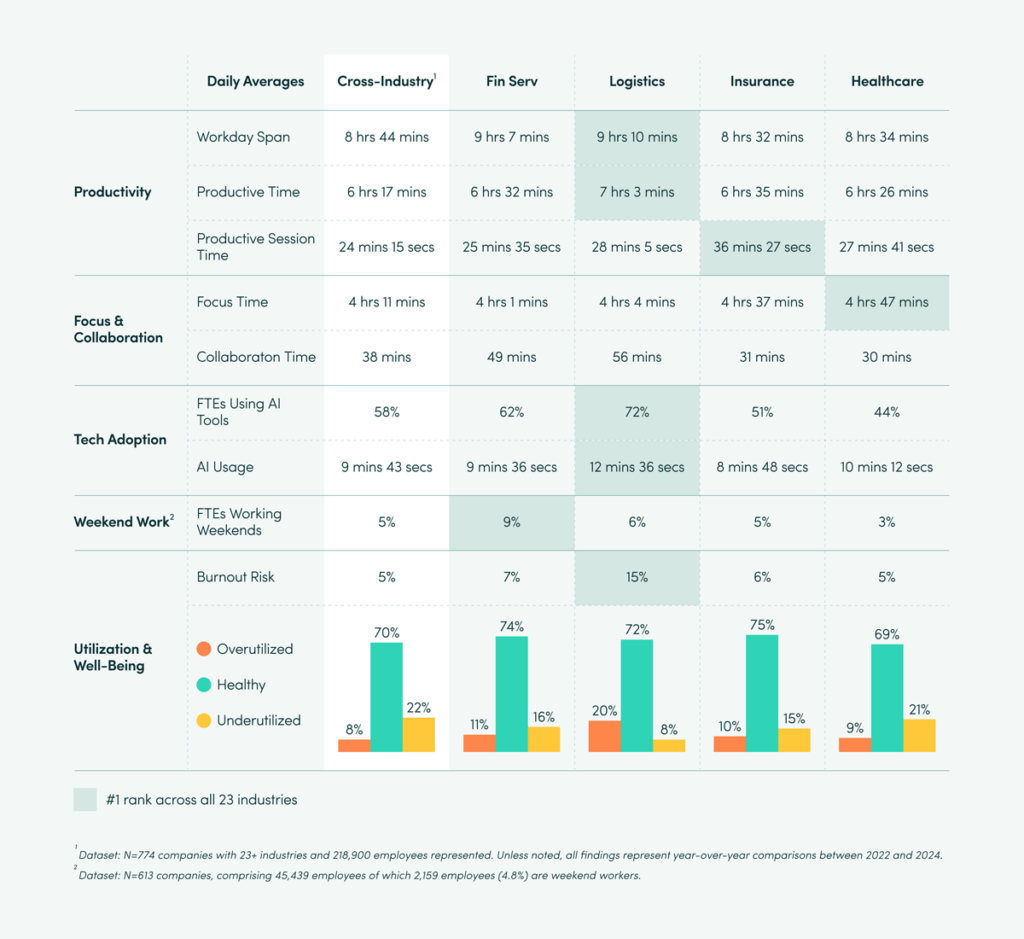
Key findings: Productivity standards across industries
Financial services: Largest percentage of weekend workers
Productivity standards
- Productive time (6 hrs 32 mins) ranks 3rd across all sectors
- Workday span (9 hrs 7 mins) is 2nd longest compared to all other sectors
Focus and collaboration
- Focus time (4 hrs 1 min) is below the overall average, signaling room for improvement
- Collaboration time (49 mins) is 11 mins longer than average, and a 35% gain
Technology adoption
- 62% of employees use AI tools, a 114% increase
- AI usage (9 mins 36 secs) is slightly below average — presenting an opportunity for broader AI integration
Weekend work¹
- 9% of employees work on weekends — nearly 2X more than average
- Employees average over 4 hrs of weekend work, whether working one or both weekend days
Utilization and well-being
- Burnout risk dropped 30% compared to 2023 but still ranks 3rd highest across all sectors at 7%
- 74% of workers maintain healthy work patterns
As the financial services industry navigates regulatory shifts, competitive disruption and rapid technological transformation, sustaining productivity while protecting employee well-being will remain critical. Organizations that preserve focused work time while embracing collaborative practices and responsibly scaling AI will be best positioned for innovation and growth.
Logistics: Largest percentage of AI users
Productivity standards
- Productive time (7 hrs 3 mins) leads all sectors, exceeding the cross-industry average by 46 mins
- Workday span (9 hrs 10 mins) ranks 1st overall, 26 mins longer than average
Focus and collaboration
- Focused session time (10 mins 42 secs) ranks last across all sectors — indicating more interruption-driven work than other industries
- Collaboration time (56 mins) ranks 2nd among all sectors, as does productive session time (28 mins 5 secs)
Technology adoption
- 72% of workers use AI tools, the largest percentage across all industries and 14% more than average
- AI usage (12 mins 36 secs) increased 250% and ranks 1st among all sectors
Weekend work¹
- 6% of employees work weekends
Utilization and well-being
- Burnout risk (15%) ranks 1st among all sectors — 10% higher than average — indicating a need to reallocate workloads
- 72% of employees maintain healthy work patterns (slightly more than average) while 20% of employees are overutilized (ranks 1st across all industries and 12% higher than average)
As the logistics sector navigates ongoing labor shortages, supply chain complexity and accelerating technology transformation, balancing efficiency with sustainability will be key. Organizations that actively reduce burnout risk while sustaining productivity gains will strengthen retention, resilience and long-term performance. In logistics, balancing output with employee well-being is emerging as a critical measure of effective workplace optimization success.
Insurance: Longest productive sessions
Productivity standards
- Productive time (6 hrs 35 mins) ranks 2nd across all sectors
- Productive session time (36 mins 27 secs) leads all sectors (12 mins longer) and increased 64% — the largest improvement across all industries
Focus and collaboration
- Focus time (4 hrs 37 mins) ranks 3rd among all industries
Technology adoption
- 51% of workers use AI tools, an increase of 132%
Weekend work¹
- 5% of employees work weekends
Utilization and well-being
- Burnout risk (6%) dropped 31% compared to 2023
- 75% of employees maintain healthy work patterns, the 3rd highest across all sectors
As the insurance industry navigates regulatory shifts, competitive disruption and talent shortages, balancing productivity with well-being will be key to long-term success. Organizations that preserve focus while strategically adopting new technologies and flexible work models will be best positioned to drive both business growth and employee satisfaction.
Healthcare: Most focused time
Productivity standards
- Productive time (6 hrs 26 mins) is 9 mins longer than average
- Productive session time (27 mins 41 secs) ranks 3rd among sectors, reflecting the 2nd largest improvement (38% increase) across all industries
Focus and collaboration
- Focus time (4 hrs 47 mins) and focus session time (17 mins 48 secs) each rank 1st across all sectors — 36 mins and 4 mins longer than average, respectively
- Collaboration time (30 mins) represents a 52% increase (3rd largest jump across all industries) while still falling 8 mins below average
Technology adoption
- 44% of employees use AI tools, ranked last among all sectors, but reflecting a 193% increase — the largest gain across all industries
Weekend work¹
- 3% of employees work weekends — 2% below average
Utilization and well-being
- Burnout risk (5%) dropped 27% from 2023
- 69% of employees maintain healthy work patterns, up 13% from 2023
As healthcare balances human touch with technological advancement, optimizing productivity patterns will be key to delivering exceptional patient care while maintaining sustainable work practices. Organizations that preserve focus while integrating AI and enhancing collaboration will be best positioned to improve clinical outcomes and employee satisfaction.
Location insights¹
As part of this study, the Productivity Lab also wanted to understand how employee work habits vary by location, and how return-to-office initiatives impact those habits. Our research subset included 147 companies representing 41,924 employees.
After examining five unique work location types — remote-only, remote-first, hybrid, office-first and office-only — several productivity patterns emerged, including that the majority of employees (53%) spend more than 60% of the year working in a remote environment.
One of the most notable findings centers on remote-only workers, who have the highest daily productivity (+29 mins) vs. other worker types.
While all location types have similar percentages of healthy employees, remote-first companies have the highest percentage of overutilized employees (1.5X more vs. other location types). In contrast, office-first companies have a greater percentage of underutilized employees (+4% or more).
Interesting paradoxes also emerge. Hybrid workers have the longest workdays (+1 hr vs. single-location workers) yet show lower productive time (-8 mins or more) and focused time (-12 mins). In contrast, remote-only workers excel in total productive time and session length, while office-only workers have higher focus efficiency and healthier work patterns.
Worker productivity standards: Office vs. remote vs. hybrid
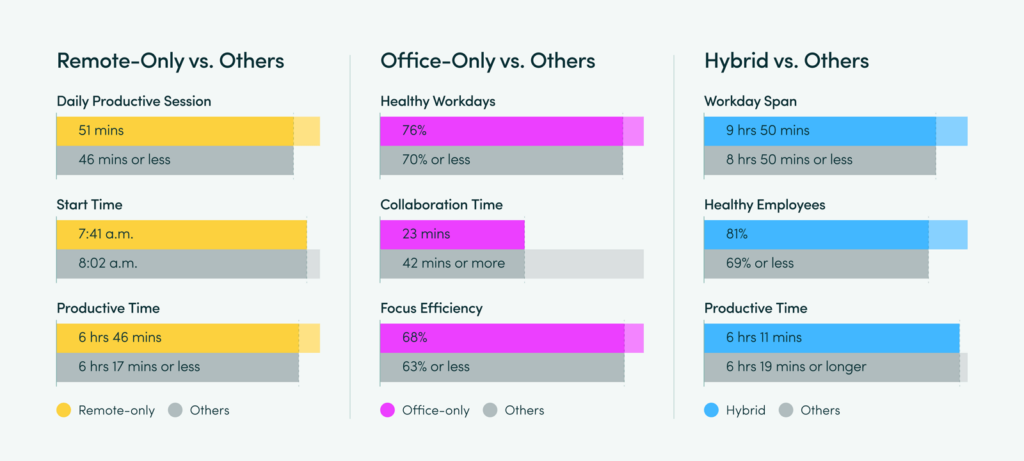
These findings offer valuable insights for companies as they navigate the complexities of modern work arrangements. While remote work offers greater productivity (6 hours and 47 minutes per day), it also comes with the risk of overutilization. On the other hand, office-centric models seem to promote a more balanced work experience. As organizations continue to refine their work location strategies, understanding these nuances will be key to fostering productive, engaged and well-balanced teams.
Definitions
- Productive time: Time spent engaging with productive apps and sites that includes focused, collaboration and multitasking activities per person, per day.
- Productive session time: The average time employees work without unproductive disruption.
- Focus time: Work time when an employee is engaged in a single task without interruptions, attention shifts or collaborative activities.
- Burnout risk: Employees who spend more than 75% of their time overutilized annually.
- Overutilization: Employees exceeding their daily productive hours goal by more than 30% (thresholds set by their employer).
- Healthy utilization: Employees within +/-% of their daily productive hours (thresholds set by their employer).
- Underutilization: Employees falling short of their daily productive hours goal by more than 30% (thresholds set by their employer).
- Remote-only: All employees within an organization spend 100% of their work days in remote locations.
- Remote-first: Employees collectively spend more than 60% of their work days in remote locations, indicating a primarily remote work model.
- Hybrid: Across the workforce, office and remote workdays are relatively balanced, with neither accounting for more than 60% of total working hours.
- Office-first: When employees collectively spend more than 60% of their work days in an office location, indicating a primarily office-based work model.
- Office-only: When all employees within an organization spend 100% of their work days in an office location.
How to use these benchmarks
These benchmarks provide valuable, moment-in-time reference points for organizations across various sectors. Here’s how to leverage this data:
- Assess current performance: Compare team metrics against industry peers and cross-industry benchmarks to identify areas of strength and opportunity.
- Set realistic goals: Use benchmarks to establish achievable productivity targets that align with industry standards.
- Learn from high performers: Explore practices of top industries and high performers to identify strategies for your organization.
- Monitor employee well-being: Track utilization rates to ensure high performance is sustainable and doesn’t lead to burnout.
Calculate your company benchmarks with ActivTrak
Ultimately, these comprehensive insights serve as a vital resource for organizations seeking to navigate the complexities of today’s work landscape. By understanding industry-specific nuances and location-based work patterns, businesses can make informed decisions to optimize productivity, foster healthy work environments, and strategically integrate new technologies.
To discover how your company’s performance stacks up against these benchmarks and to unlock tailored insights for your organization, contact ActivTrak today for a personalized demo.
Download the 2025 Productivity Benchmarks Report: Cross-Industry & Location Insights.
¹ Dataset: N=147 companies, comprising 41,924 employees
This article was originally published on Jun 25, 2025, then updated on Feb 10, 2026