This is part two in a three part series on Workforce Analytics and the new approaches organizations can take to drive employee productivity in the evolving workplace. In Part I, we introduced What is Workforce Analytics and how does it help measure employee productivity with user activity data. We also offered potential use cases for the data insights to demonstrate how to better understand employee productivity.
In Part II, we will dive deeper into the productivity insights Workforce Analytics software can provide and suggest a framework that organizations can use to get insight into specific productivity areas including work alignment, focus levels, and employee engagement.
The approach we use for workforce analytics at ActivTrak is to collect user activity data with context providing insights to truly understand and analyze “how” employees work. We also suggest to organizations that they ask the question: “How will my employees benefit from this effort?” This is a good starting point for successful utilization of workforce analytics. An initial step to this more modern approach is to create a framework of key questions companies seek answers to in order to uncover what employee productivity looks like for their specific organization. At ActivTrak, we find it helpful to divide these questions into 6 key workforce productivity subject areas.
As we mentioned, in this part II series, we will address the first three (engagement, alignment, and focus) leaving the remaining three for the next part of the series. Engagement, alignment, and focus can have some similarities or overlap, but we’ll show how these areas might be revealed in the data insights and how to identify them. So, let’s dive in.
Understand Employee Engagement Levels
It’s not always obvious to see if workers are engaged just by looking at the projects they complete, the deals they close, the number of calls they make, etc. This is their job and the output expected to do their job, not necessarily a reflection of their level of interest or engagement. Even in conversations with their managers, employees may “play the part” for a variety of reasons so the signs may not be obvious. Human behavior is not so easy to predict, even if you have access to loads of people data. However, workforce analytics and productivity trend tracking can help identify potential problem areas and reduce attrition risk.
- Find habits such as excessive social media use which may indicate burnout or flight risk.
- Uncover spikes in workload to identify potentially overworked employees.
- Leverage team productivity reports to learn trends and find the right workload balance for each team member.
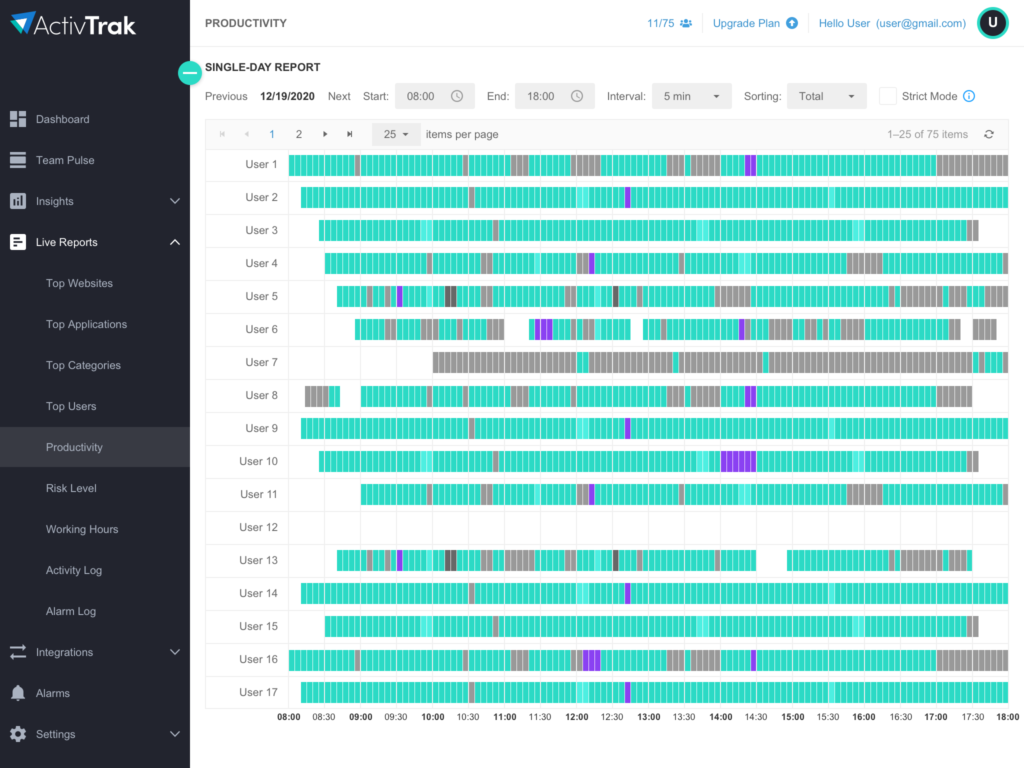
Leveraging useful analytic reports such as a weekly User Activity Dashboard, lets managers and individuals track key activity, productivity, and engagement statistics. Individuals can compare their activity against the recent past and vs. a team average to learn patterns and identify improvement areas. Managers can review a Break Time report to analyze trends of user activity related to Social Media, News, Entertainment and Gaming usage. Managers can also ensure there is a healthy balance between work time and break/rest time patterns across team members.
Uncover Misaligned Skillsets or Roles
Identifying potential areas of misalignment can be difficult–they are often ignored or just unknown. It’s rather uncommon for an employee to say “Hey, I’m struggling, and don’t think I’m suited to this role.” Often, the signs appear more in the form of slower performance, missed deadlines, less participation in meetings, etc. which appear as though the employee isn’t “cutting it.” On the other hand, there may be a variety of other factors. Perhaps there was a change in expectations, work levels increased with no additional resources, a new manager came aboard and the role changed from what it was previously. These are all organizational changes, some subtle, that are not necessarily documented, but happen all the time. Employees then start to struggle to do the job, and it’s unclear how to help them. This is another area where workforce analytics and user behavior analysis can help provide some insights.
- Learn workflow behaviors to identify potentially misaligned skill sets.
- Track application and website activity to uncover if employees have the right tools for their roles.
- Identify patterns where employees spend too much time searching for information they need.
Viewing dashboard reports such as App/Site Usage can help you to understand each application/site usage patterns and compare trends by the team overall and by individuals. Utilizing a Knowledge Management chart lets you analyze your team members’ search activity, common terms, and trends. Drill into a particular user or search site to identify routine mismatches or indications of excessive time looking for needed information.
Discover Workforce Focus and Distraction Patterns
Focus and distractions are a routine juggling act in the workplace. We could argue that opportunities to find time for deep, focus work are limited, but it’s still needed for certain tasks or projects. Distractions are many and come in all forms which we don’t need to hash out here. You know them, you know when they occur and it can be challenging to manage the number of times they happen. Sometimes distractions are welcome, and other times not so much. What you may not know as an individual employee or as a manager is how much actual focus time happens during a given week and whether that translates into productivity. You may also not keep track of all the times you are distracted and how often that might be impeding work and/or driving more unproductive work patterns. This is how workforce analytics can help provide some clarity and insight into those trends.
- Measure focus scores and benchmarks of team productivity.
- Uncover distractions and view comparisons across teams.
- Identify apps and sites which may drive excessive multitasking.
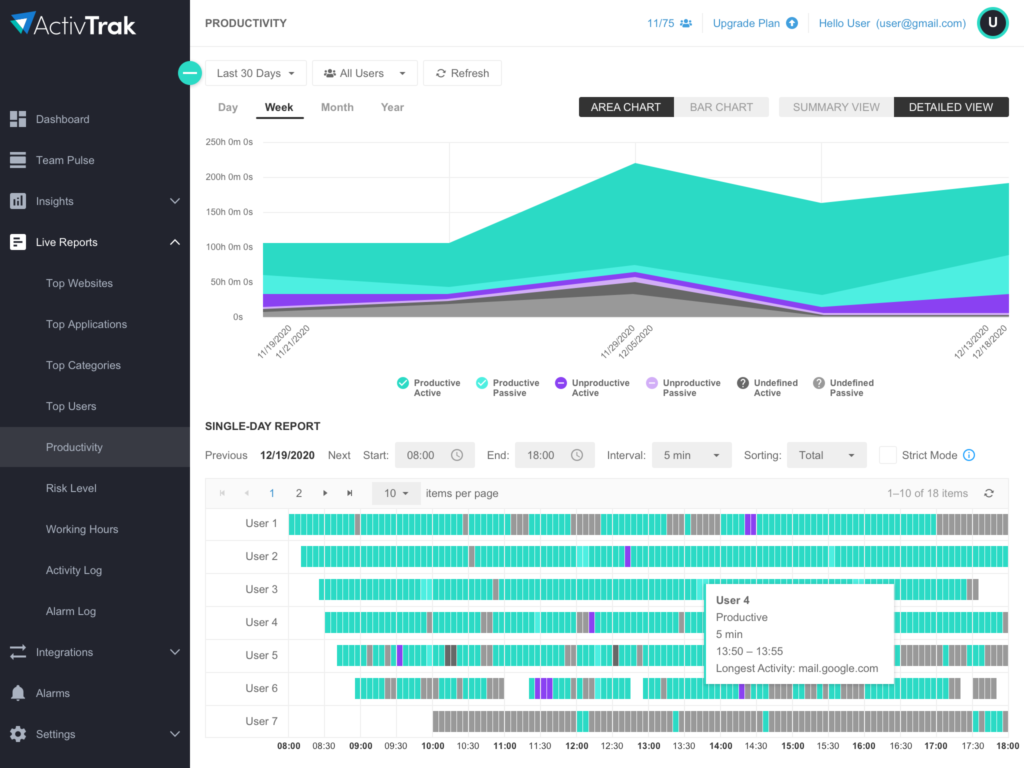
Analyzing dashboards such as Productivity Trends lets you learn productivity and focus metrics for different users and benchmark them vs. their peers and the team average. A Multitasking Distractions dashboard helps identify apps and sites that are routinely sources of context switching or distractions for different team members. Understanding these patterns of lack of balance between focus time and distractions helps managers coach employees and helps employees develop strategies to maximize focus time habits.
Utilizing Workforce Analytics can help provide a framework for proper insight into key workforce productivity areas including work alignment, focus levels, and employee engagement. Using ActivTrak workforce analytics software can give you a whole new level of productivity data insights that can benefit both employees and employers alike.
Get free visibility with ActivTrak!
Start using workforce analytics to create a more productive and operationally compliant remote workforce today by creating a FREE ActivTrak account (no credit card required).
Take Your Data Further with ActivConnect
Already an ActivTrak customer? Easily integrate your ActivTrak data with your software stack for deeper analytics into how work gets done. Learn more.
About ActivTrak
ActivTrak is a workforce productivity and analytics software company that helps teams understand how people work, whether in-office or remote. Our cloud-based user activity monitoring platform collects and analyzes data and provides insights to help organizations be more productive and compliant. With more than 8,000 customers and over 250,000 users of its free version, ActivTrak’s award-winning solution can be configured in minutes to identify operational bottlenecks, flag operational compliance risks, and provide valuable insights that help employees and employers improve productivity outcomes.