In the first part of our workforce analytics series, we’ll reveal how workforce analytics has broadened and evolved to give you the power to die deeply into employee productivity analysis.
Part 1 of 3: Understanding Employee Productivity
This is part one in a three-part series on Workforce Analytics and the new approaches organizations can take to drive employee productivity in the evolving workplace. In this Part I article, we will dive into Workforce Analytics in terms of measuring employee productivity with user activity data. We will redefine Workforce Analytics and reveal how usage of the analytic data has broadened beyond its historic uses. We will also offer potential use cases for the data insights to demonstrate how to better understand and analyze employee productivity. In Parts II and III of the series, we will dive deeper into the levels of productivity insights Workforce Analytics software can provide and suggest a framework that organizations can use to get insight into areas related to productivity including work alignment, work focus levels and employee engagement.
What is Workforce Analytics?
First, let’s clarify what we mean by Workforce Analytics which is traditionally focused in the Human Resources area. One definition of People Analytics or oftentimes, Workforce Analytics, is “the approach of measuring demographic and talent management data of employees. Then analyzing the data using statistical methods and software in order to make better workforce decisions.” Additionally, data is collected to identify engagement which is usually survey-based. These surveys, however, lack the ability to answer questions about employee productivity and let you deeply engage with employee productivity analysis. Why not collect data unbiased directly from the source: the users as they are doing their work? At ActivTrak, we like to think of it as a new age of Workforce Analytics, taking actual user activity behavior and analyzing it. We’ll look at how to do this starting with the lens of productivity analysis.
How is Workforce Analytics Changing?
Data collected to measure Workforce Analytics continues to mature yet needs to evolve even further due to various shifts in workplace dynamics. For example, the emergence of digital technologies such as cloud-computing, machine learning and AI introduces new work behaviors like never before. These advances are forcing Workforce Analytics to expand out of its predominantly HR-focused silo to help other areas of the organization. Operations and business managers can understand how to improve performance as well. These functions are often looking for ways to streamline and improve processes and employee workflows to help propel the business forward more effectively and efficiently.
In addition to optimizing business operations, there is the ever-present element of an organization’s people. This is a unique time where employee engagement and retention have become more important to organizations than years past. The workplace has become far more distributed with remote workers across the world working together and collaborating on projects. It’s now critical to ensure they are connected and engaged. This has made the way employees work together different which can introduce new challenges. Employees in all kinds of roles are pushed to embrace new technologies and processes as well as adapt to new approaches of working collaboratively across geographies. These dynamics have transitioned the focus from “are you working” to “how are you working” and is that translating to positive productivity for the employee and the organization?
How Do I Use Workforce Analytics to Understand Productivity?
Tracking and analyzing employee productivity has its challenges and limitations; nonetheless, it is increasingly important for organizations to strive to optimize it in order to drive engagement, retention and better business outcomes. It’s now a competitive advantage for organizations to focus and spend effort on analyzing their employee productivity to identify gaps and opportunities to improve. At ActivTrak, we suggest three ways organizations can start to embrace the new Workforce Analytics to track and analyze employee productivity — the “how are you working”.
Benchmark top performers’ activities and create baselines.
Collect analytics on application usage and collaboration tools.
Analyze workforce productivity trends across teams and roles.
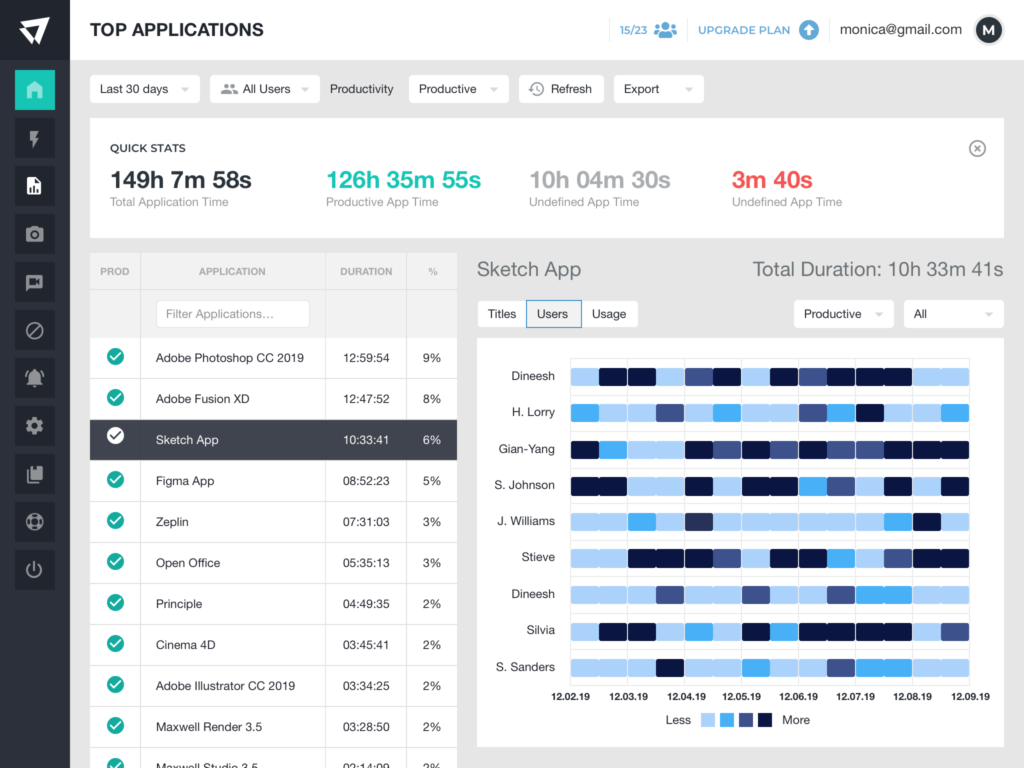
Using modern Workforce Analytics software, like ActivTrak, organizations can identify work patterns of top performers and teams, and the conditions that enable top performance. Managers can use this data to coach employees on top productive activities and train those who are not performing as high to mirror some of these high performance’ techniques. This requires not just data and analysis thereof but also uncovering workflows and pathing of user activities to understand how work gets done. ActivTrak provides employee productivity tracking and reporting to uncover top productive behaviors such as applications used, time spent in those applications and trends by day, week or month. Leveraging screenshots and video playback capabilities, managers can discover optimal work patterns and benchmark those across different roles &/or teams.
Collecting Analytics on Productivity Tools & Usage
Another area to understand workplace productivity is collecting analytics on application usage and collaboration tools. There is a plethora of applications and work tools employees use to do their jobs and collaborate across teams. With the proliferation in cloud applications, having visibility into what employees use is important not only to evaluate costs and compliance, but also to gauge productivity. Typically, organizations use asset management software as a means to manage application usage. However, the software only indicates which applications employees use, if these applications are on the authorized list and what those licenses cost. Asset management software does not show how employees use the tools and if that facilitates productive work.
ActivTrak can help bridge the gap through providing insight and context into which applications and web tools employees use, the frequency of the usage and whether this translates to productive time spent. Through leveraging a workforce productivity dashboard and reports, managers can identify frequently used unproductive applications &/or websites and set usage limits. They can also evaluate data to find the optimal workload balance for each team member based on the productivity metrics. This fosters balance for employees, monitors burnout, enhances engagement and as a result, helps ensure retention.
Analyzing Workforce Productivity Trends Over Time
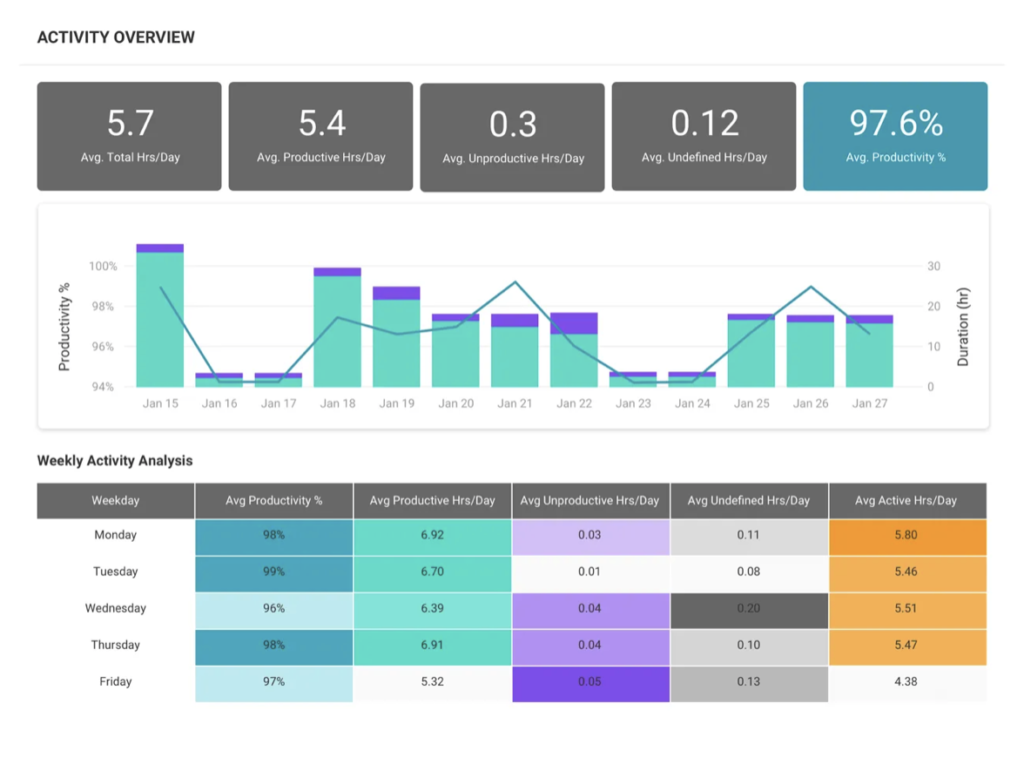
A third way to analyze employee productivity is to track and analyze productivity trends over time across teams and roles in order to understand organization-wide behavior. Through doing this, leadership teams can devise management approaches that are likely to reinforce productivity behaviors. In order to analyze workforce productivity, you need to identify what classifies productive work and unproductive work. You also need to go a step beyond classification to categorize activities and report on the productivity activities and how those change over time frames. This level of analytics is critical to not only understand what activities are productive for your teams, but also to discover if these activities trend in the upward direction over weeks, months and longer.
ActivTrak lets you analyze employee productive activities with personalized reporting for deeper detail. ActivTrak’s ActivConnect feature lets you integrate user activity data with BI data visualization tools such as Tableau, PowerBI and others to personalize reporting even further and analyze longer-term trends. Using ActivConnect’s pre-built Tableau dashboards, you can compare data points to understand analytics such as: are employees working on activities aligned with their role? Are they allocating the right percentage of time to each activity? This depth of insight is a pivotal step to further productivity analysis over longer time periods.
The time for more evolved Workforce Analytics software, which can better meet the growing demands of organizations, is here. Understanding how to use behavioral activity data to measure and understand employee productivity is becoming more critical. Using modern Workforce Analytics software like ActivTrak lets you gather employee productivity analysis, so you better understand how your employees work and how to drive better employee engagement.