Employees are one of your organization’s greatest resources, and understanding your hiring, training and retention processes is the best way to safeguard that resource. Human resources (HR) analytics helps you better understand your current HR processes and how to improve them. With the right analytical tools, your organization will see an impact on overall business performance and make data-informed decisions on workforce planning and employee programs. In this post, we explore the concept of HR analytics, its importance, key metrics to measure, how to use it and best practices.
What is HR analytics?
HR analytics is the systematic gathering and analysis of HR-related data to identify patterns, trends and correlations across your HR infrastructure, including how it affects your overall business. This data-driven approach allows organizations to unlock valuable insights about their workforce, such as employee performance, engagement levels, training needs and potential employee turnover risks.
HR analytics is a relatively new tool for human resource management. It enables HR managers and leadership to make more strategic decisions around headcount, right-sizing office space, talent development, tools and technology based on previous successes and failures. When done properly, analytics enables organizations to understand and plan for their workforce, from hiring to development and retention.
The importance of HR analytics
Using the right HR analytics metrics, leaders can make decisions based on data around developing and promoting employees as well as hiring and firing while maintaining employee satisfaction and engagement levels. Beyond simple reports on metrics for HR professionals, the power of HR analytics lies in uncovering hidden connections and translating data into actionable strategies that drive your organization’s success. Access to the right data allows your HR team to identify training needs and development opportunities so managers can design targeted programs that enhance employee skills and productivity.
If you don’t have analytical information on your human resources infrastructure, your organization is at risk of not only harming your hiring and retention processes but of losing money, too. Finding and training new employees and developing existing employees are large investments on their own, but HR decisions impact customer satisfaction and employee productivity as well, which affects your bottom line. Predictive HR analytics empowers your leaders to predict and manage employee turnover and performance by looking at historical trends, identifying factors that contribute to losses and developing proactive retention strategies.
Key HR analytics metrics to measure
1. Involuntary and voluntary turnover rate
Understanding how many of your employees leave the company whether on their own (voluntary turnover) or through firing or layoffs (involuntary turnover) provides key insight into how well your company’s retention policies are working as well as how well your hiring and management policies do. To calculate this percentage, add up the number of employees who have left for either reason and divide by the total number of employees you have.
2. Retention rate
On the flip side of turnover rates, the retention rate shows you how many employees choose to stay at the business and is calculated by dividing those employees by the total number of employees. The retention rate indicates how well your company is managing to keep employees working for you and empowers HR managers to investigate employee engagement programs, pay and benefits packages, training and development programs and other factors that contribute to employee retention.
3. Time to fill vacant positions
This metric measures how long it takes your organization to fill open positions. Simply put, it’s the number of days it takes from when you post the job until you hire an employee and they accept the offer. Understanding time to fill shows your HR team how effective hiring processes are, including finding good candidates and moving them through the interview and hiring process. This provides insight into bottlenecks, such as how available hiring managers are for interviews or if third-party verification systems are taking too much time.
4. Training and development effectiveness
To understand the effectiveness of your training and development programs, your team must measure several metrics:
- How long it takes new hires to become proficient in their tasks
- How often and well employees improve after interventional training
- How successful employees are after promotions
Measuring your training and development effectiveness gives your leadership team insight into how well training programs are working as well as the quality of your workforce, from new hires to upper management. It’s more of a qualitative than quantitative measure, so it’s up to HR managers to get a sense of this by talking to employees and other leaders.
5. Employee engagement levels
Employee engagement is a measure of how enthusiastic and invested your employees are in your organization and their work. It’s a key factor in business success, but many companies find it difficult to nail down real numbers on engagement, particularly if they rely on self-reported employee surveys or manager’s performance reviews. Employee productivity monitoring software like ActivTrak provides deeper insight into employee engagement metrics such as personal productivity, workload balance and benchmarks so your team can make actionable and realistic plans for improvement.
6. Revenue per employee
This metric is an indicator of how much money each employee brings to the business, which provides insight into the quality of your recruiting and hiring processes. If revenue per employee is low while hiring costs are high, it indicates you’re spending a lot of money on employees who don’t yield a strong return. Some businesses may be accepting of this if they feel the employees will stay for a long time and develop into strong performers, but other companies may see it as a sign that they need to revamp the hiring process. To calculate revenue per employee, divide your total revenue by the number of employees you have on payroll.
7. Offer acceptance rate
Knowing how often candidates accept job offers from your organization gives you insight into how effective your hiring team is at finding the right people for your open roles. A low offer acceptance rate clues you in that recruiters need to develop new systems for gauging candidates’ interest in joining your company. This metric dovetails with how competitive your offers are in the job marketplace, which empowers your hiring team to evaluate compensation, benefits and company reputation among job seekers. To calculate offer acceptance rate, divide accepted offers by total number of offers your company has made.
8. Absence rate
The absence rate, or absenteeism, is calculated by dividing days worked by total available working days. Absenteeism refers to unplanned days off, such as sick days, and does not include company holidays or scheduled vacation time. High absenteeism is a red flag that employees are not engaged, not satisfied or overworked, which all lead to burnout. By calculating absence rate for each individual employee, managers can take steps to intervene. Understanding your company’s overall absence rate also gives insight into how the organization is affected by issues like poor morale or low engagement.
How to use HR analytics to improve your business
After choosing the key metrics for your organization, the next step is finding the right HR analytics tools. It’s easy to collect data on basic numbers such as employee headcount, time to hire and revenue using existing systems like payroll, recruiting and revenue reports. But to develop a long-term plan and make data-driven decisions, your organization will need to explore different levels of HR analytics.
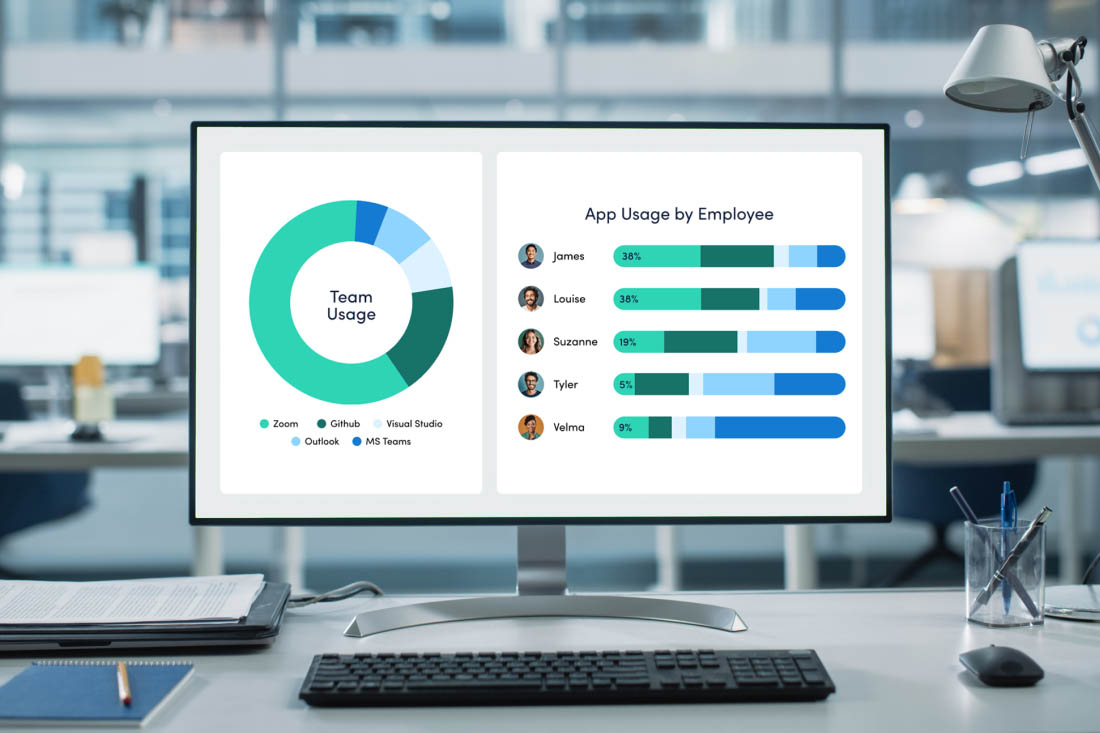
Deeper workforce insights are necessary to identify top performers and employees who need more training, as well as indicators of employees who are at risk of burnout or unbalanced workloads. Intuitive dashboards and visualization tools empower employees and managers to see what habits contribute to higher productivity and performance and how productivity patterns show where workloads need to be rebalanced.
Real-time HR data gives your HR and management teams to power to make decisions on skills development and training and engagement policies. See how work-from-home or remote work policies affect productivity and set policies based on real data. At the same time, HR analytics over time gives your team benchmarks and goals to work toward as well as an audit trail for implementing new technologies, tools and policies.
HR analytics best practices
Every organization will have its own needs for HR analytics and its own strategy for implementation. You’ll have to take into account budgets, employee availability and time resources alongside your needs. To find the right balance between collecting and using data and overloading your HR department with too much work or information, follow these six best practices:
- Include leadership from the start. Getting buy-in from upper management and the C-suite allows you to effectively implement HR analytics programs from the top-down. When leaders know and understand how and why HR analytics contributes to the organization’s overall success, they’ll champion it in their strategy, too.
- Listen to employee feedback. While gathering HR data provides insight into performance and productivity, it’s still important to check in with the people who contribute to that data to get the full story. Give employees, HR managers and leaders the opportunity to provide feedback and integrate it into your HR infrastructure.
- Make HR data an integral part of your organizational policy. Don’t just collect metrics on your HR infrastructure – empower your managers and team leaders to use the data to make decisions. Include HR analytics in every aspect of hiring, performance management and training so managers can put the data to work for them.
- Ask the right questions. Start asking data-driven questions so managers will start using the data to answer. This means managers will familiarize themselves with the data, how it’s collected and what it means, which will make them more involved in the HR system for their benefit.
- Use the right tools for your organization. Using the wrong tools will increase frustration and reduce the likelihood your team will use the data to their advantage. You’ll also waste money on software or processes you don’t need. Find the right mix of tools for your exact HR analytics questions and needs.
- Create data-based action plans. Include HR analytics in organizational policy-setting and business planning. Maximize your investment by using HR data for your workforce plan to improve systems now and in the future.
Transform your business with ActivTrak’s workforce analytics solution
Leverage ActivTrak to gain actionable insights into your HR processes and empower managers to make data-based decisions. Boost employee productivity, engagement and retention with real data on how, when and where employees perform best. Create organizational change through workforce planning, goal-setting and performance programs based on data rather than guesswork and opinions. Use ActivTrak’s integrations to harness data from existing systems such as payroll, recruiting and customer service for a holistic view of how your HR processes affect every aspect of your organization.
Schedule a demo to learn more about ActivTrak’s powerful HR analytics tools.


