API & INTEGRATIONS
Enhance Workforce Insights With
Seamless Integrations
Connect ActivTrak with the tools you rely on to inform smarter decisions,
automate workflows and unlock deeper insights.
Customize Analysis with ActivConnect API
Unify data with ActivConnect API
Integrate ActivTrak data with business systems and BI tools. Accelerate insights with pre-built BI templates.
Learn moreIntegrate Calendar & PTO Data
Native integration available to all customers
Use native integrations with Microsoft Outlook and Google Calendar to capture calendar and PTO data for offline activity tracking.
Learn moreStreamline User Management
Native integration available to all customers
Use native integrations with Microsoft Entra ID and SCIM to automate provisioning, role-based access control, bulk user updates and more.
Learn more“We connect ActivTrak data to our outside financial data (timesheet data) to create reports for what time and money is actually spent on projects.”
— Mid-Market Company (51-1000 employees)
ACTIVCONNECT API
Unlock Deeper Insights with ActivConnect
Seamlessly integrate ActivTrak data with business systems and BI tools for real-time insights. The ActivConnect add-on enables custom reporting and data-driven decisions to optimize workforce productivity and performance.
- Get seamless data access — easily integrate live and historical ActivTrak data with business systems and BI tools via API or SQL
- Gain real-time workforce insights — build customizable dashboards and perform in-depth performance analysis
- Accelerate reporting & analysis — use pre-built BI templates to quickly create tailored reports and visualizations
Pre-Built BI Templates for Faster, Customized Insights
Unlock workforce insights instantly with pre-built BI templates for Power BI, Looker Studio, and Tableau. Seamlessly integrate ActivTrak data with existing business tools to analyze performance trends and gain actionable insights — all without starting from scratch.
-

Customizable ActivTrak Reports
Customize our core, out-of-the-box reports to meet your business needs.Ideal for: Operations leaders & analysts looking to tailor workforce insights to unique organizational goals.
Request demo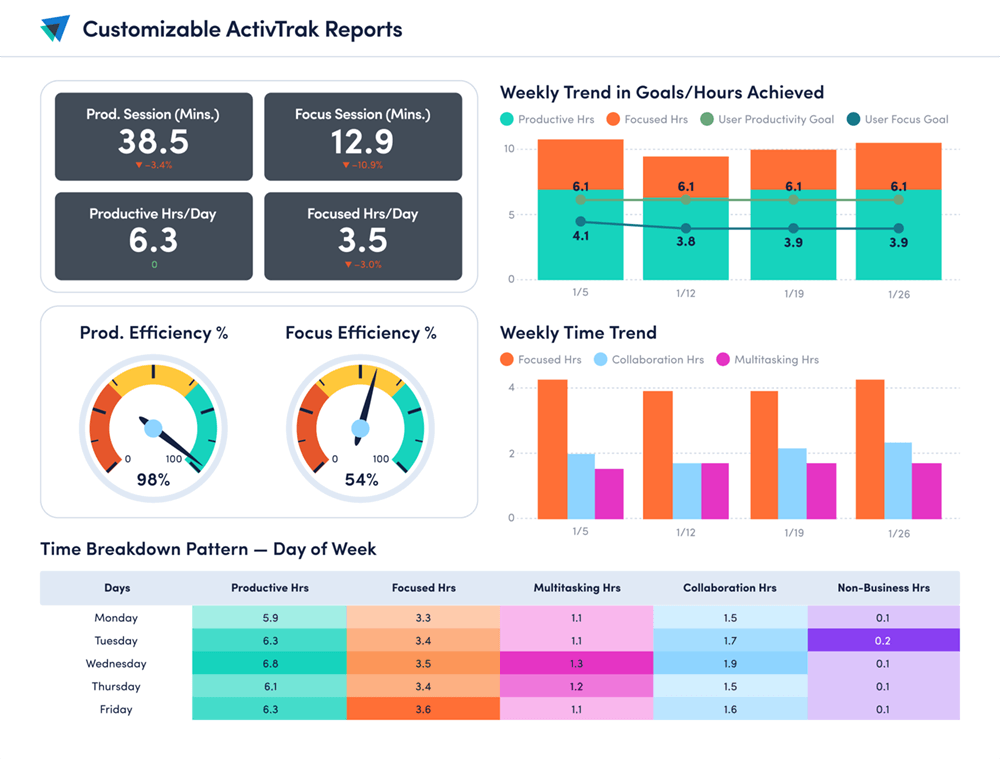
-

Schedule Adherence
Get real-time insights into schedule, shift and attendance compliance and trends.Ideal for: Managers & team supervisors tracking schedules.
Request demo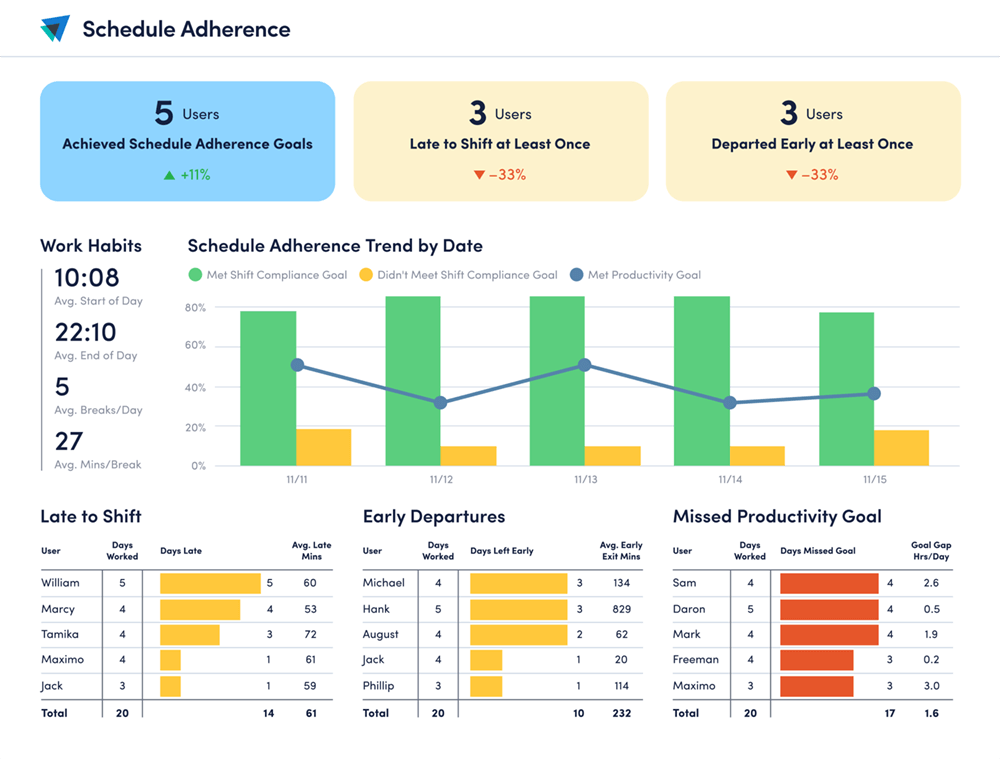
-

Potential False Activity
Identify and investigate suspicious activity patterns that may indicate work-mimicking technology (e.g., mouse jigglers).Ideal for: IT, security & compliance teams seeking to detect suspicious or non-productive digital behavior.
Request demo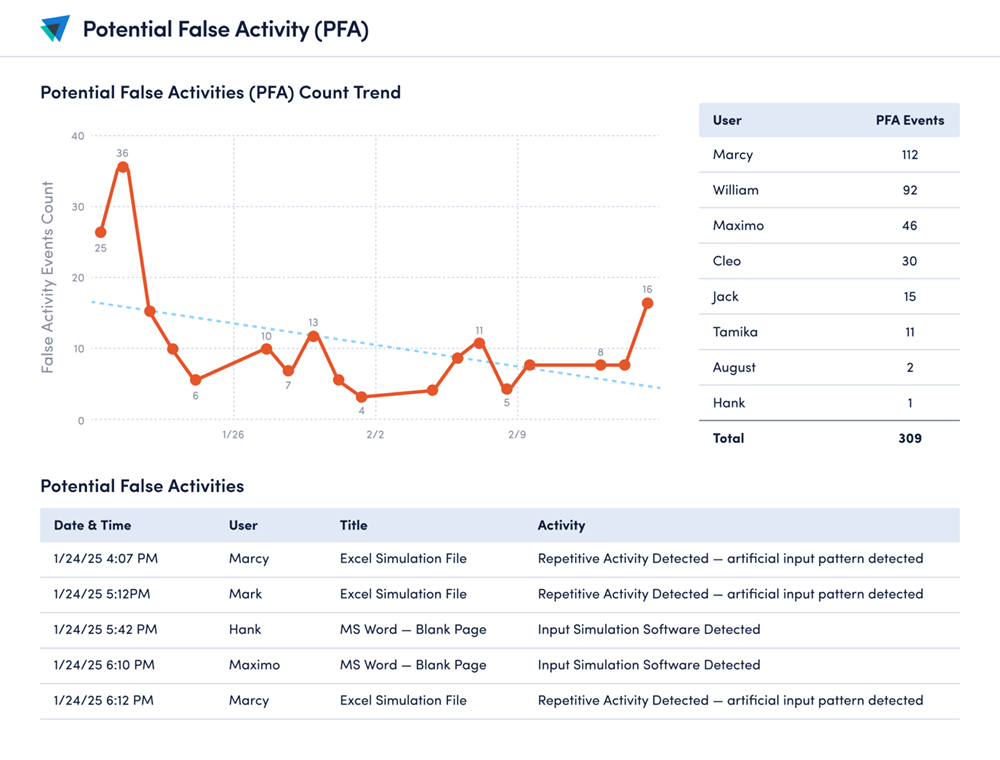
-

Headcount Planning
Analyze workforce capacity and utilization gaps to easily identify and prioritize cost savings and optimization opportunities.Ideal for: HR & Finance teams looking to align staffing levels with business needs.
Request demo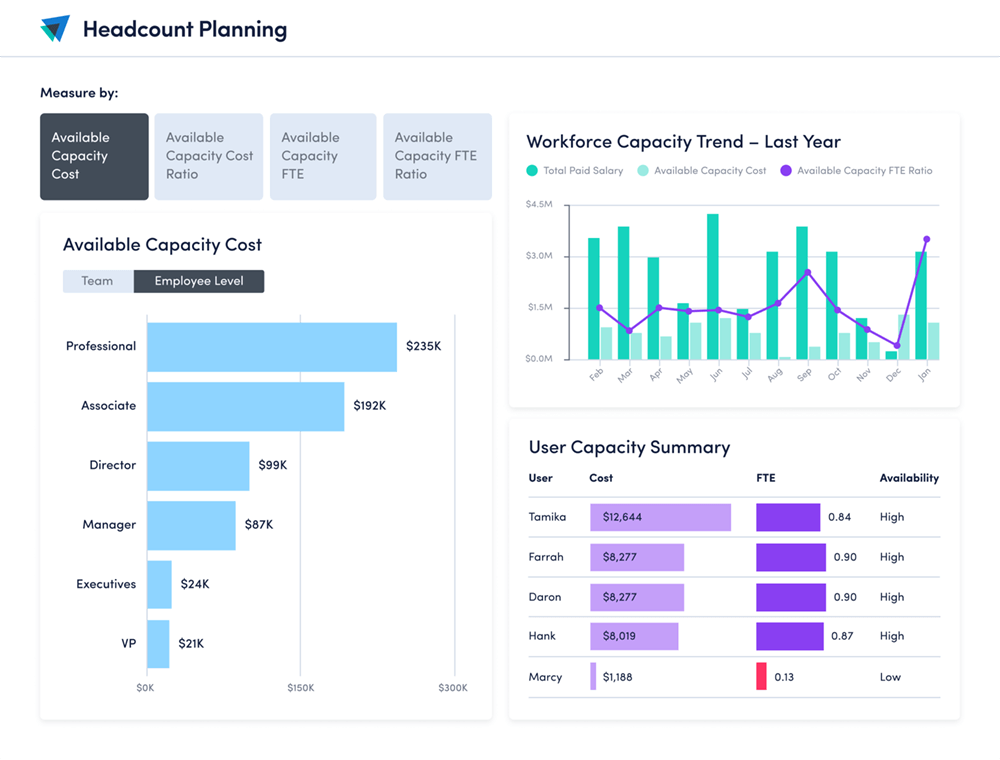
-

Customer Service Productivity
View ActivTrak data alongside CSAT, case resolution and response time data from CS platforms such as Service Now, ZenDesk and Salesforce to identify productivity trends that drive results.Ideal for: Customer support leaders focused on balancing agent productivity with service quality.
Request demo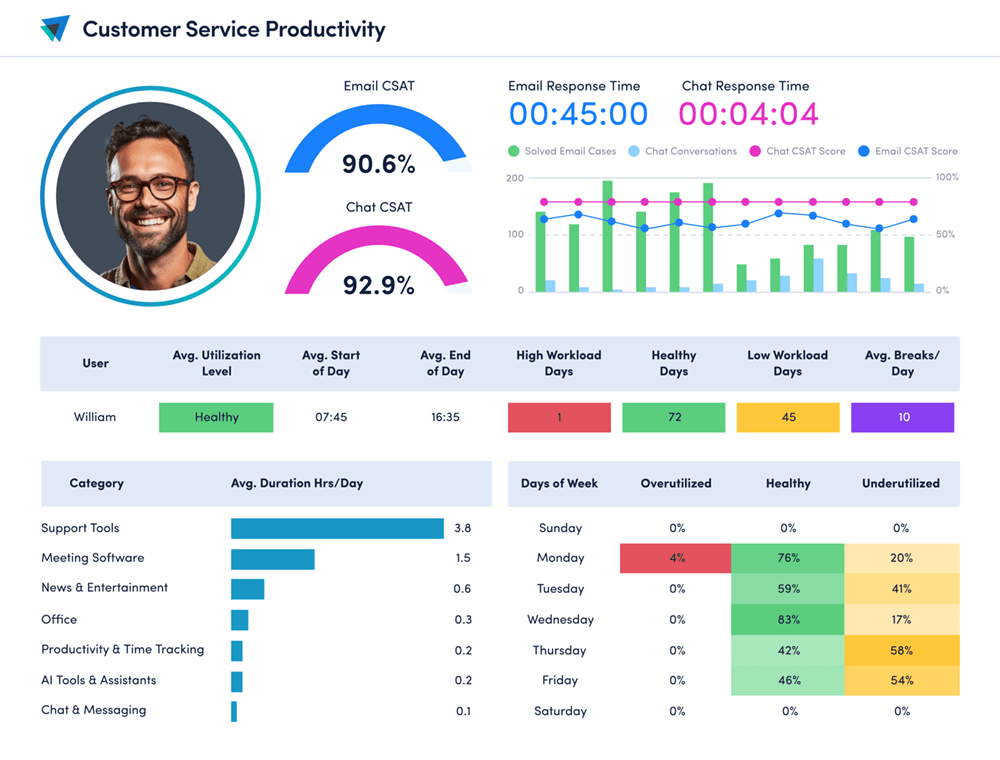
-

Sales Productivity
View sales team activity alongside CRM data (Salesforce.com, Microsoft Dynamics and/or HubSpot) to identify productivity patterns and trends that drive revenue.Ideal for: Sales leaders & revenue operations teams focused on improving rep efficiency and performance.
Request demo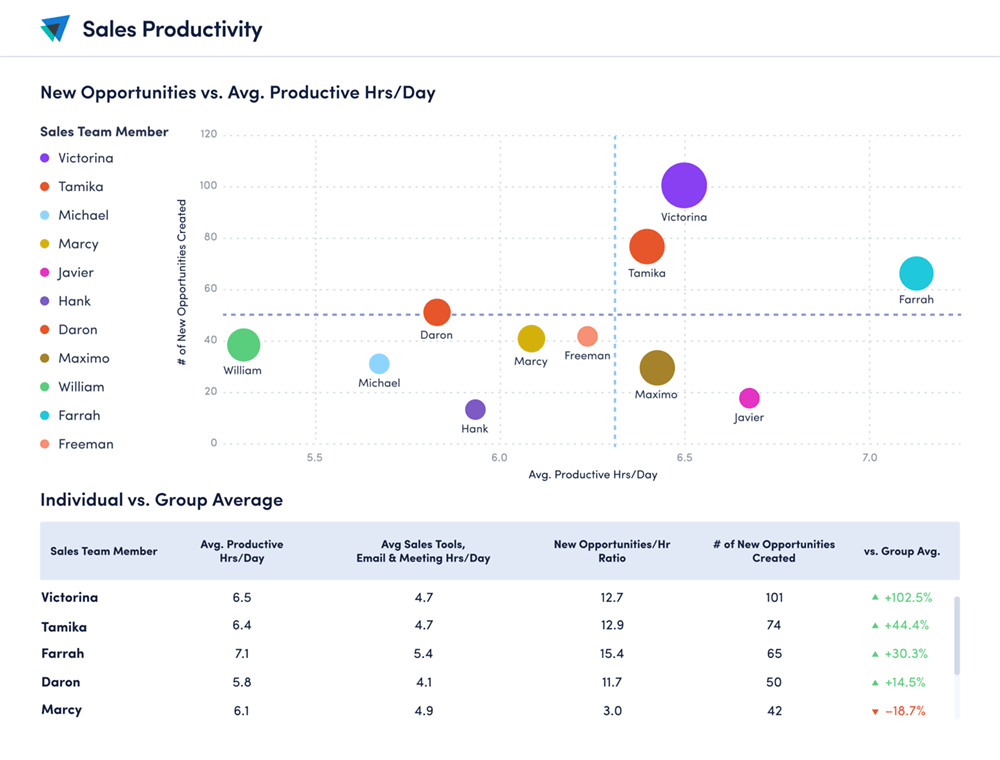
-

Technology License Optimization
Track software usage and license allocation to optimize technology investments.Ideal for: IT asset managers, procurement & finance teams aiming to reduce waste and maximize tech ROI.
Request demo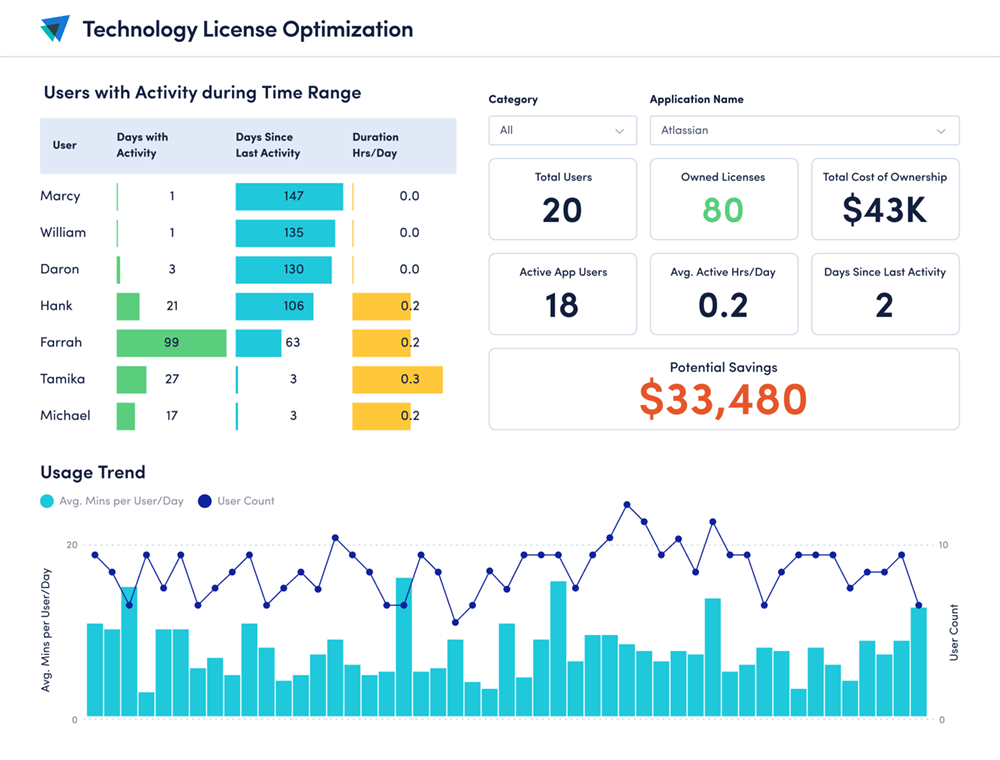
-

Financial Loss Analysis
Empower executives to quantify untapped workforce capacity in financial terms to identify cost-saving opportunities and optimize resource allocation.Ideal for: Executives & Finance leaders focused on identifying cost efficiencies.
Request demo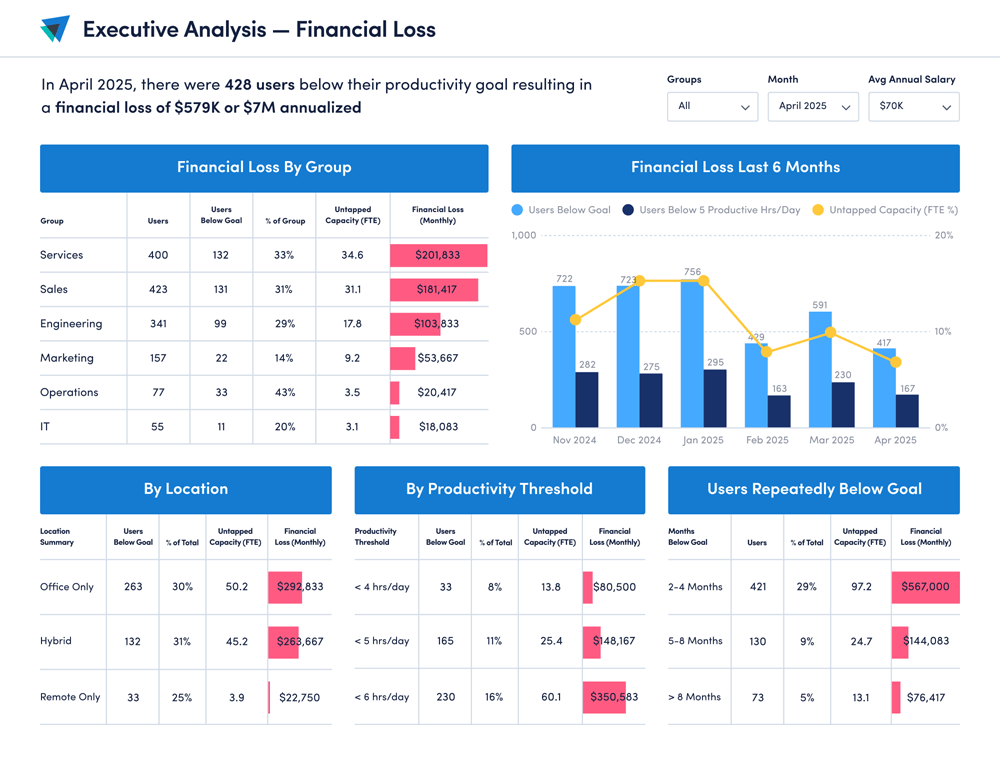
-

Custom Analysis
Our Data Services team can help integrate ActivTrak data with applications like Jira (project management data), HR systems (employee data), collaboration platforms (team interaction data) and more to meet your business needs.
Request consultation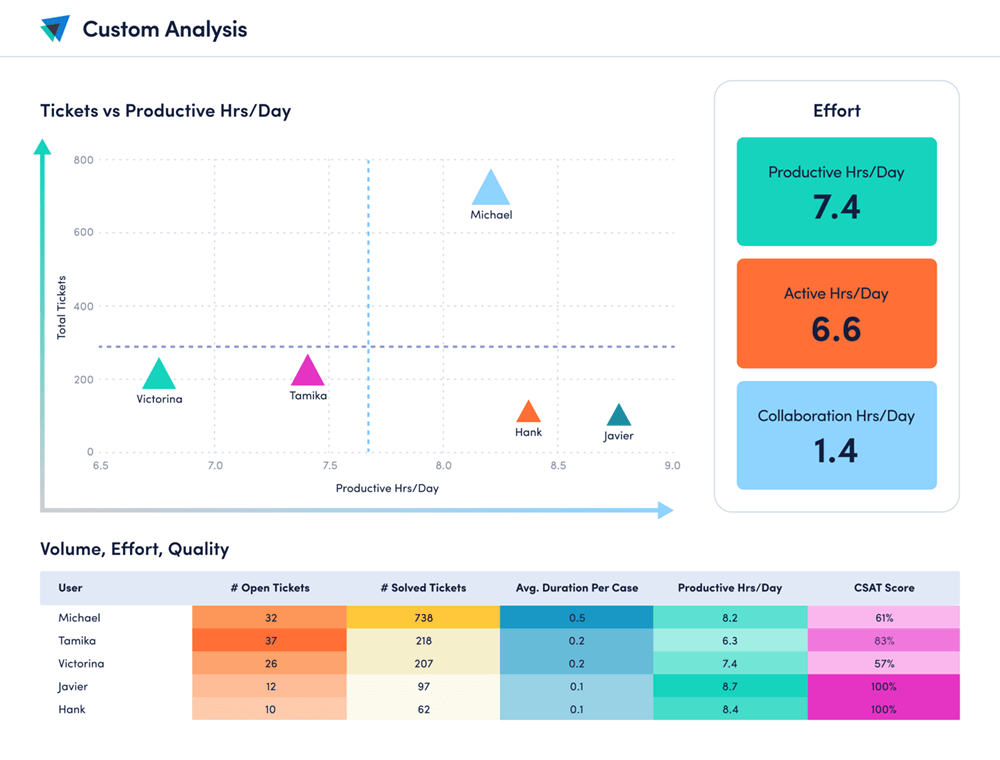
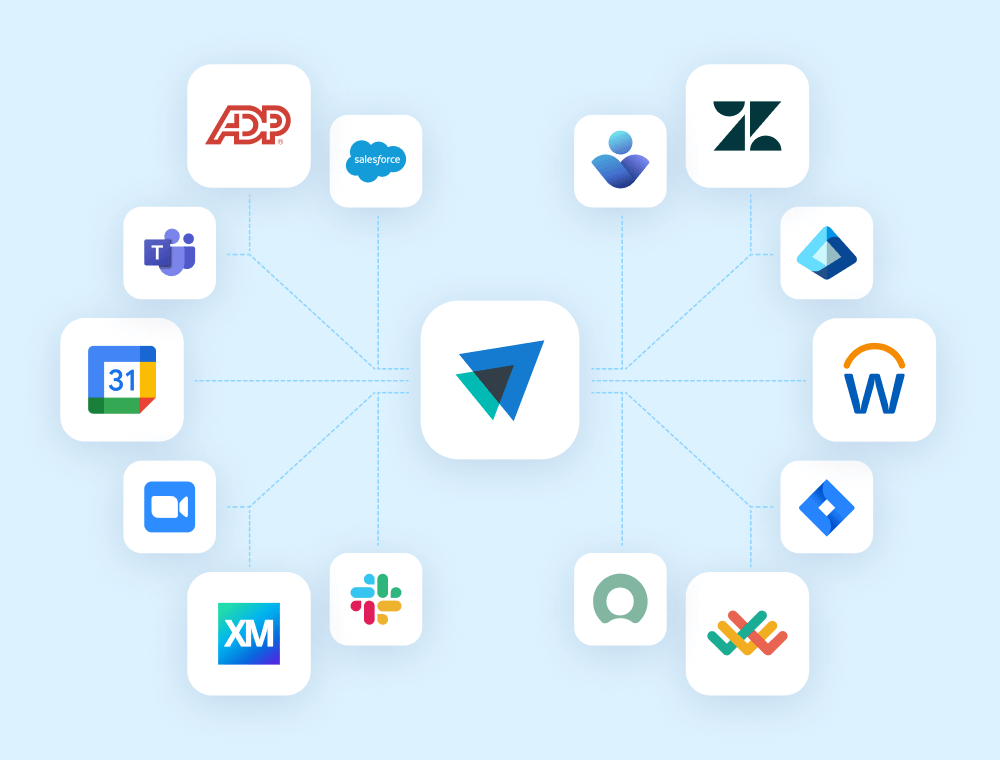
Expand Workforce Insights With ActivConnect
Seamlessly connect ActivTrak with the tools that drive your business
Saleforce

Microsoft Teams
Slack
ServiceNow
Zendesk
Zoom
Microsoft Viva
Lattice
Qualtrics XM
Jira Software
Workday
ADP
Culture Amp
Asana
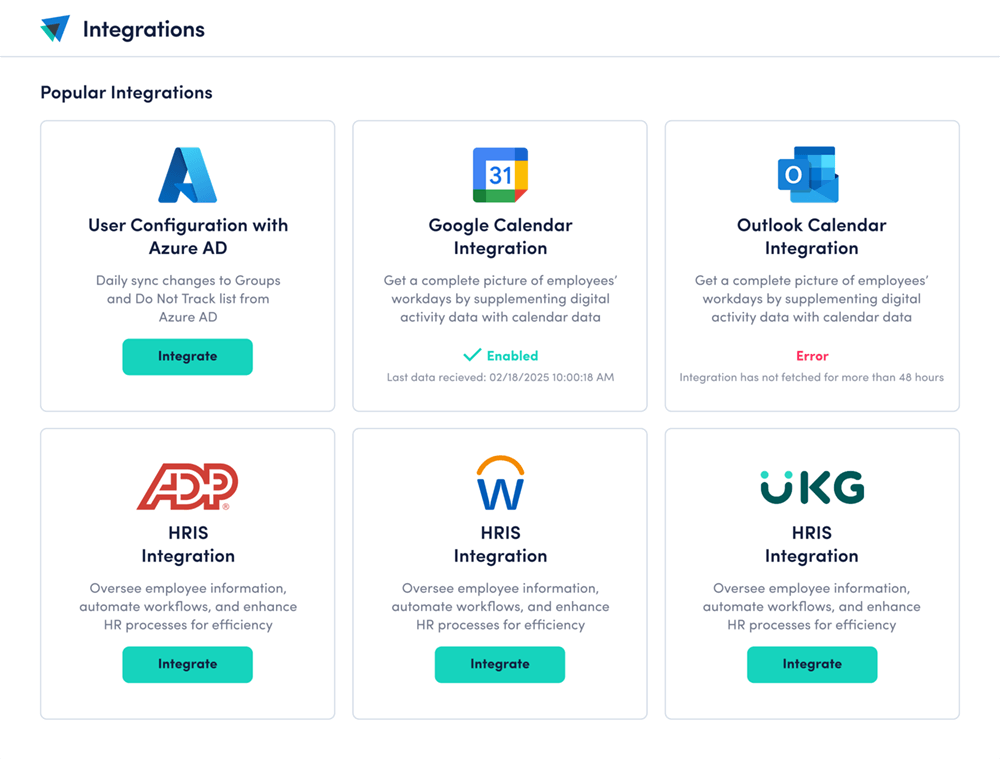
Seamlessly Connect & Automate With
Native Integrations — No API Required
CALENDAR & PTO DATA
Enhance ActivTrak with Offline Activity
Integrate calendar and PTO data to get a complete picture of workforce activity. Capture time spent in offline activities — like in-person meetings — that can’t be detected by the ActivTrak Agent alone.
Available integrations:
AUTOMATED ADMINISTRATION
Streamline User Management
Effortlessly manage users at scale while maintaining security and efficiency. With ActivTrak’s native integrations for Microsoft Entra ID (formerly Azure AD) and SCIM, you can:
- Automate provisioning & de-provisioning to reduce manual work
- Enforce role-based access control for secure user management
- Perform bulk user updates & group assignments with ease
- Sync identities seamlessly across systems
Ready to Unlock ActivTrak’s Full Potential?
Seamlessly unify your data for deeper workforce insights.