
After months of stock market volatility, surging inflation and interest rates rising, many are left wondering if we are experiencing an economic downturn. However, since experts are quick to point out that downturns are a normal part of the economic cycle and no one can predict if and when a downturn will occur, organizations should prepare to see how to improve efficiency and productivity in the workplace.
See how ActivTrak can help in the video below or read on for more details.
In a recent ActivTrak poll, we asked business leaders what challenges were top of mind for them as they take a close look at their current workplace. The answer? Improving processes to ensure cost and time efficiency.
Poll Question: What challenges are most top of mind for your organization in today’s environment?
Results:
- 54%: Improving processes to ensure cost and time efficiency
- 28%: Managing morale amidst high stress and fatigue
- 10%: Meeting resource demands amidst pushes to reduce spending
- 8%: Leveraging technology to its fullest potential
Given how the workplace has evolved and now the economic uncertainty we are experiencing, this isn’t surprising. We’ve all changed the way we work – embraced working remotely, collaborated digitally on thousands of projects, learned new tools, and humanized our work interactions along the way. And, the one thing that has become clear: The reality of today’s workforce is all about visibility.
Many leaders have concerns about the lack of visibility into their team’s work habits, productivity and well-being. These worries created a need for new reporting metrics and tools to provide visibility into how teams get work done to help improve efficiency and productivity.
With these things in mind, it’s critical in times like these to have the visibility to drive decisions around key initiatives like workforce planning, employee engagement, process optimization and technology spending. What analysis can you conduct today across these initiatives to gain more insights, set baselines and see improvement? Let’s start with some questions you can ask yourself about these key initiatives.
Key Questions to Ask for Greater Workplace Visibility
| Workforce Planning | Employee Engagement & Burnout | Process Optimization | Technology Usage & Spend |
|---|---|---|---|
|
|
|
|
We’ll take a look at each of these initiatives and discuss how ActivTrak can help you achieve the visibility you need to improve efficiency and productivity in the workplace.
Workforce Planning
When thinking about workforce planning during an economic downturn, it’s all about being more thoughtful in meeting resource demands amidst tighter conditions around spending and hiring. Are you able to determine your optimal work policy? Are you confident that productivity is taking place in the office or at home?
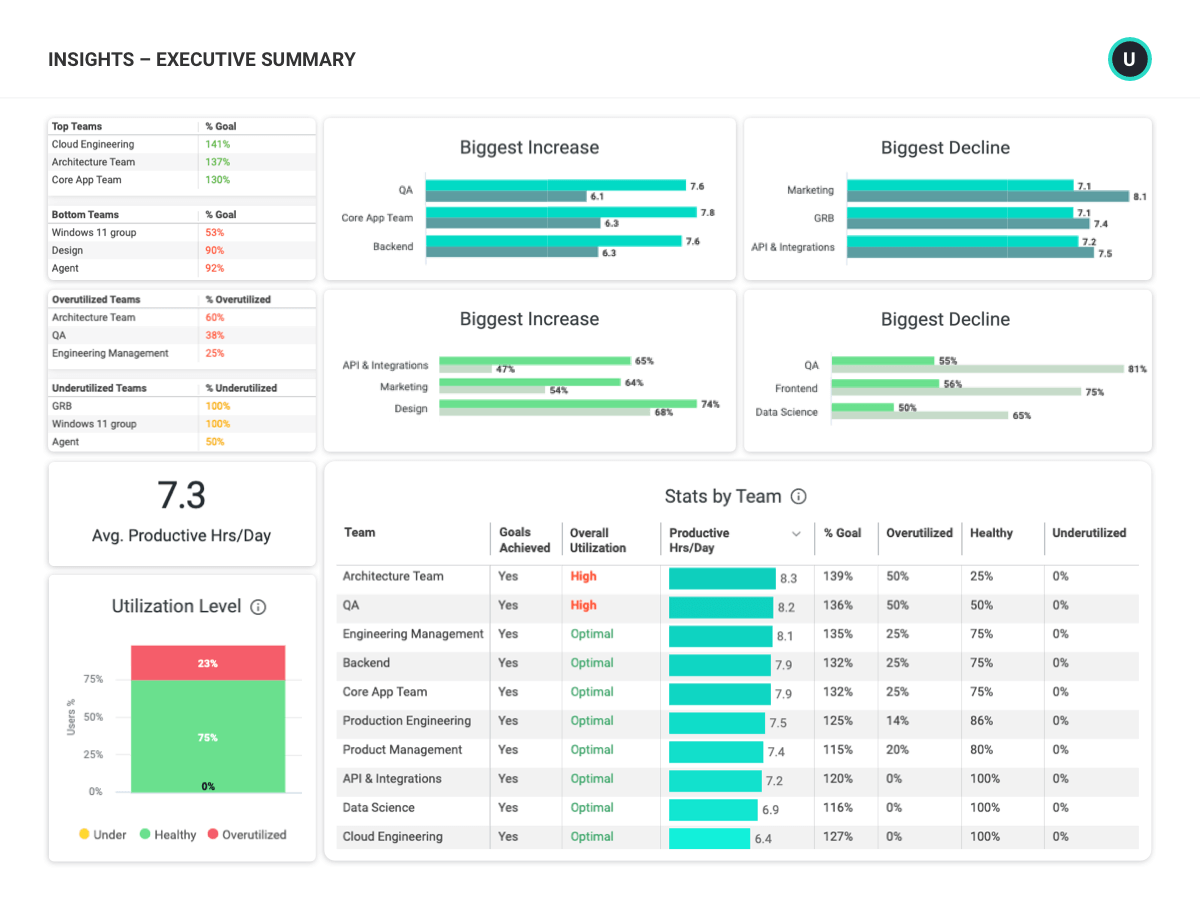
This is where the ActivTrak Executive Summary Dashboard is an excellent resource — providing a quick overview of org-wide productivity and utilization to help teams adopt sustainable, healthy work habits. Here you can quickly assess each team’s opportunity to meet or exceed goals of productivity. Are they overburdened or overutilized? Or, are they in a healthy stage? Understanding where you need to redistribute workloads or possibly reprioritize a company initiative gives you the insights you need for better workforce planning.
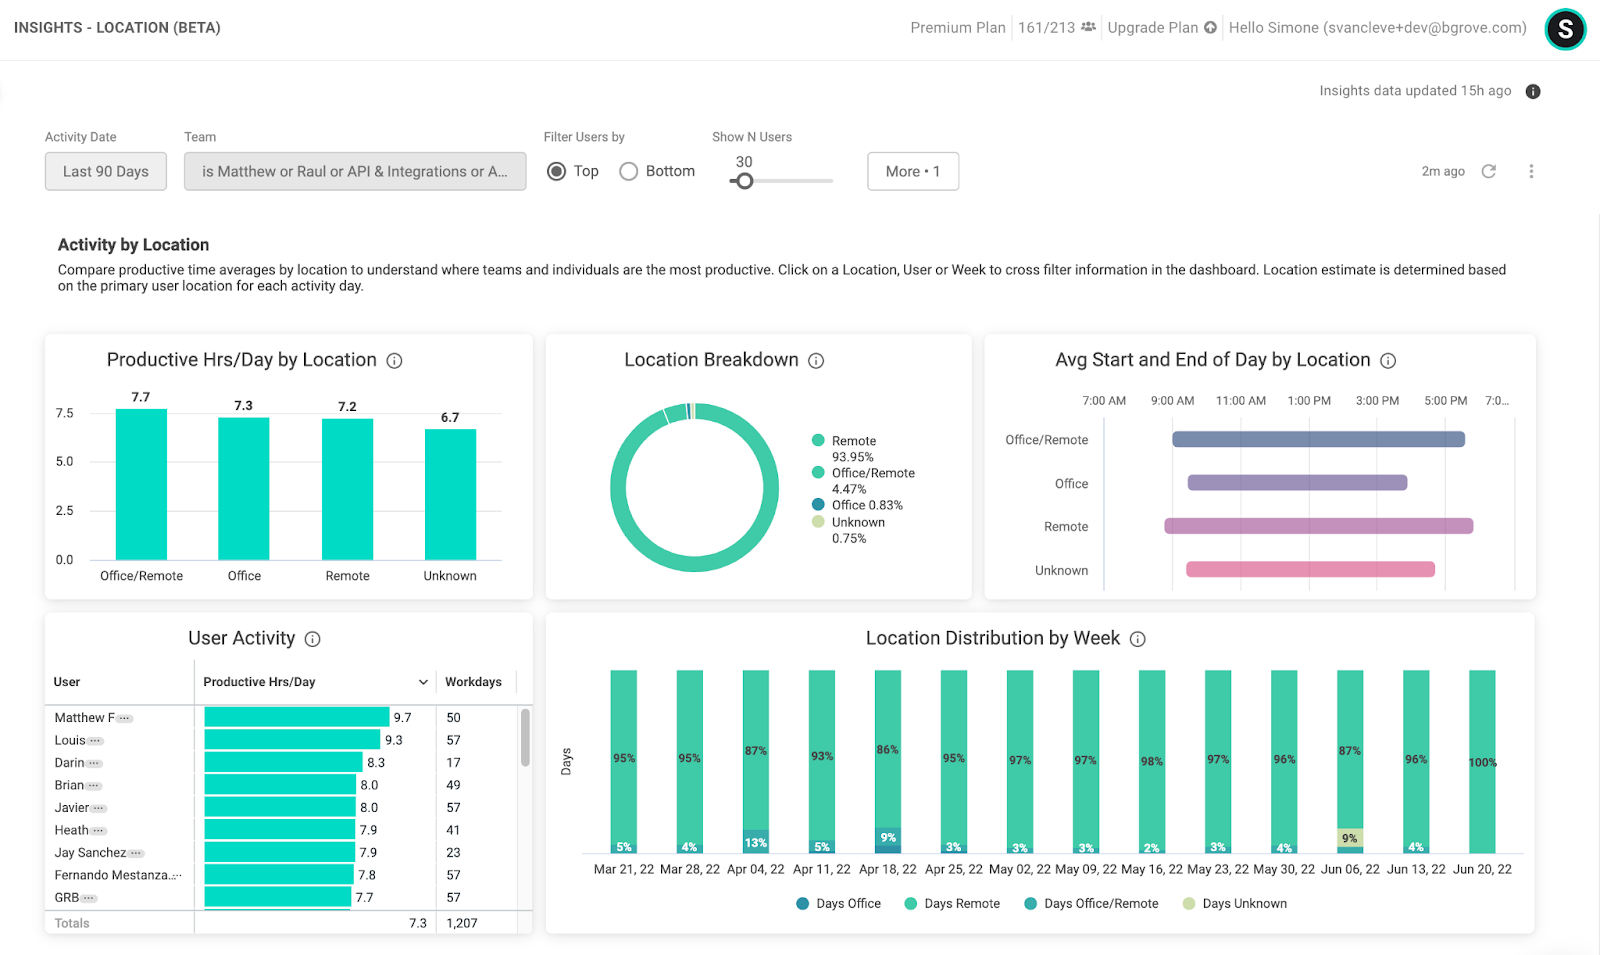
Soon, we’ll be announcing the early availability of Location Insights. In the context of workforce planning, this dashboard provides visibility into the best work model for teams and individuals. For instance, certain employees work better in different situations or locations.
Based on that information, you can determine if there is an opportunity to right-size the cost of your spending on real estate. You can also gain insights into whether or not employees are aligning with the work policies you’ve put in place (for example, employees must be in the office two days per week).
Employee Engagement & Burnout
While engagement and burnout aren’t new topics, they certainly have been hot ones over the past 24 months. With the possibility of additional restrictive conditions ahead, this is an important area to continue to keep an eye on. How do you know when underutilization or overutilization of individuals and teams exists? Do you know what is contributing to employee fatigue?
Here it’s important to ensure you properly balance the workload across the organization so that you avoid burnout and also sustainably optimize your employees’ workload.
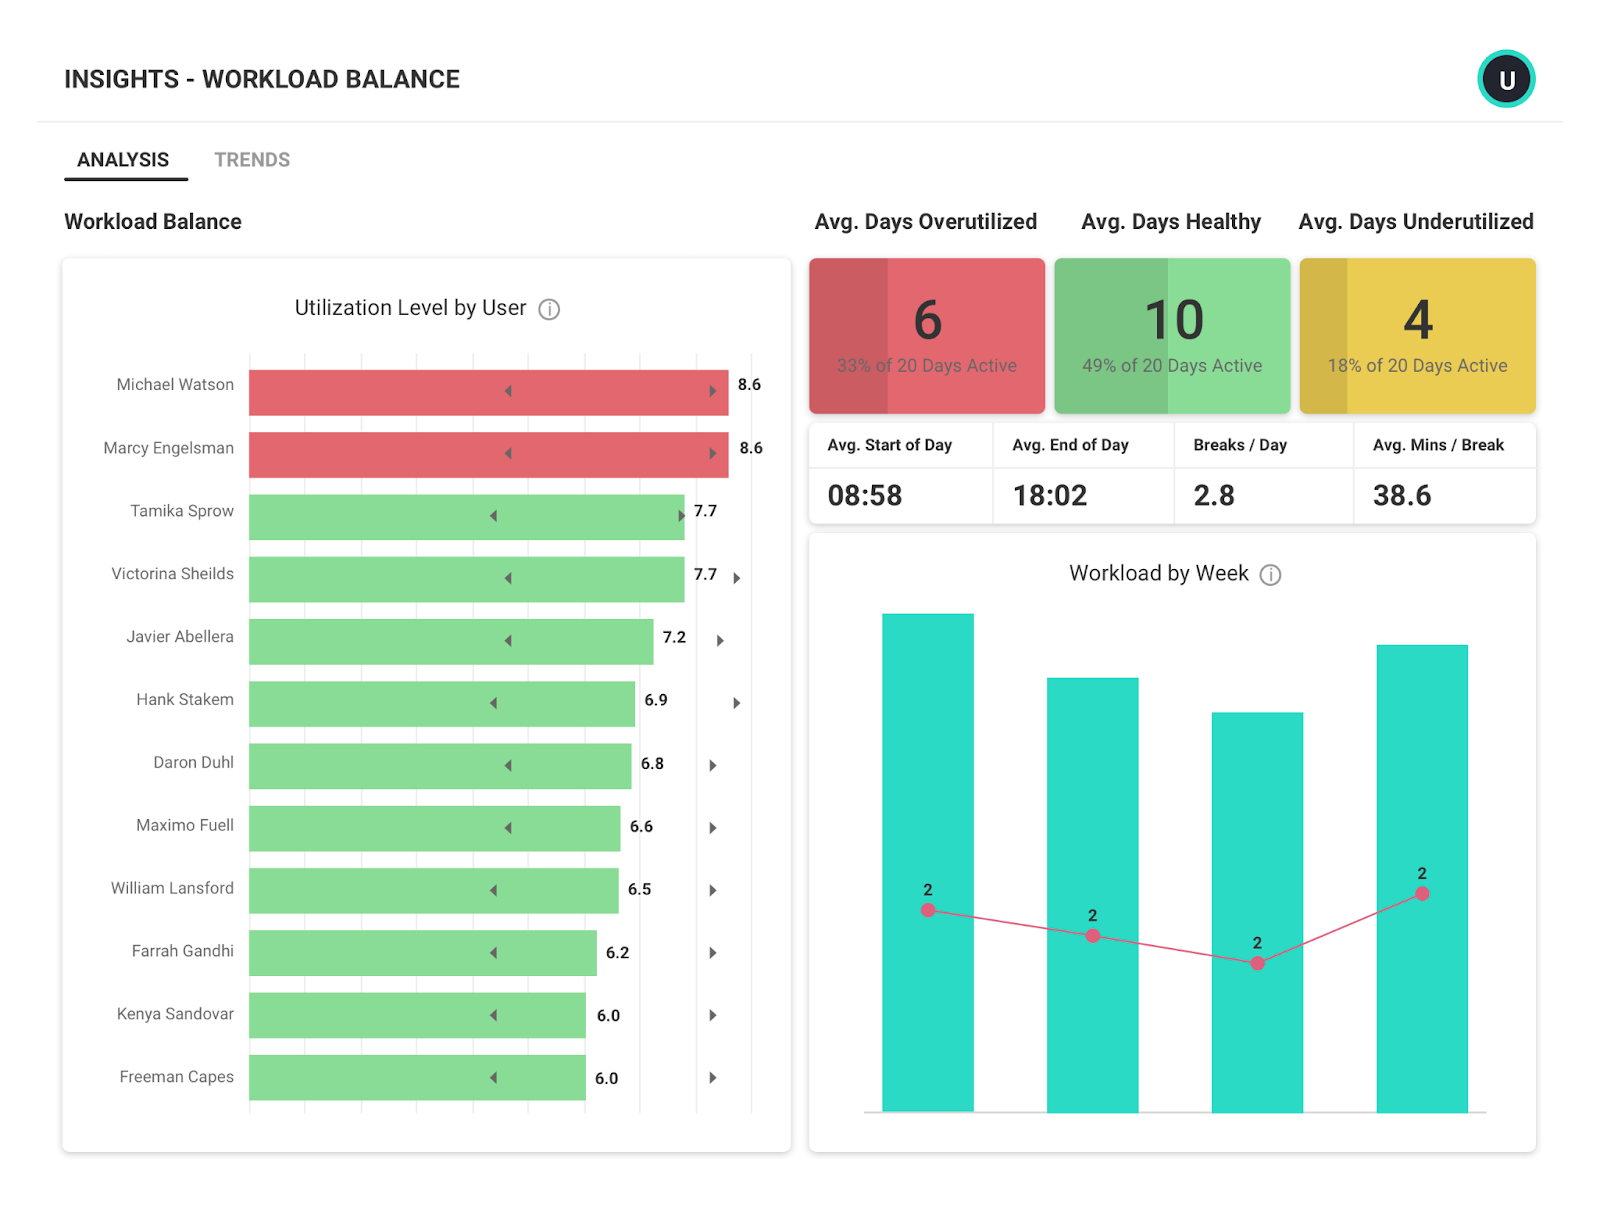
The Workload Balance Dashboard in ActivTrak helps you quickly assess employees at risk for burnout and what factors contribute to employee strain. What underutilization and overutilization exist? Are there opportunities to redistribute workload to ensure healthy habits?
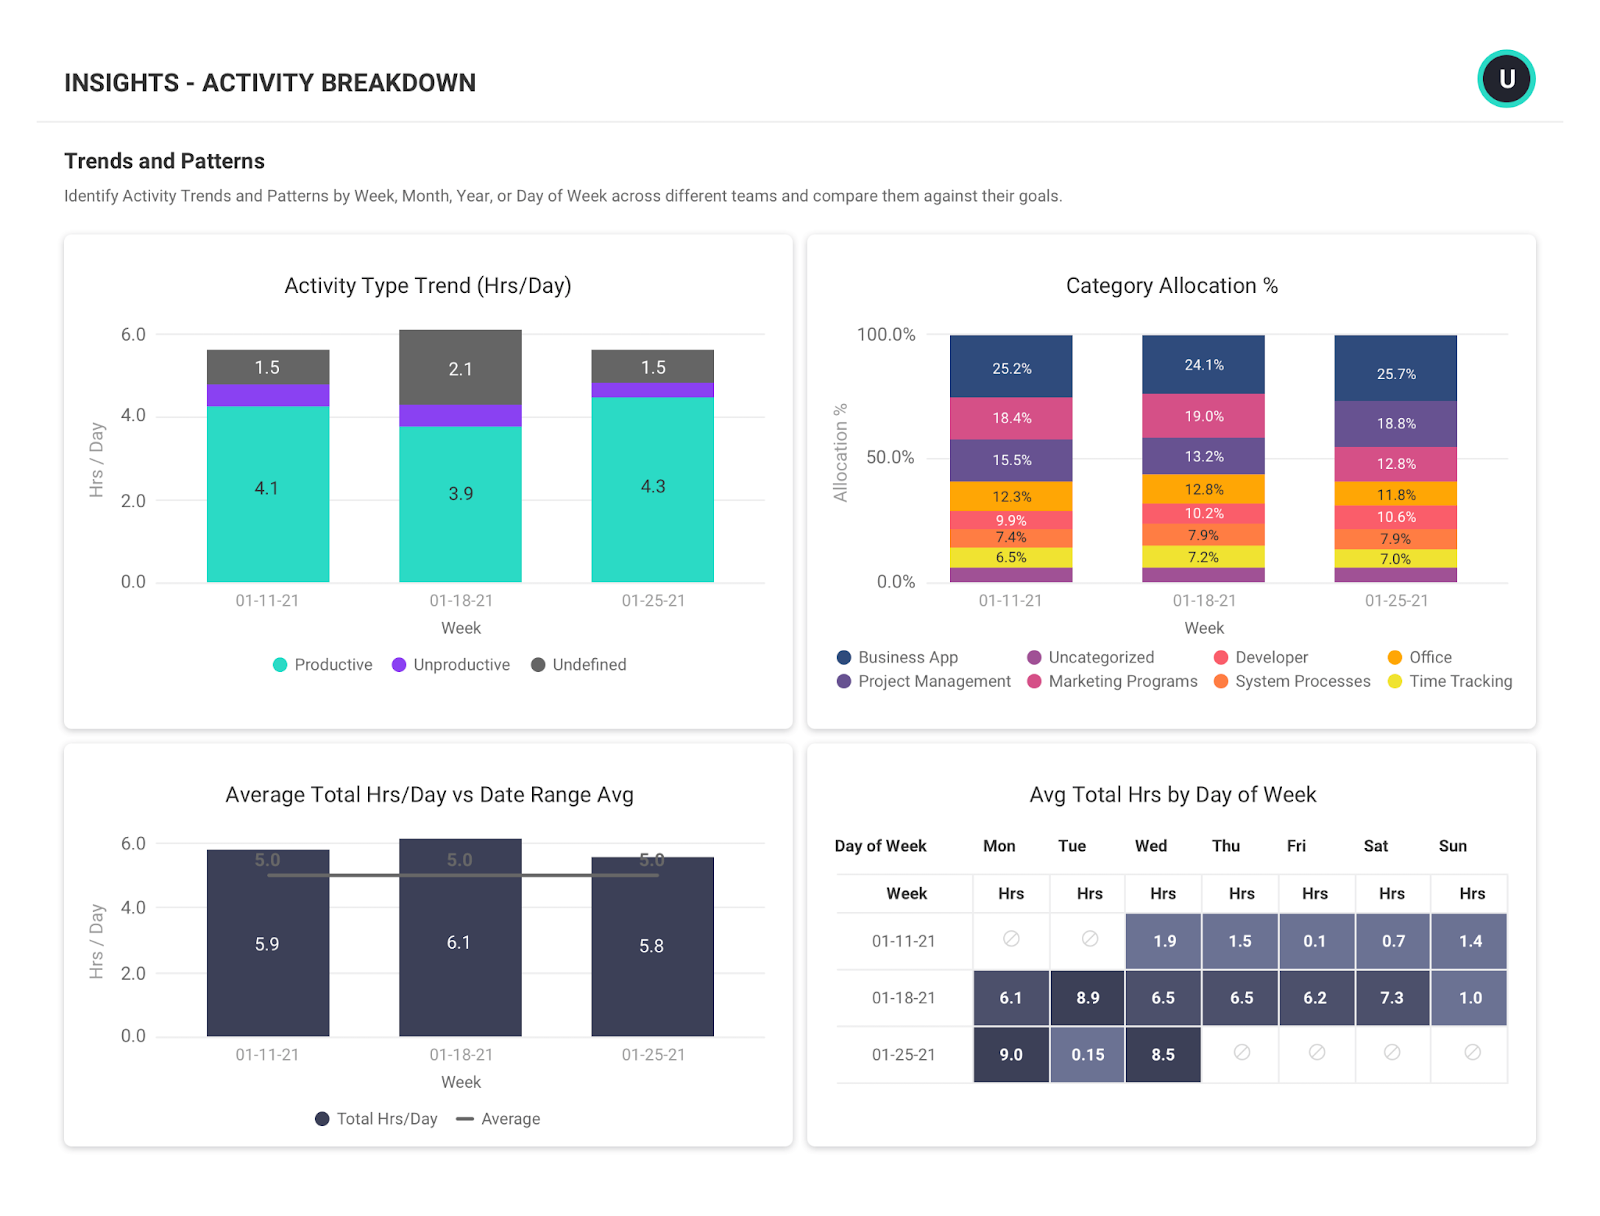
Next, you need to understand how this trends over time. Gather insights into normal working habits by taking a look at the Activity Breakdown & Trends Dashboard, which shows how time is spent across individuals and teams. This is a great way to visualize and assess if activities align with the priorities and role expectations you have set.
You can also see break time patterns, including the number of them per day. For example, let’s say the day with the highest concentration of breaks seems to be on Tuesday. Maybe there is an opportunity to encourage more consistent breaks throughout the week for better work wellness. This type of data helps managers understand what the dynamics are across their team and ensure there is a balance between sustainably hitting productivity goals while ensuring they don’t become a risk of attrition for the company.
Process Optimization
This initiative primarily focuses on gaining more visibility to see where there are opportunities to be more efficient. Do you know how your top performers are executing? Are there opportunities to learn from them? What are the top sources of interruptions and inefficiency that are likely pulling your employees away from focused work?
With process optimization, we start diving more into how the work is happening, rather than if you’re meeting your goals or if you have the right workload balance.
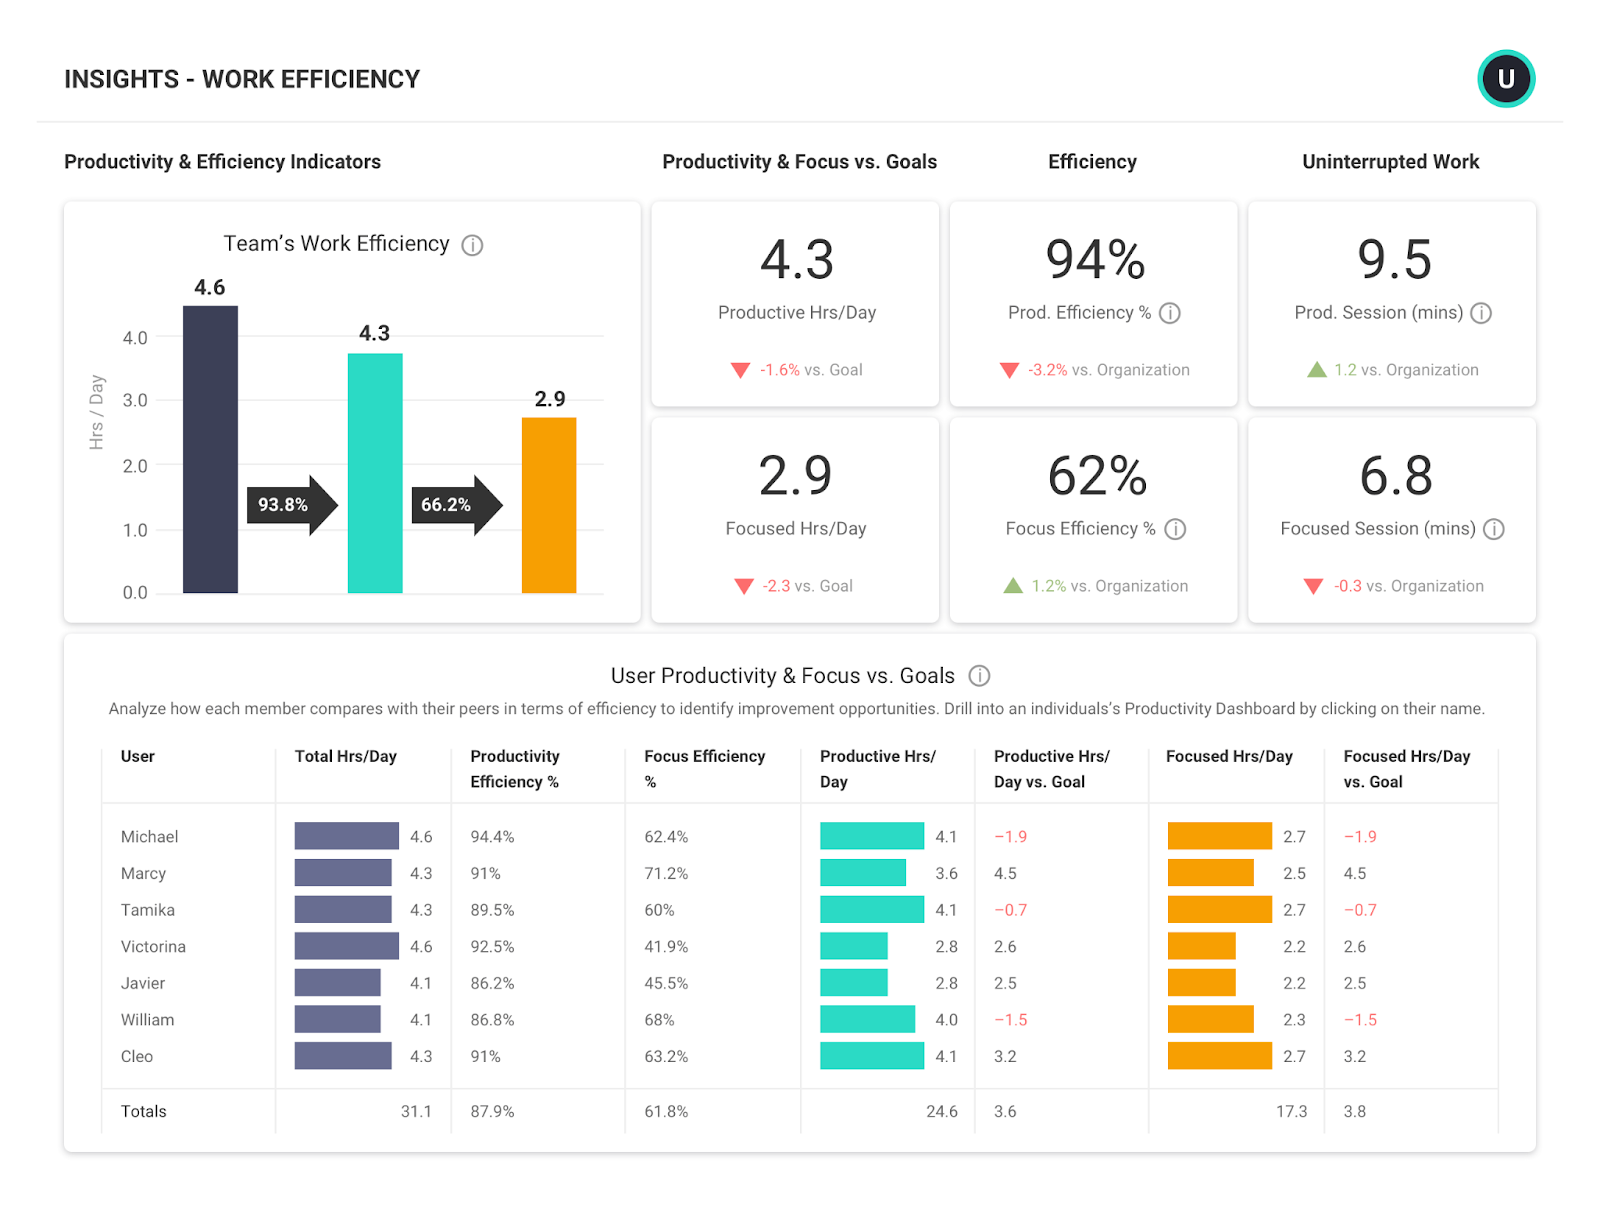
The Work Efficiency Dashboard can help you understand working hours, productive hours and focused work time to assess team efficiency and engagement. This is where all those dynamics – focused, collaborative, multitasking work – are playing into this analysis.
See how your team’s total screen time looks and how much of that is productive versus how much of that productive time is focused. For instance, you’d expect your engineering team to have longer focused sessions – 20 to 30 minutes – compared to your sales team, which would have more like 10-minute focus sessions.
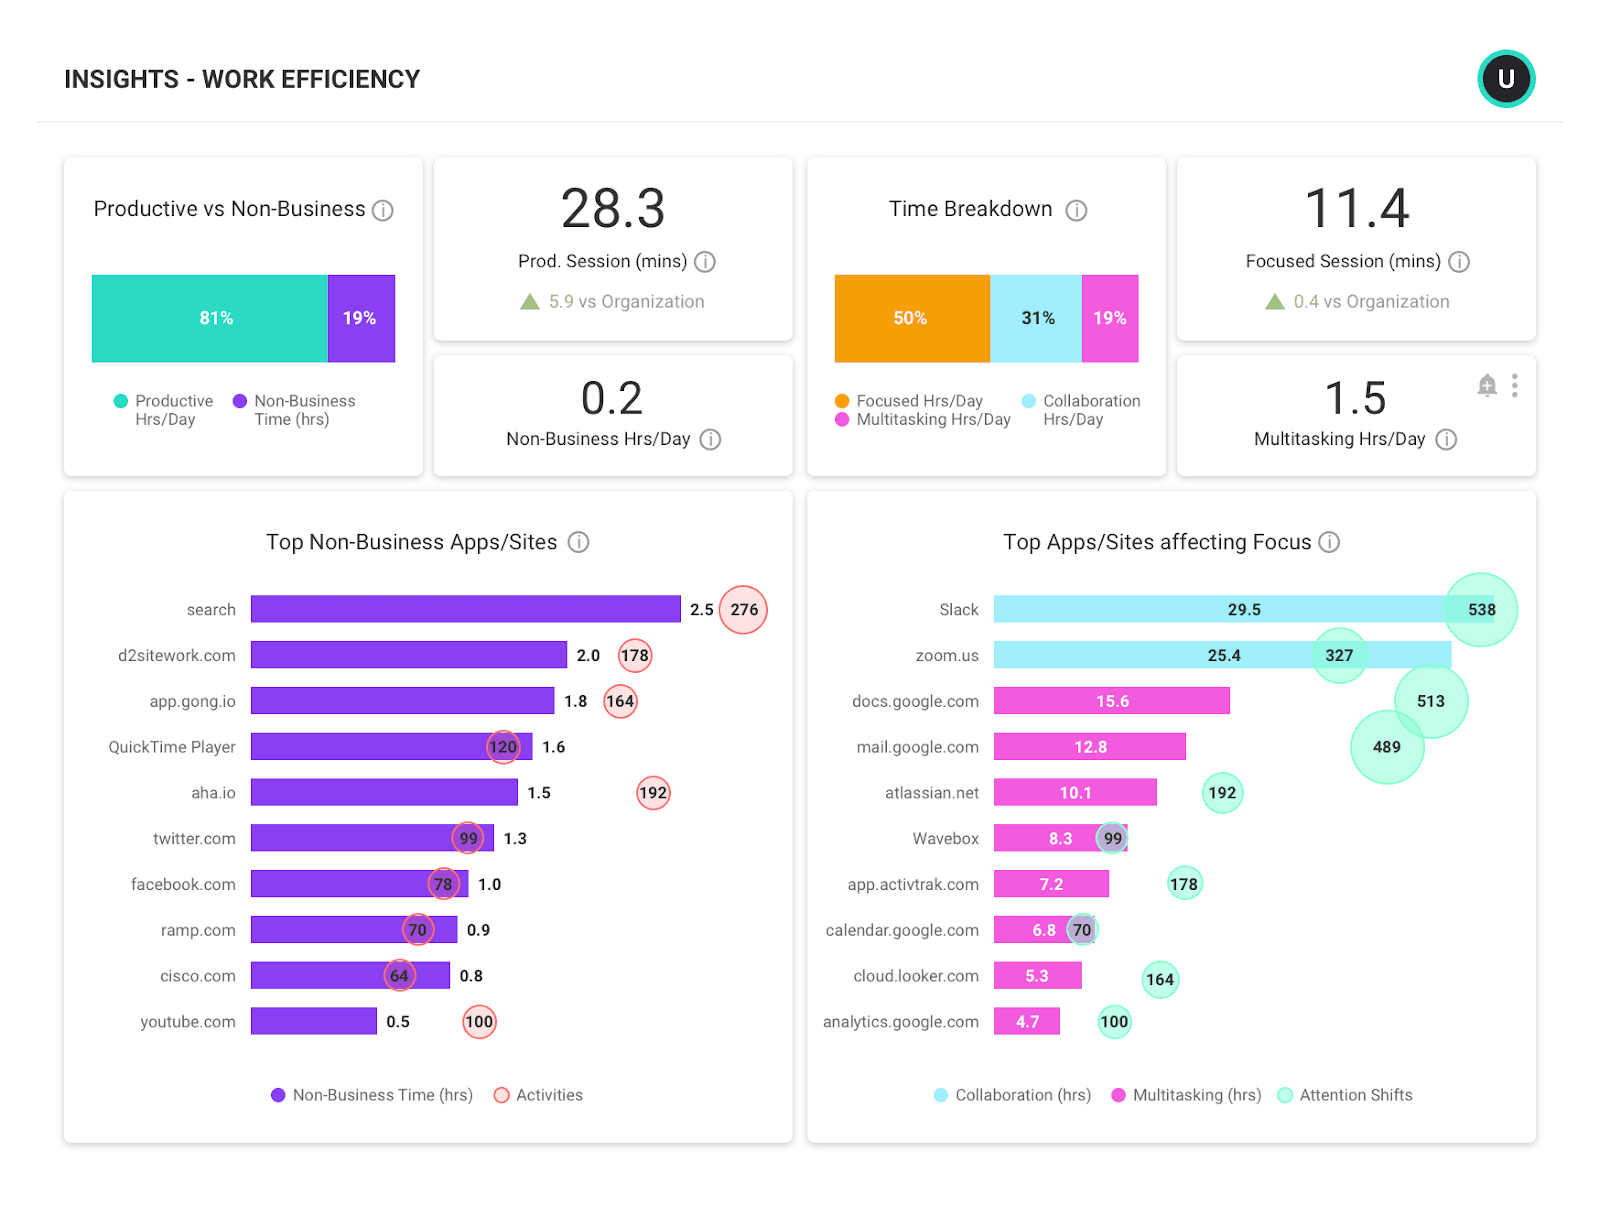
You can also view Inefficiency Sources, to analyze the effect of non-business activities and attention shifts on productive and focused work time. What are the top sources of interruptions and inefficiencies? What’s driving your team away from focused work? When you understand what’s pulling team members away from high-priority work, you can lead initiatives to develop process or tool improvements like embedding tools together so team members don’t do as much context switching.
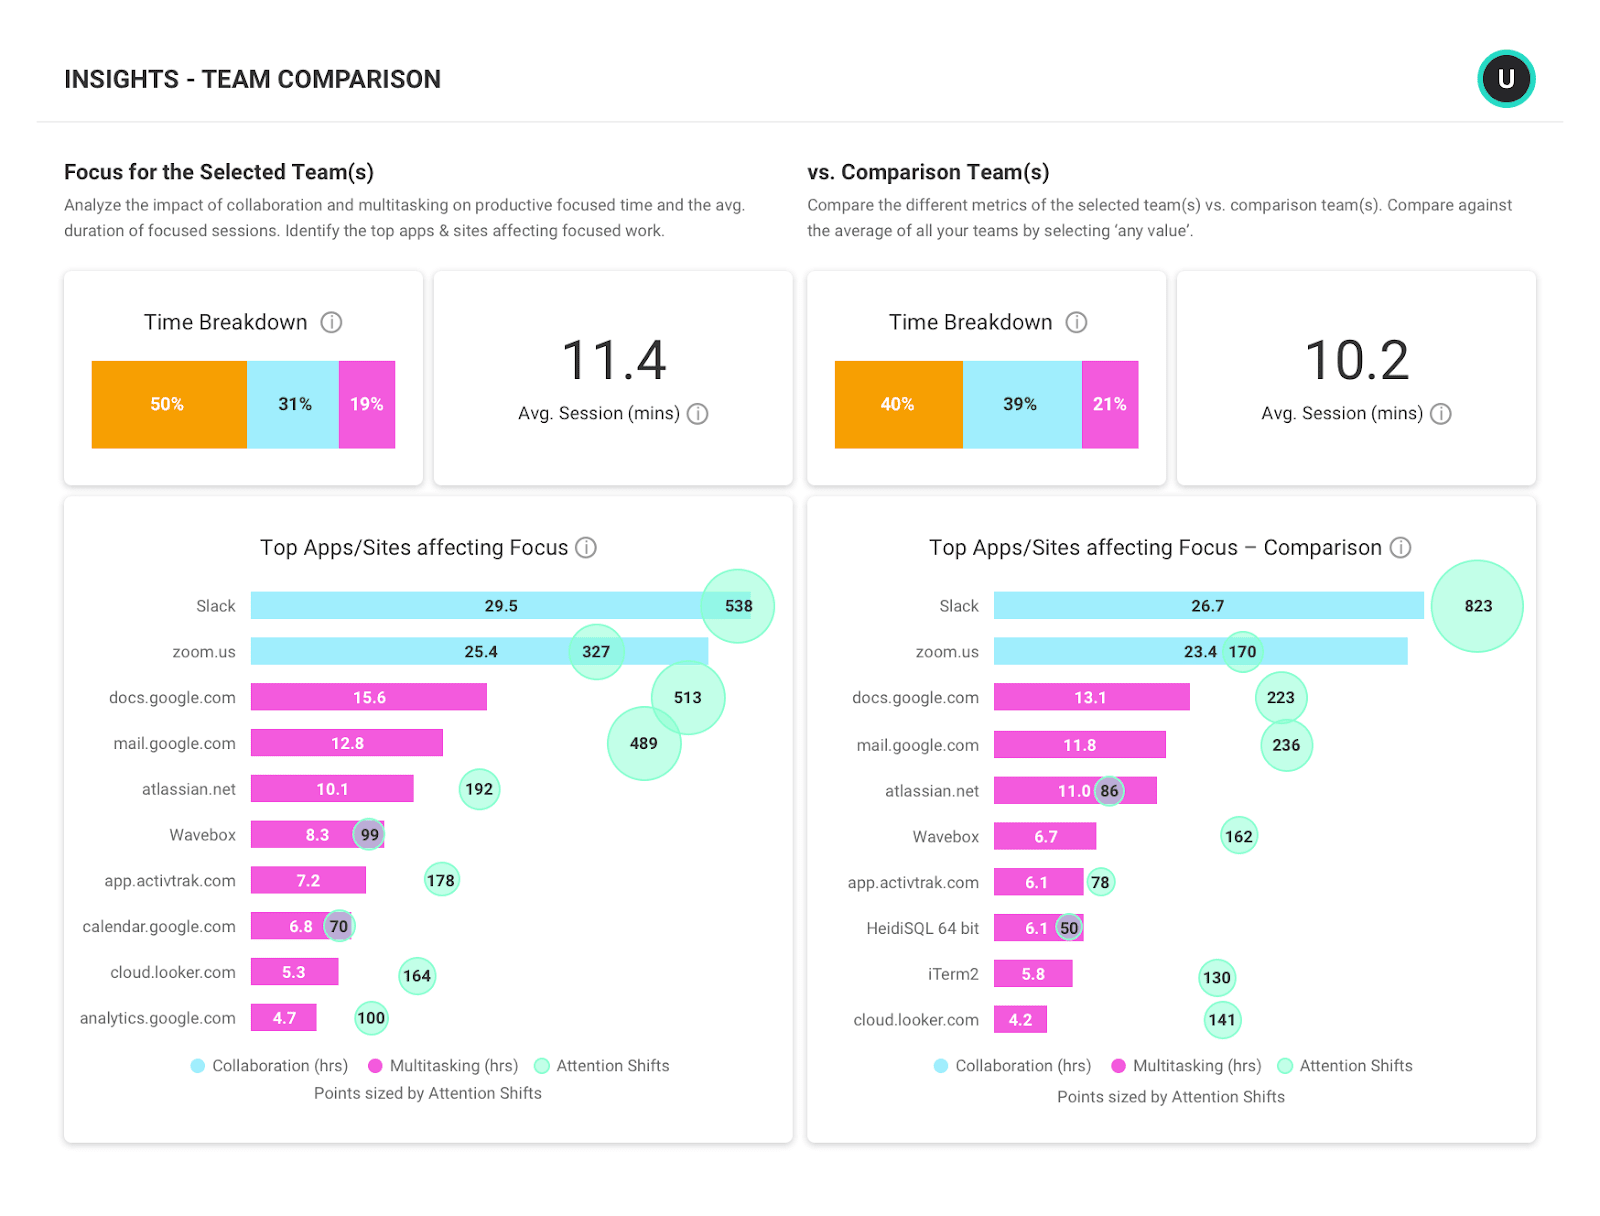
Diving in further, you can look at a comparison between two teams with Side by Side Comparison, to discover opportunities for teams to learn from one another about what they are doing to improve efficiency and productivity. How are they establishing the right etiquette of collaboration to avoid the high number of distractions? This is a great opportunity for leaders to establish better processes to ensure teams have time to focus on that deep work.
Technology Usage & Spend
When you see insights in process optimization, where employees are really focusing or not focusing in particular areas, it becomes useful to think about the technology that might be driving those various behaviors. That leads us to ask key questions about technology usage across your organization and within teams. What tech accounts for our largest spend? Is it in line with what you originally intended it to be? Is it perpetuating the types of behaviors that contribute to your productivity or is it hindering it?
This is where ActivTrak’s insights into Technology Usage and Adoption are critical. Here you can understand which applications are being used by which teams and how often so you can invest in the right technologies and training.
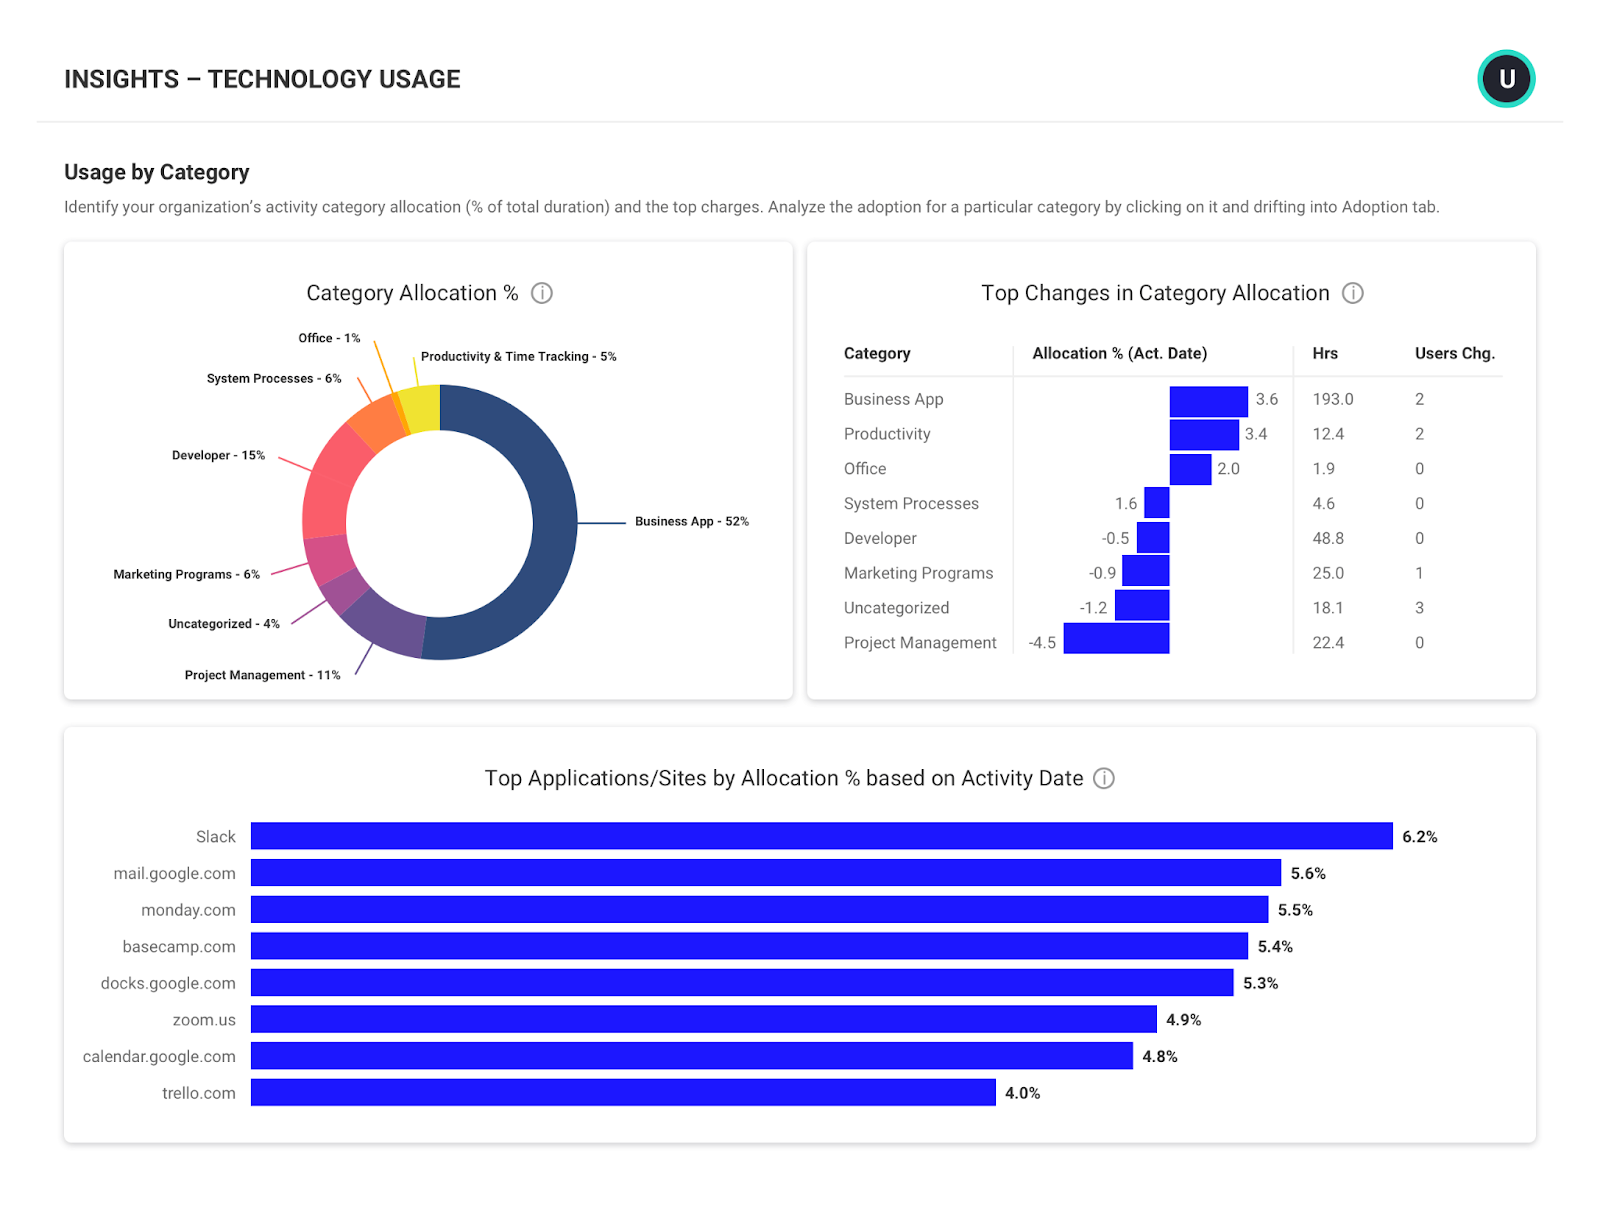
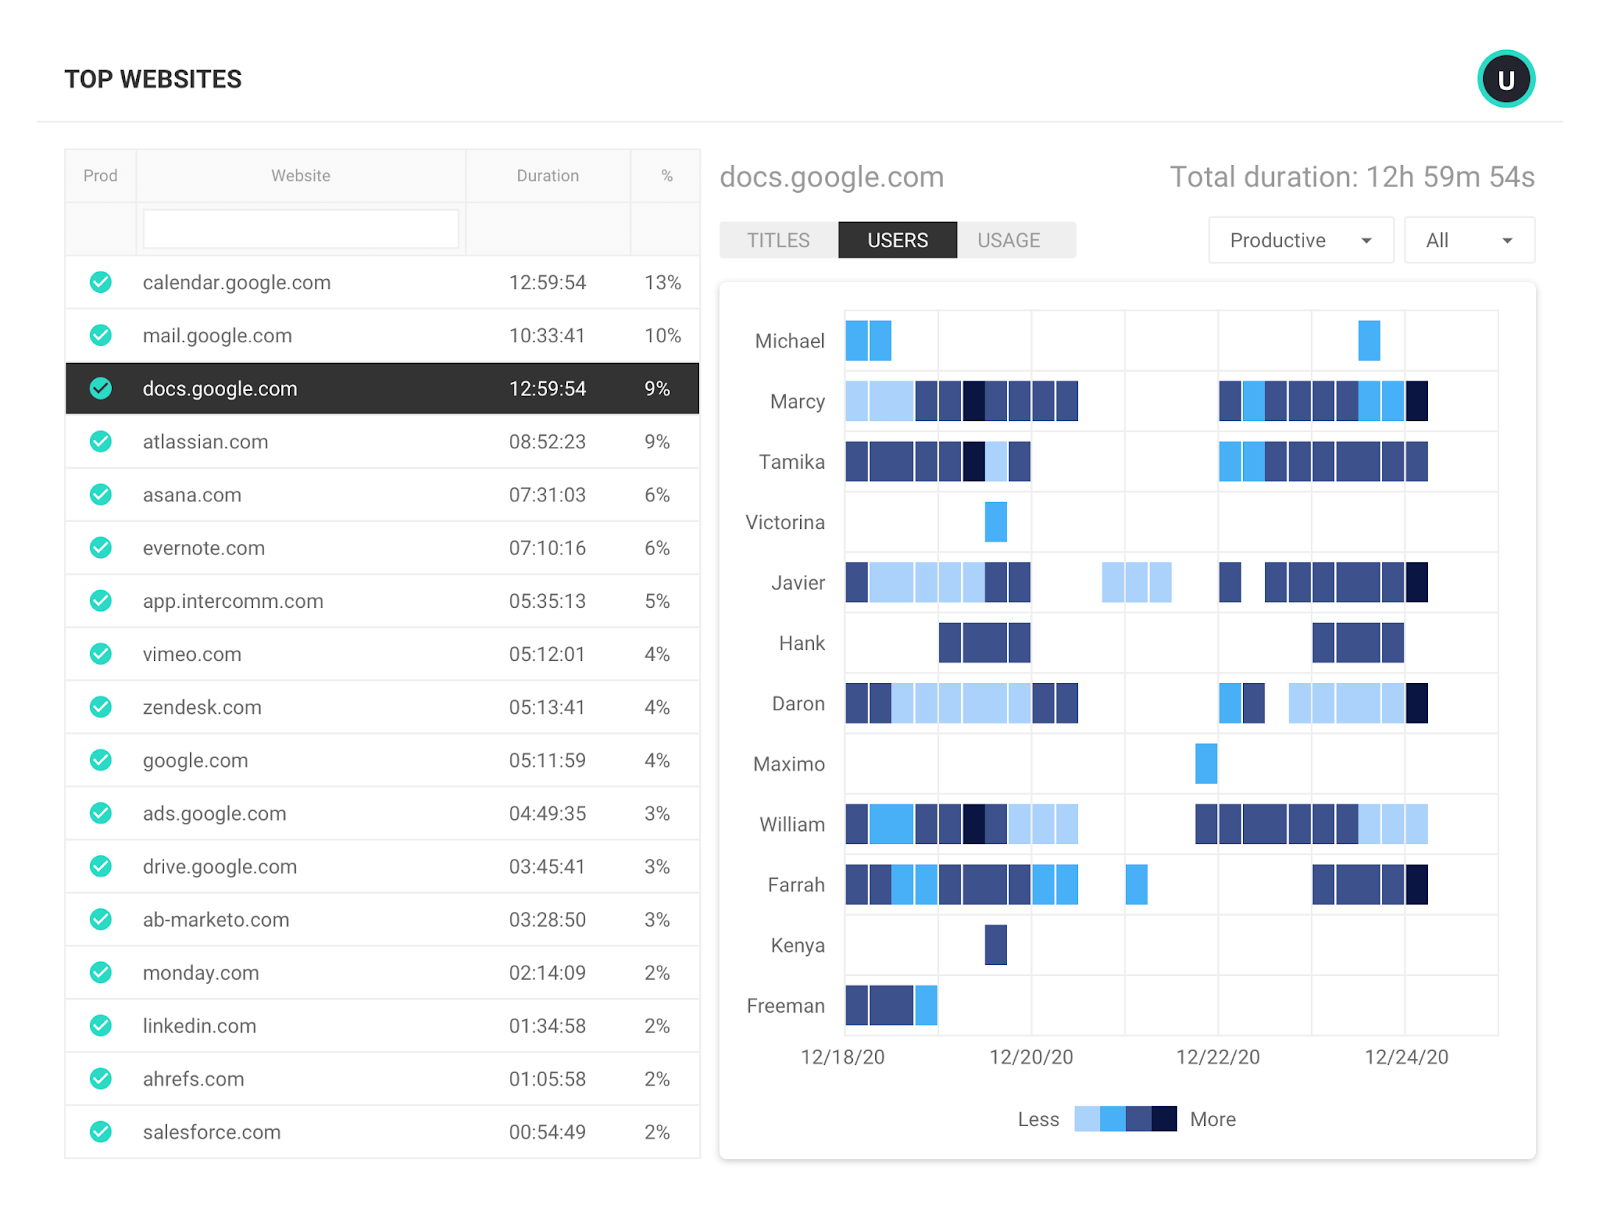
There is also the Top Sites Report to understand if there are any redundant apps that you could consolidate to streamline costs. Perhaps there are opportunities for an app to be embedded or integrated in a different way into your processes to ensure more usage and more collaboration with different team members.
This is a helpful analysis to conduct during this type of economic environment as we think about being more conservative in our spending and being more thoughtful in fully optimizing what we have already spent. This is an important exercise for not only adding, but also for auditing.
Making Clear Goals & How to Measure Them
When you take action across any of these initiatives, it’s also important to measure the impact to accompany your actions with clear goals. Consider the following tips on how to create clear goals and how to measure them.
When it comes to improving efficiency and productivity in the workplace, leaders must take action to drive responsible change. The ActivTrak platform gives you tremendous visibility around technology, processes, best practices, workload balance and much more. It’s also up to you as a leader to decide what action you’re going to take to ultimately improve the numbers that you’re seeing and guide them in the direction you want them to go.
It’s also important to note these actions come in all forms and some are more expensive than others. What matters most is that actions take up time, even those that appear to be inexpensive.
Most importantly, if you’re going to take an action amidst an economic downturn, you need to ensure that you understand where you are today, and measure that baseline so you can see the impact. For this reason, you must measure before and after we put these interventions into place.
Checklist: Metrics to Help Improve Efficiency and Productivity in the Workplace
We’ve created a checklist of the metrics you should look at for each initiative. Each includes a recommendation for a baseline to capture. And remember, this isn’t a one-time exercise, but one to continuously have in place to bring about change and improve efficiency and productivity in your organization.
| Initiative | Metric |
|---|---|
| Productivity |
|
| Engagement |
|
| Burnout |
|
| Process Optimization |
|
| Technology Usage |
|