Show Hide Topic Menu
- Productivity Management
- How it Works
- Learn how
- Employee Productivity: A Modern Approach
- Productivity Monitoring with Transparency
- 3 Productivity Metrics to Help Your Team Work Wiser
- Productivity Measurement at Your Company
- Tracking Productivity Through Monitoring Software
- Productivity Management for Lasting Change
- Team Productivity Through Workforce Analytics
- What Workforce Productivity Can Teach Leadership
- Productivity vs. Efficiency: Differences and Formulas
- 10 Workplace Productivity Statistics Leaders Should Know
Table of contents
The most progressive, dynamic and efficient enterprises aren’t just made up of productive individuals — they’re made up of productive teams. They help streamline operations, evenly distribute a department’s workload and generate lots of innovative ideas that will push your enterprise further. As such, it’s important to ensure that your enterprise’s teams are working as efficiently as possible.
In this chapter, you’ll learn how to dig deeper into your team’s productivity, taking you beyond what you can learn through check-ins or stand-ups so you can create a healthier work environment. We’ll cover key productivity metrics you should be tracking and the questions they can help you answer to boost your team’s performance.
The importance of looking beyond employee productivity
Team productivity is just as important as employee productivity, but sometimes managers place team productivity management on the back burner. After all, if your individual employees are productive, when you put those individuals on a team then that entire team will be productive, right? Well, it’s complicated.
In reality, there are a lot of factors that can influence a team’s performance and productivity, and measuring individual productivity alone won’t give you the whole picture. For example, a productive employee who meets their goals each week might not be an effective communicator or collaborator — two characteristics that make for a great team member. If you’re only focusing on their individual performance, you may miss the fact that they lack these key team-building skills.
By the same token, a single unproductive employee can compromise the productivity of your team as a whole if you aren’t careful. Social loafing — the notion that people are likely to exert less effort when working as a team compared to when they’re working alone — is more common than you may think.
With distractions like social media and constant notifications from work apps keeping individuals off task during the workday, it’s understandable that some people may stop pulling their weight when it comes to teamwork. Avoiding that means actively tracking team efficiency and keeping an eye on all of your team members.
All of this is to say there is a lot of room for nuance. When it comes to team productivity, we recommend using data to inform your team productivity analysis but not determine it. Take all of the information in and use it to create a well-rounded picture of your team’s productivity.
How to measure and use team productivity data: The basics
To measure the productivity of your team accurately, you have to compare your current data to a pre-established baseline in order to determine whether productivity has increased, decreased or stayed the same over a given time. Of course, that is a lot easier said than done. Let’s start with some basic questions about team efficiency and dig into how data can help you answer them:
Question: How can I find out how my team is performing on average?
Answer: On the ActivTrak platform, it’s easy to get insight into average team productivity. ActivTrak’s team average is an indicator of the current baseline numbers for productivity and focus behaviors across the entire team. It shows average numbers across various periods of time with an overall average at the end.
We’ve found that 12 weeks is usually enough time to see a change in productivity levels (either positive or negative) after you’ve taken steps to increase productivity. That’s why we recommend taking a look at the Team Average Daily Trend graph to track changes in productivity trends.
Question: Once I find my average baseline, where do I go from there?
Answer: It’s time to set goals! We recommend using the performance of your team’s top quartile to inform your team’s stretch goals.
Even though only some of your team members may be averaging numbers in the top quartile, it’s still important for you and your team to see what’s possible. You can even use your Team’s Top Quartile Average to guide your regular productivity goals (not just the stretch ones) if the difference between the top quartile and the average is large.
Leveraging data to understand team performance and productivity
To create a productive team and a positive work environment, you have to look beyond each individual team’s performance to understand how your teams compare to others in your enterprise. That comparison can alert you to inconsistencies that would benefit from further investigation, more data and more open communication with team members. It can also help you understand the wide range of working habits and skill sets across your enterprise.
Of course, every team is different, and comparing two teams can be tricky. If you put team A and team B side by side and the former is outperforming the latter, it’s easy to turn productivity management into a competition (or worse, a blame game!). Also, putting employees in competition with one another lowers morale and can have the opposite effect on employee engagement, motivation, and productivity.
Here are some more common questions to help you grasp the best ways to compare and track team productivity:
Question: What team productivity metrics should I look at to understand how my teams work?
Answer: There are a few key metrics that you can find right in ActivTrak that are good to focus on across all your teams:
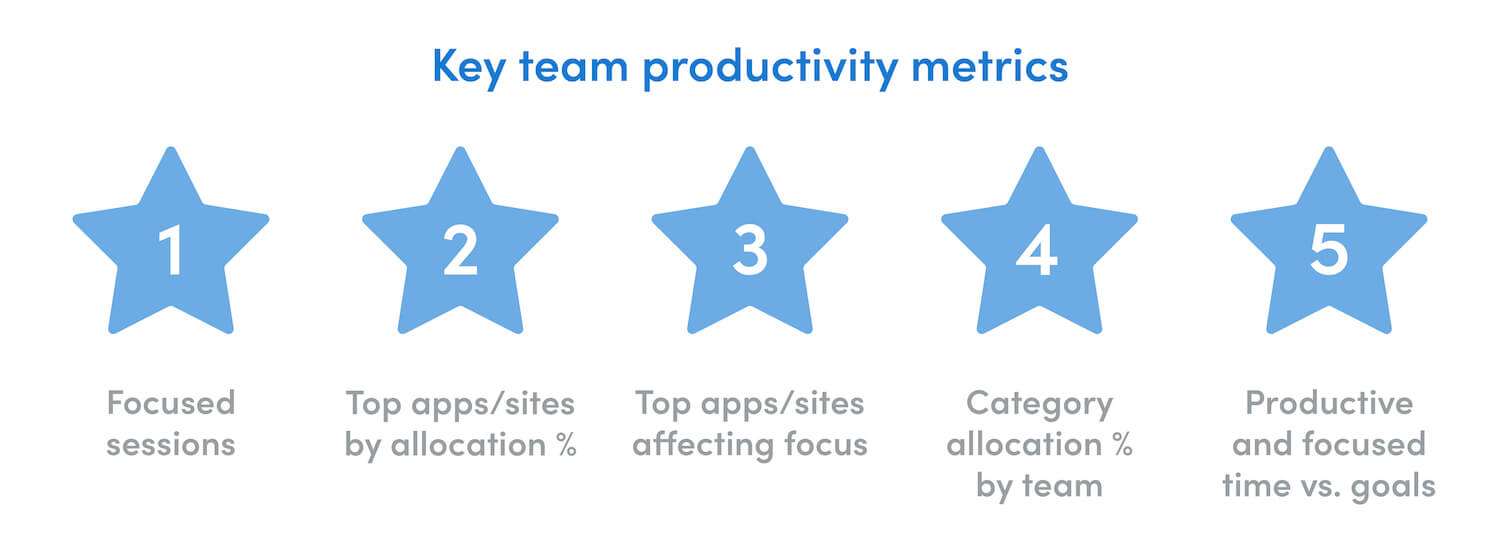
- Focused Sessions: This number sheds light on average session times in which employees are engaging in work without distraction, a state likely to yield more creative thinking, problem-solving and innovation.
- Top Applications/Sites by Allocation %: Understanding an organization’s top applications/sites provides useful intel when gauging whether tools are being fully utilized. By looking into the number of users who are active on each application, you can find out which applications are most helpful to your team’s performance and choose more technologies that increase productivity.
- Top Apps/Sites affecting Focus: This data helps you identify the top applications or sites that your team members are using regularly that might be affecting their focus. Even if these are work-related applications like Slack or Trello and not social media distractions, they can still break focus and reduce productivity. Understanding if and when they may be causing issues is important to driving positive interventions.
- Category allocation % by Team: Time management is essential for any employee and any team. This metric helps you understand where the team is spending its time. That’s useful for managers looking to understand potential bottlenecks, simplify business processes or find more insights into activity, strategy alignment, and basic task management.
- Productive & Focused Time vs. Goals: We talked about setting goals for your team earlier in this chapter. ActivTrak’s Productive & Focused Time vs. Goals table shows you a team’s performance in comparison to their specific goals (not just how their team numbers compare to organization averages).
Question: How do I compare my teams to one another?
Answer: When two teams are similar in function, it’s helpful to look at their data in detail side by side. Discrepancies provide managers with opportunities to discuss different approaches to work and management strategies that increase productivity.
Question: How can I find out if a certain team is overworked?
Answer: Burnout risk is as much a concern for entire teams as it is for individual employees. You can use the Workload Balance dashboard in ActivTrak to see how each team compares to the organization’s work and break habits, and determine if over-underutilization is a team-wide issue that requires further analysis. Want to see if a certain team is working as efficiently as possible? Do the same thing with the Work Efficiency dashboard.
Improve business processes and employee engagement with team productivity data
There’s a lot to track when it comes to team productivity. The good news is that keeping an eye on these metrics can do more than just increase productivity. It can also drive more open communication with team members, improve employee engagement and help ensure that teamwork never suffers because everyone onboard is doing their best work. Employee well-being should always be a top priority, and team productivity data is a great way to achieve that!
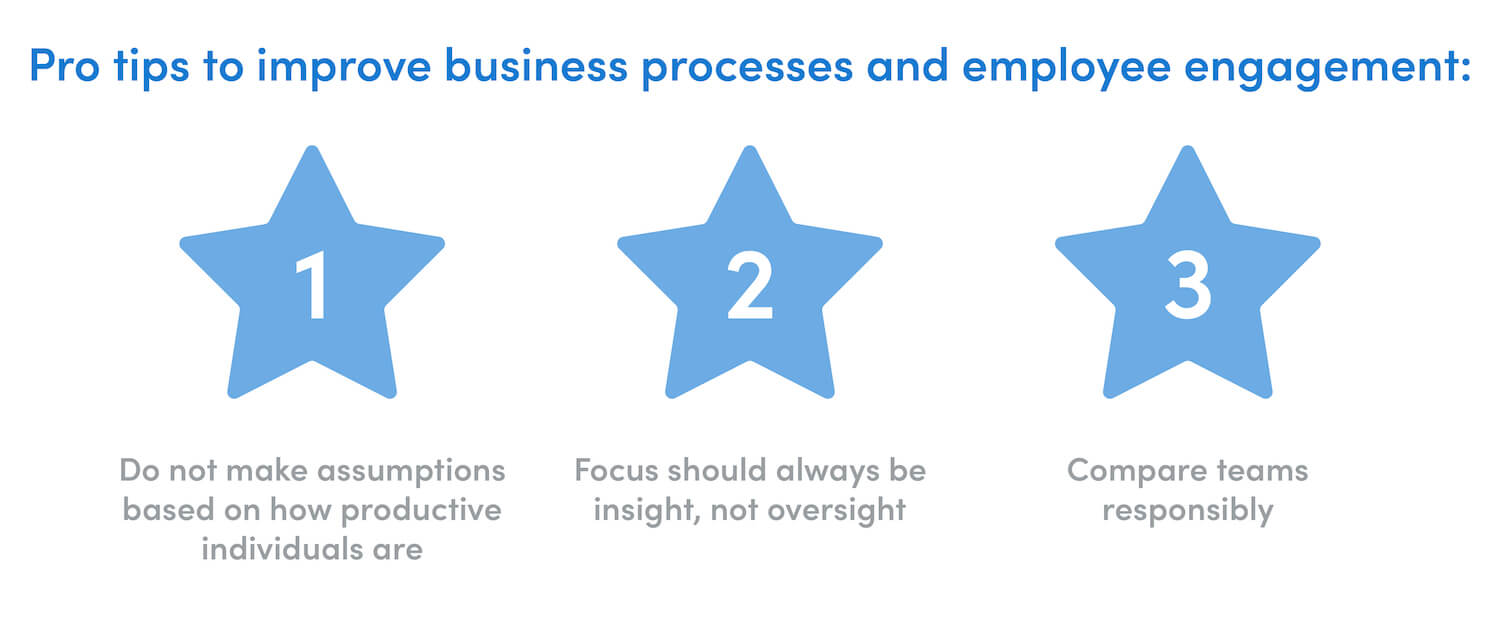 Pro Tips:
- Even though employee productivity is an integral part of team productivity, be careful not to make assumptions about team productivity based on how productive individuals are.
- Whether you’re tracking individuals or teams, the focus should always be insight, not oversight! Use the data to learn more about how your teams work and to drive positive changes — not to micromanage individual workflows.
- Compare teams responsibly!