What if you were only getting 87% of the work you’re paying for? For many organizations, that’s not a hypothetical. Based on our latest research on customer performance, companies lose the productivity equivalent of 130 workers for every 1,000 employees on payroll – based on an average of 6 hours 50 minutes of productive time per day. That’s $11.2 million1 in annual lost value. Most leaders don’t even know it’s happening.
As businesses navigate ongoing economic uncertainty, budget pressure and talent constraints, invisible performance gaps are quietly eroding margins across all industries. Our new Workforce Utilization Benchmarks Report details the scale and cost of untapped workforce capacity.
The Cost of Underperformance
We analyzed digital activity data from 304,083 employees across 5,619 organizations, using established productivity goals. Here’s what we found:
- 58% of workers fall below their established productivity targets
- The average productivity gap is 54 minutes per employee per day, equivalent to paying full salary for just 87% of output.
- Across all tracked organizations, these gaps add up to $2.86 billion in total annual productivity losses.
This isn’t just a matter of effort. It’s about systems, visibility and assumptions. While many leaders continue to operate under the belief that their teams function at full capacity, digital behavior tells a different story.
Why This Matters
Traditional workforce metrics don’t capture the hidden costs of underutilization. ActivTrak’s Financial Loss Analysis dashboard — leveraged to generate the Workforce Utilization Benchmarks Report — does. It combines digital productivity data with financial modeling to expose where opportunities leak out of the system and what they’re worth in dollars.
This matters for three key reasons:
- Underperformance can be widespread and systemic, or isolated to a few teams or individuals.
- Financial losses scale with organizational size, so even small inefficiencies balloon as businesses grow.
- Solutions are within reach, especially when leaders have the tools to quantify gaps and act strategically.
Key Findings
Underperformance Is the Norm
- Only 42% of staff meet their established productivity goals.
- The average organization achieves just 5 hrs 56 min of productive work per day, compared to an average goal of 6 hour 50 minutes
- This equates to $11.2M in lost productivity per 1,000 employees.
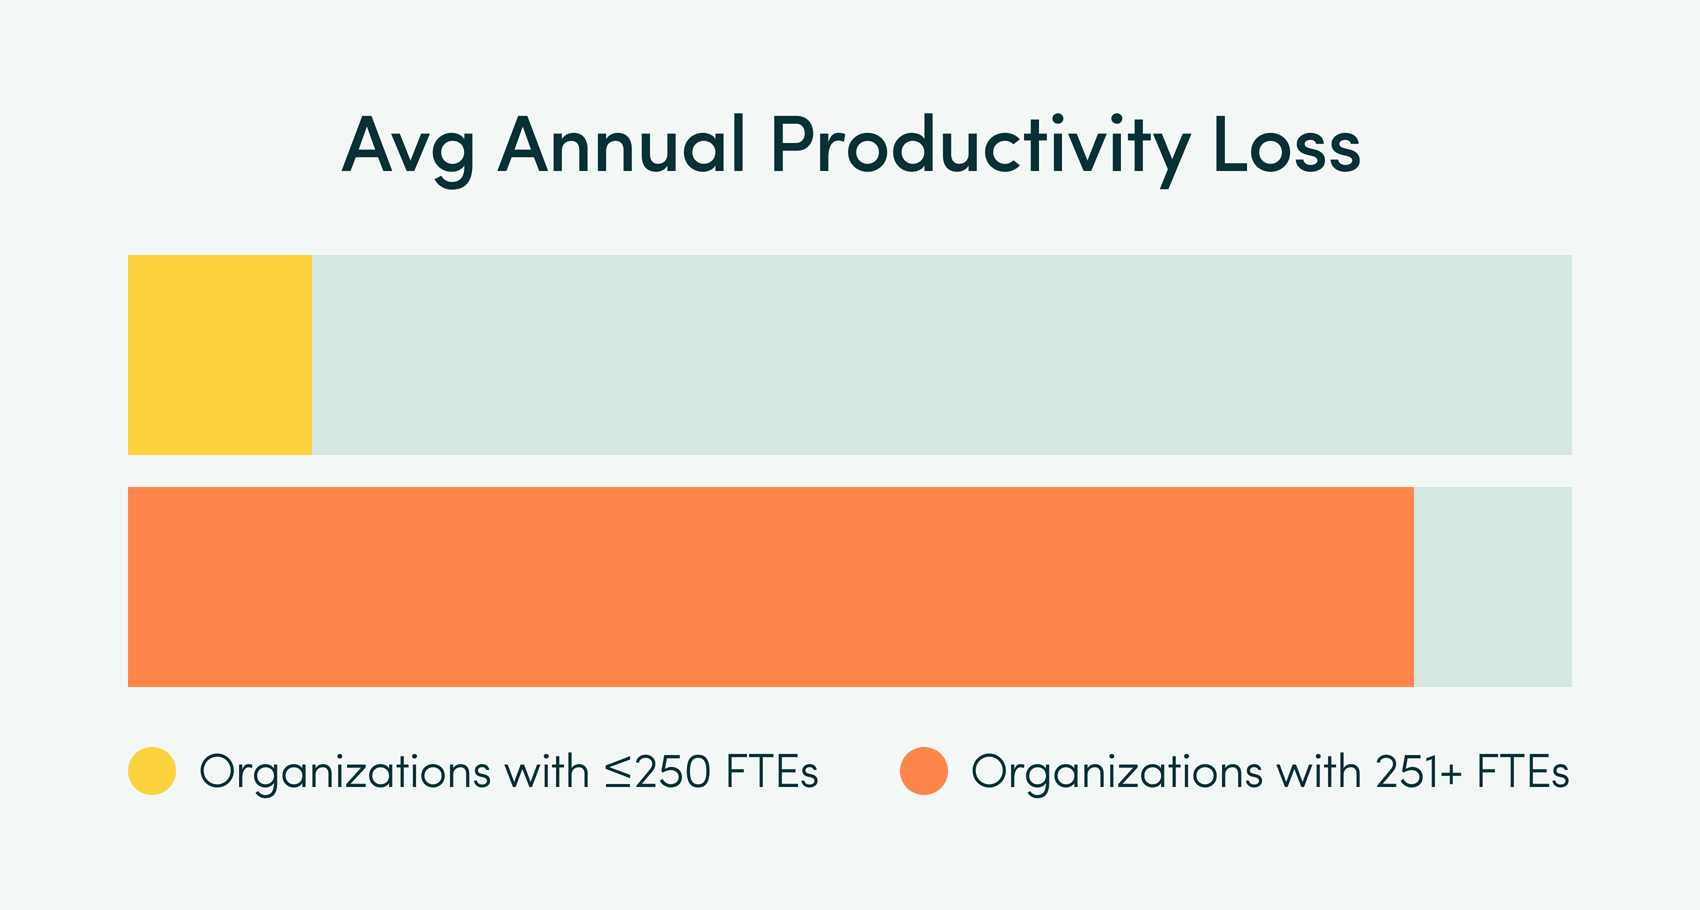
Bigger Organizations, Bigger Losses
While large enterprises (1,001+ employees) showed slightly better productivity rates, the stakes are exponentially higher. Twelve percent (12%) of organizations in our dataset had more than 250 employees, but accounted for 50% of total financial losses.
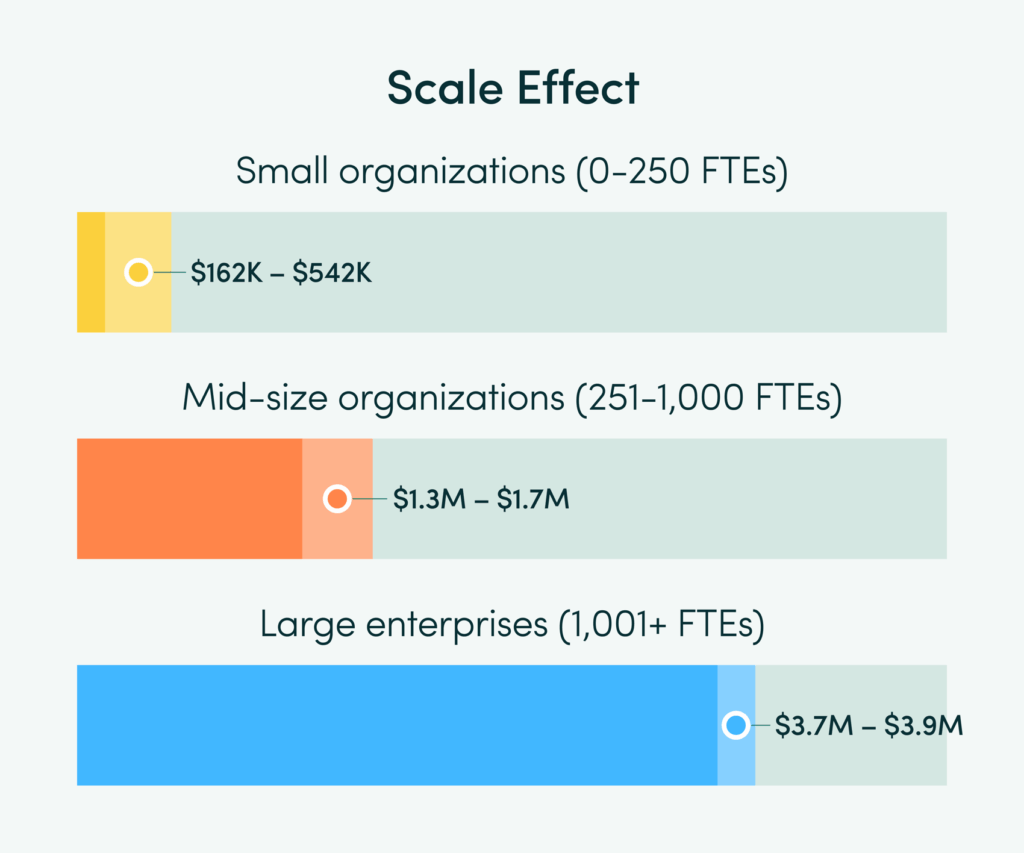
Annual cost per organization:
- Small (0–250 FTEs): $162K–$542K
- Mid-size (251–1,000 FTEs): $1.3M–$1.7M
- Large (1,001+ FTEs): $3.7M–$3.9M
Industry Highlights2
Some sectors struggle more than others:
- Lowest performing: Aerospace (19% untapped capacity, $1M annual productivity loss), Government/Public Sector (56 tracked workers below productivity goal) and Computer Hardware (71% underutilization rate).
- Highest performing: Logistics (41% below productivity goal, 9% untapped capacity), Insurance (51% below productivity goal, 10% untapped capacity) and Legal Services (53% below productivity goal, 11% untapped capacity).
Introducing the Financial Loss Dashboard
To turn these insights into action, we’ve built the Financial Loss Dashboard, available in select ActivTrak plans. It allows executives to:
- Quantify underutilized FTEs in financial terms
- Identify cost-saving opportunities by department, team or location
- Track waste reduction and measure improvement over time
- Make data-driven decisions about hiring, staffing and resource allocation
The dashboard provides immediate visibility and value for executive leaders. Whether you’re a CFO trying to protect margins or a CHRO looking to improve engagement, this dashboard turns vague concerns into concrete, actionable metrics.
From Awareness to Action
The opportunity ahead isn’t just diagnostic, it’s strategic. The path to improvement starts with visibility — identifying opportunities for improvement and using that information to drive meaningful action and long-term, sustainable change. You can’t manage what you can’t measure.
But measurement alone isn’t enough. Once you’ve quantified the productivity gaps, the next step is understanding where that lost time is going. With that visibility you can help employees refocus on high-value work. This is where ActivTrak’s Activity Alignment feature becomes a powerful tool.
Customer data shows that top performers typically allocate 70-80% of their time to core, high-value activities defined by their managers. With Activity Alignment, managers can see how much time employees actually spend on role-relevant, critical tasks. Using data-driven insights into time allocation, managers can deliver more targeted coaching to help employees optimize focus and improve performance.
The combination is powerful: the Financial Loss Analysis quantifies the cost of productivity gaps, while Activity Alignment provides the roadmap for closing them by aligning employee time with business priorities.
Want to see how your organization stacks up? Download the Workforce Utilization Benchmarks Report.
Log into your ActivTrak account and navigate to Insights > Financial Loss to explore the dashboard and start quantifying the ROI of better productivity.
1Based on annual mean wage per employee of $85,864 for included industries (U.S. Bureau of Labor Statistics May 2024 data released April 2, 2025)2All figures based on industry averages.