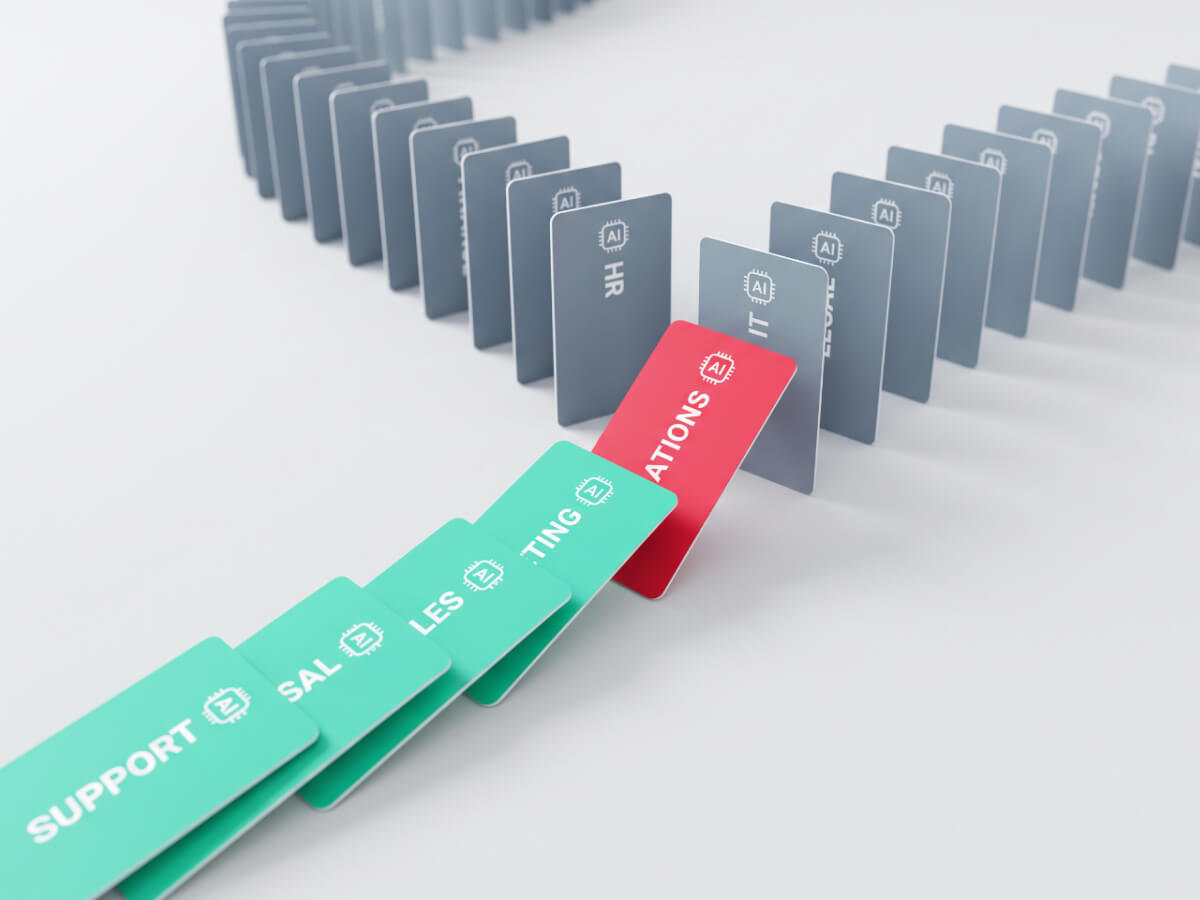



ActivTrak’s 2026 State of the Workplace found AI adoption reached 80% of employees and more than 95% of organizations across every size tier, yet what counts as strong performance still varies by size, industry and growth stage.
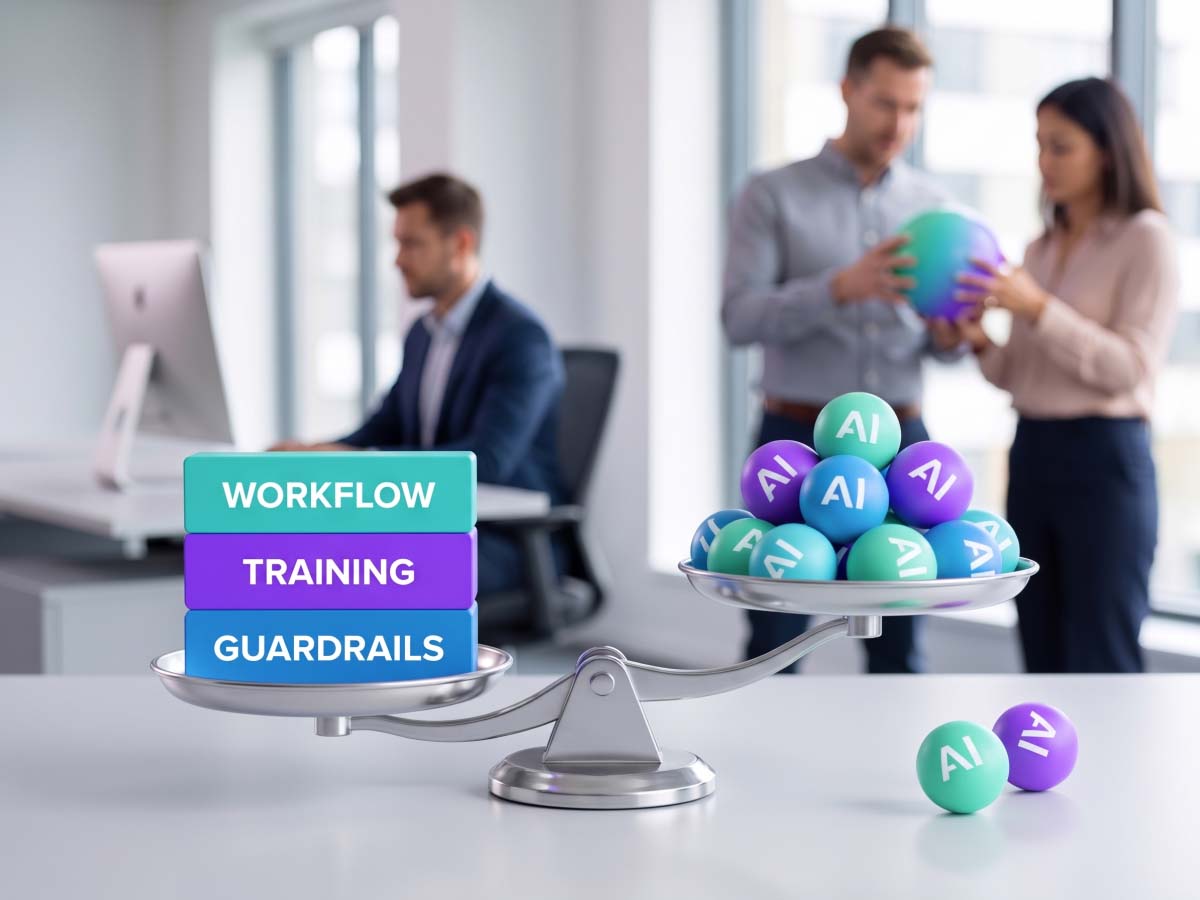
Executives benchmarking against an industry-wide average are measuring against a number never built for their organization. Good AI adoption requires a balanced fit between how much AI your teams use and what your stage of growth can support.
Why generic AI adoption benchmarks mislead leaders
Most AI maturity reports collapse thousands of companies into one adoption rate, then rank every organization against it. That hides more than it reveals.
Recent industry analysis found companies with $50 million to $100 million in revenue adopt AI as ‘strategic deployers’ at a rate of 65%, while companies under $10 million rarely exceed 25% adoption. A global study from SAS and IDC found nearly 70% of SMBs remain in experimental or opportunistic AI maturity stages. Unfortunately, these adoption headlines describe usage, not whether it’s producing outcomes.
What good AI adoption actually means
Good AI adoption isn’t about how many employees opened an AI tool last month. It’s whether that usage translates into outcomes leaders can measure: capacity redeployed, output improved, work restructured. ActivTrak’s Productivity Lab calls the space between adoption and outcomes the AI Measurement Gap: the distance between knowing employees use AI and knowing what that usage does to productivity, focus and capacity. Closing that gap is what separates maturity from activity.
Behavioral data that signals AI maturity
Behavioral data reveals patterns surveys miss. Across more than 443 million hours of workforce data, ActivTrak found employees who spend 7%-10% of total work hours in AI tools show the highest productivity of any usage tier, yet only 3% of users fall in that range. Maturity shows up in usage intensity and in whether AI redistributes work or just adds another layer on top.
How AI maturity differs by company size
Company size changes what AI maturity looks like, even when adoption converges. ActivTrak’s data shows that by early 2025, more than 95% of organizations across every size tier, from fewer than 50 employees to more than 1,000, had adopted AI in some form, and average AI usage as a share of total work hours settled into a narrow 0.6% to 0.7% range regardless of headcount.
Smaller organizations got there first, adopting two to 13 times faster than larger organizations in early 2023, before the gap closed by early 2025. What differs now isn’t whether a company adopted AI. It’s how deliberately that adoption is managed.
What good AI maturity looks like for smaller teams
For smaller organizations, good AI maturity looks like speed paired with intention: a handful of high-impact use cases, adopted quickly, with a clear owner tracking whether the tool is changing output.
Smaller teams don’t need visibility into which employees are using AI productively and which usage is just noise.
What good AI maturity looks like at enterprise scale
At enterprise scale, good AI maturity looks like consistency across a sprawling toolset. The average organization now runs seven AI tools, up from two just three years ago, and 83% use six or more. For a large enterprise, maturity means governing that sprawl: standardizing on tools that earn their place, retiring the ones that don’t and measuring impact consistently across every business unit.
Building an AI maturity benchmark that fits you
Instead of importing someone else’s adoption percentage, build an internal benchmark from your own behavioral data. Start with ActivTrak’s AI Adoption Maturity Blueprint and the accompanying AI adoption maturity model to map where your organization sits today, then define maturity 12 months out given your size and trajectory. The goal is about tracking movement toward the usage and outcomes that predict real gains.
Metrics that reflect your stage of growth
The right metrics change by stage. Smaller companies should track adoption depth within a few use cases and how quickly usage saves time on specific tasks.
Larger organizations should track tool consolidation, usage consistency across teams and the share of employees in that 7% to 10% productivity sweet spot. ActivTrak’s companion guide walks you through translating behavioral data into stage-specific benchmarks.
Your AI maturity benchmark is unique to your organization
Meaningful AI maturity is measured against your own organization, at your own stage of growth, using your own data. Leaders who build that internal benchmark, rather than borrowing someone else’s average, will know, with evidence, whether their AI investment is working.
See where your organization actually stands. ActivTrak’s AI Insights turns adoption into a clear, stage-appropriate benchmark built on behavioral data.
FAQ
What does ‘good’ AI adoption look like for a company at my size and growth stage?
‘Good’ AI adoption is the point where usage translates into measurable outcomes, not just a high percentage of employees opening a tool. It looks like intentional, tracked use aligned to your growth stage, not a match against an industry-wide average.
How should a leader set a realistic maturity target for the next 12 months at their size?
Realistic maturity targets should be based on your current stage, not a generic industry number. Identify where usage intensity and outcomes sit today, then define a realistic 12-month move: deeper adoption for smaller teams, better governance and consolidation for larger ones.
What metrics build an internal AI maturity benchmark instead of borrowing an external one?
Start with your own behavioral data: usage intensity per employee, time saved on specific tasks, tool consolidation and the share of your workforce in the productivity sweet spot, tracked over time against your own baseline.
Why does applying an industry-average adoption rate to a smaller company give a misleading read?
An industry-average rate blends companies of vastly different sizes and resources into one figure. Applying it to a smaller company obscures whether its usage, outcomes and growth trajectory are actually healthy for its stage.
How does AI maturity differ between SMBs, mid-market and enterprise organizations?
SMBs move fastest on individual use cases but often stay in experimental stages longer. Mid-market companies approach enterprise-level adoption as revenue scales. Enterprises manage maturity mainly by governing tool sprawl across large, complex teams.