
(This is part five of an ongoing series. Check here for weekly updates.)
In part four of this series, we looked at the financial impacts of under-challenged employees. However, chronic underutilization isn’t the only threat to ROI. Overutilization and burnout risk also negatively impact business, making these important metrics to watch.
While the latest data suggests burnout risk is down, it’s not gone. Work patterns continue to shift quickly and burnout levels can change just as fast.
To help you stay ahead, let’s walk through how to use your ActivTrak dashboards to answer the two most important burnout questions right now:
- How many employees are in a healthy utilization range?
- How many are at risk of burnout?
(If you’re new to ActivTrak, sign up for a free trial to collect data and access Professional features for 14 days.)
1. How many employees are in the healthy range?
The finding: Most employees now have healthy work patterns, and that number is growing.
Healthy utilization reached a three-year high, with 75% of employees maintaining balance. This means most team members work at a pace that keeps them productive without feeling overworked or under-challenged. They have enough to do to stay engaged, but not so much the work becomes overwhelming. This is a strong signal of progress, but it’s also a moment to stay vigilant. As AI changes how work happens, utilization may shift quickly in either direction.
Why it matters: Balanced workloads drive both performance and well-being.
Balanced workloads directly impact how employees perform. When work is aligned with an employee’s capacity and skills, both productivity and well-being improve. Research shows employees are 13% more productive when they’re happy, with balance playing a key role. Regularly monitoring utilization helps you maintain that balance so employees stay engaged and productive. Even small changes in workload, priorities or team structure can move employees out of the healthy range.
How to compare your data: Use ActivTrak’s Workload Balance dashboard (available on the Professional plan):
- Navigate to Productivity Optimization > Workload Balance (or Insights > Workload Balance if you’re using legacy navigation).
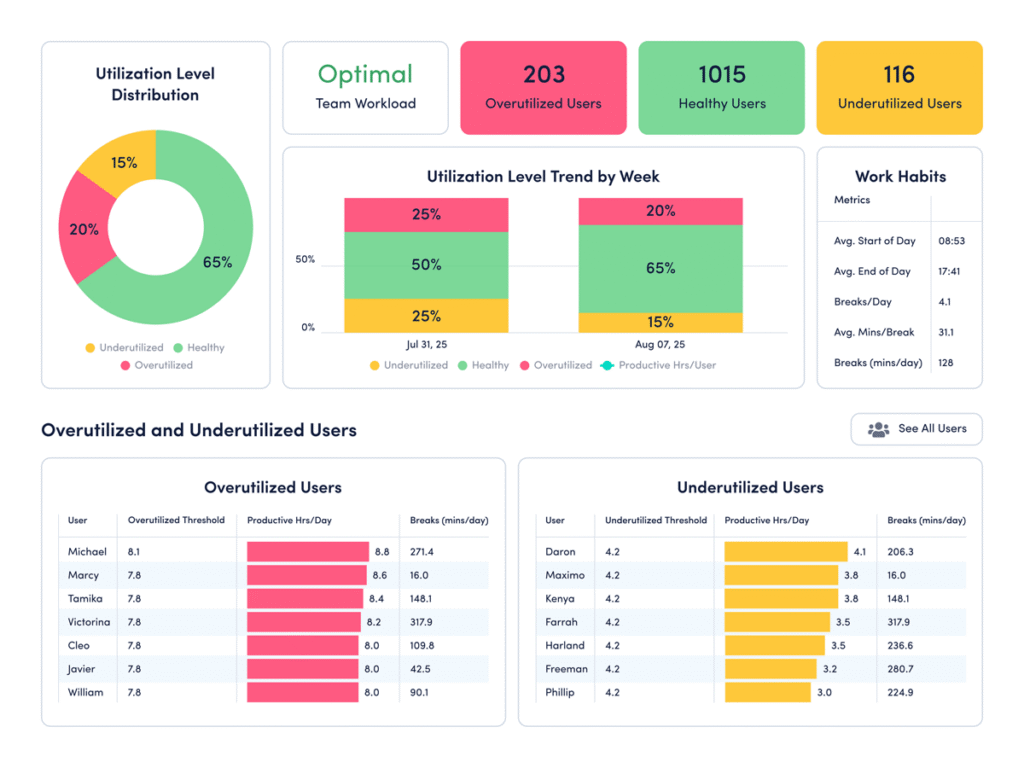
How to interpret the data:
- If 75% or more are in the healthy range: Congratulations! Most of your employees are working at a sustainable pace, which supports both productivity and well-being. The next step is to maintain it. Watch for early signs of imbalance — shifts in workloads, rising overtime or uneven distribution across teams — and address them before they grow. The key is to treat this as an achievement to maintain rather than a fixed win.
- If less than 70% are in the healthy range: A significant portion of your workforce may be either overextended or underutilized. This often points to uneven workload distribution or unclear priorities. Look for where the imbalance is happening. Are some teams overloaded while others have capacity? Rebalancing work and clarifying expectations may help move more employees into a healthy range.
- If 70-74% are in the healthy range: You’re close to the current benchmark. However, the right balance varies by industry, role and work model. The next step is to refine. Identify where utilization is strongest and where it falls short, then adjust workloads to create more consistency across teams.
2. How many employees are at risk of burnout?
The finding: Burnout risk declined, but hasn’t disappeared.
Overutilized employees — those who consistently work long hours, skip breaks and carry heavy workloads — dropped 42% between 2023 and 2025. As a result, burnout risk declined 22%. Just 5% of employees are now at risk. While the overall trend is positive, it still represents a segment of the workforce operating under sustained pressure. Leaders must pay attention to any employees who spend most of the year working above healthy capacity levels.
Why it matters: Burnout impacts productivity, retention and long-term performance.
A lower burnout rate is a step in the right direction, but the broader picture is more complex. In Microsoft and LinkedIn’s annual work trend report, 68% of employees say they still struggle with the pace and volume of work. Much of this pressure comes from “work about work” — time spent in meetings, email and messaging instead of meaningful tasks — indicating leaders must keep a close eye on burnout scores. Without consistent monitoring, burnout can rise quickly as new tools, expectations and workflows reshape how work gets done.
How to compare your data: Use ActivTrak’s Workload Balance dashboard (available on the Professional plan):
- Navigate to Productivity Optimization > Workload Balance (or Insights > Workload Balance if you’re using legacy navigation).
- Adjust the Activity date to “Last 365 Days” to see how many employees are chronically overutilized and at risk of burnout.
How to interpret the data:
- If more than 5% of employees are overutilized: Burnout risk may be rising across your organization. A higher percentage means more employees consistently work above healthy capacity levels, often for extended periods. This pattern is difficult to sustain and leads to fatigue, disengagement and turnover. Look closely at where overutilization is concentrated and take steps to rebalance workloads, adjust expectations and ensure employees have time to recharge.
- If fewer than 5% of employees are overutilized: This indicates most of your employees have a healthy balance at work, which supports long-term performance and well-being. The next step is to maintain that balance. Keep an eye on changes in work hours or the number of workday breaks to ensure this number stays low as business demands evolve.
- If 5% of employees are overutilized: You’re aligned with the current benchmark. This is a strong position, but not a signal to stand still. Identify which teams or roles are still at risk and address the underlying causes. Even small increases in overutilization can compound over time, and ongoing monitoring is key to keeping burnout risk in check.
Stay tuned for more State of the Workplace benchmarking insights
Workload balance plays a direct role in how your organization performs. When employees operate within a healthy range, productivity improves, engagement rises and work becomes more sustainable.
But balance doesn’t happen by accident. It requires ongoing visibility into how work is distributed and how employees manage day-to-day workloads. The organizations that stay ahead are the ones that monitor these trends continuously — and act before small shifts turn into larger risks.
Remember: The benchmarks above reflect today’s environment are not a fixed baseline. Even small shifts in your ActivTrak data may signal changes worth investigating early.
Looking for more insights? We’ll continue exploring State of the Workplace findings in the next part of this series, where we look at how weekend work is reshaping the modern workweek.
Did you miss part four? Read it here.