
(This is part four of an ongoing series. Check here for weekly updates.)
In part three of this series, we showed you how to compare your ActivTrak data to collaboration and multitasking benchmarks. Next, we look at one of the most surprising findings in ActivTrak’s 2026 State of the Workplace report — the rise of chronic underutilization.
For years, leaders worried about burnout. Now, organizations face a different issue. As AI usage increases and workloads are redistributed, are employees underchallenged?
It’s an important question to answer. When employees regularly work below their potential, it creates financial risks for the business. The good news? ActivTrak makes it easy to spot them early by answering two critical questions:
- How many employees are in an underutilized state right now?
- How much is that untapped capacity costing you?
Ready to get started? Let’s dive in.
(If you’re new to ActivTrak, sign up for a free trial to collect data and access Professional features for 14 days.)
1. How many employees are in an underutilized state right now?
The finding: Underutilization is declining — but it still affects nearly 1 in 5 employees.
Underutilization dropped to 18%, down from 22% in 2023. This is a win. It means fewer employees are working below capacity. But this isn’t a metric to set and forget. As AI adoption changes how work gets done, it’s important to monitor this number quarterly.
Why it matters: Left unchecked, underutilization leads to disengagement.
When employees aren’t fully challenged, the impact builds over time. Skills go underused, motivation dips and work feels less meaningful. This often leads to disengagement — and eventually, turnover and attrition. At an organizational level, the effects show up as lower productivity, missed opportunities and declining team morale. Left unchecked, underutilization doesn’t just waste employee hours — it weakens performance across the business.
How to compare your data: Use ActivTrak’s Workload Balance dashboard (available on the Professional plan):
- Navigate to Productivity Optimization > Workload Balance (or Insights > Workload Balance if you’re using legacy navigation).
- Change the Activity Date to “Last 90 Days.”
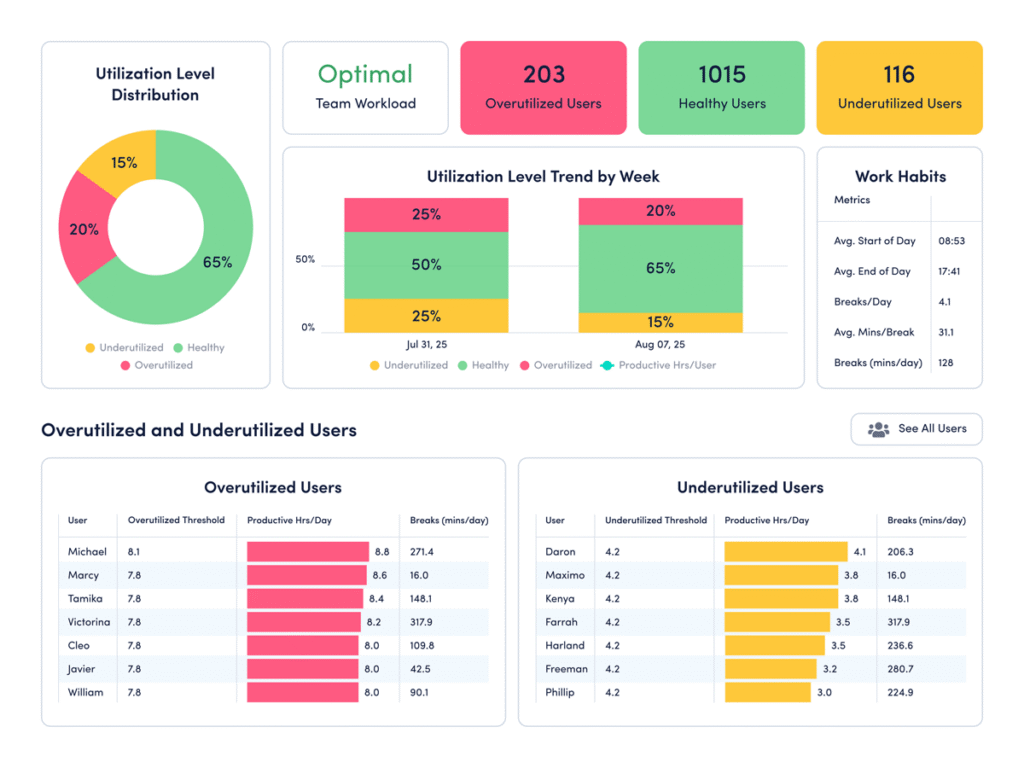
How to interpret the data:
- If significantly more than 18% of employees are underutilized: This indicates the number of under-challenged employees at your organization is above the current benchmark. Look for opportunities to close the gap. Do you need to balance workloads? Clarify priorities? Match employees to the proper roles? Find ways to put employee skills to use, then check again in a month.
- If significantly less than 18% of employees are underutilized: This suggests the majority of team members are currently engaged and well-balanced, especially if you have a high number of employees in the green “healthy” range. But it’s worth a conversation to confirm current workloads are sustainable. Balance is key.
- If 17-20% of employees are underutilized: You’re operating close to the current benchmark. However, it’s important to note that the current benchmark is only a general guidepost — and there’s always room for improvement. Identify which teams fall above or below this range and understand what’s driving the difference. Small shifts in workload distribution or role clarity often lead to meaningful improvements in engagement and output.
2. How much could that untapped capacity cost you?
The finding: While overall underutilization is down, the number of chronically under-challenged employees is rising.
Nearly a quarter of employees across industries are chronically underutilized. This means they spend most of the year with extra hours to fill. This group has grown from 19% in 2023 to 23% today. Unlike short-term dips in workload, this reflects a sustained gap between what employees could contribute and what they’re actually doing.
Why it matters: Chronic underutilization poses a real financial risk.
Chronic underutilization isn’t just a productivity issue. When employees consistently operate below capacity, organizations pay for unused time. And the impact compounds. Research from McKinsey & Company shows the attrition tied to disengagement can cost a median-size S&P 500 company between $228 million and $355 million a year in lost productivity. What starts as unused bandwidth often leads to turnover, rehiring costs and missed growth opportunities.
How to analyze your financial loss risk: Use ActivTrak’s Workforce Utilization dashboard (available on Professional plan):
- Navigate to Executive Summaries > Workforce Utilization (or Insights > Financial Loss if you’re using legacy navigation).
- (Note: To first see how many employees are chronically underutilized, follow the steps in section 2 here.)
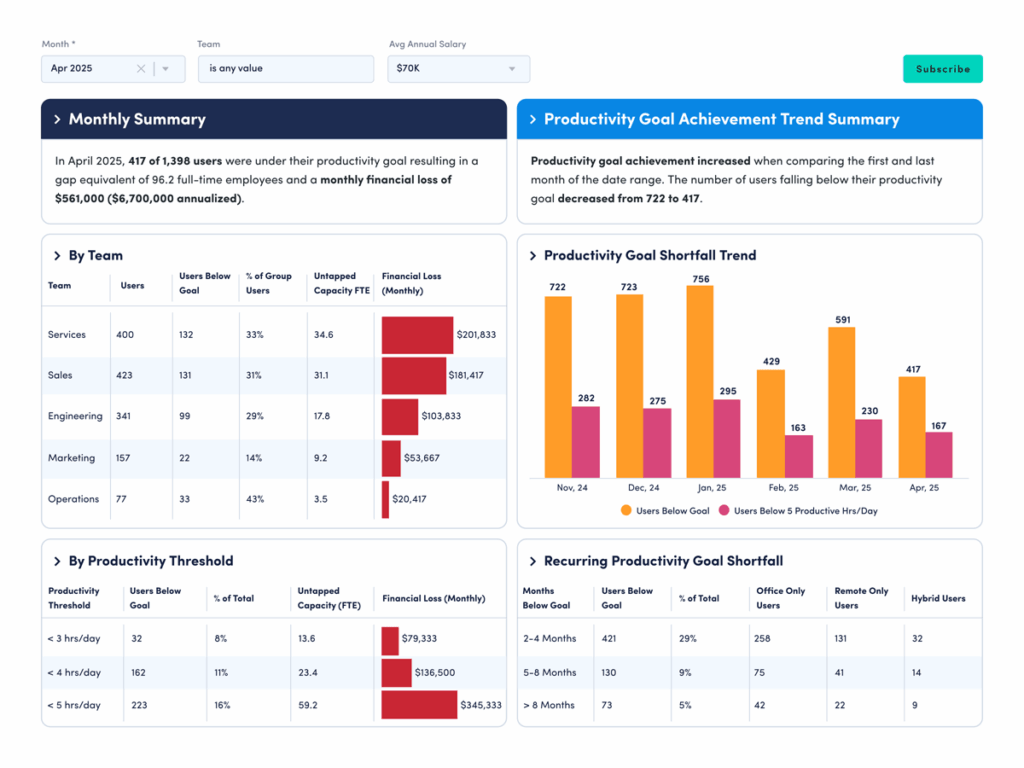
How to interpret the data: The Workforce Utilization dashboard quantifies untapped employee capacity in real dollars. This lets you see how much money your organization is leaving on the table from productivity losses. For example, if your average annual salary is $70,000 and 29% of your employees work below capacity, you’re looking at a monthly financial loss of $561,000 — or $6.7 million annually.
To analyze your current potential financial losses, look at:
- Monthly Financial Loss by Team to see which groups contribute most to lost productivity.
- Monthly Financial Loss by Productivity Threshold to see how much loss comes from employees working below expected capacity levels.
- Recurring Productivity Goal Shortfall to understand how often employees consistently miss utilization targets over time.
Stay tuned for more State of the Workplace benchmarking insights
Underutilization isn’t always obvious, and it doesn’t create the same urgency as overworked teams. But the impact is just as real. When employees aren’t fully engaged, productivity slows, costs rise and opportunities slip through the cracks.
The good news? These patterns are measurable. The dashboards above make it easy to identify unused capacity, allowing you to take action before it affects performance and ROI. It’s another way to make data-driven decisions that drive measurable business impact.
And there’s still more to come. We’ll continue exploring State of the Workplace findings in the next part of this series, where we look at the latest trends in overutilization and burnout risk.
Did you miss part three? Read it here.