You’ve collected insights all year. Now it’s time to use them. While many business leaders lean on last year’s budget to guide decisions, you have something better — real workforce data.
This guide explains how to turn your 2025 ActivTrak data into smart, practical steps for 2026 planning. You’ll learn how to:
- Pull the right reports for year-end reviews
- Test whether your 2025 changes worked
- Package key findings to share with stakeholders
- Set realistic, data-backed goals for 2026
Ready to get started? Let’s dive in.
Step 1: Pull your reports
Before planning for 2026, you need a clear picture of how teams worked in 2025. Start by reviewing reports in three key areas — technology, workloads and top users.
1. Technology Usage
(Available on the Professional plan)
ActivTrak’s Technology Usage (Technology Utilization) report shows how employees used your software in 2025 — so you know exactly what changes to make for next year. To access it, go to Insights > Technology Usage.
What to look for:
- Apps with low usage — few or no active users, or less than 5 hours/month
- Apps with high usage — tools teams used as expected
- Unsanctioned apps — tools people used even though they’re not IT-approved
How to use the data:
- Build a list of apps with low usage to cancel or downgrade before 2026 renewals.
- Determine if people followed your technology guidelines and AI policies — or if it’s time to tighten them.
- Review any unsanctioned apps people frequently use and consider adding them to your official tech stack.
Real-world example:
Preferred Rate Mortgage uses ActivTrak to understand what subscriptions the company is enrolled in, how often they’re used and whether they justify renewal costs. Chris Lekousis, VP of Operations, says these regular reviews help the company reduce waste:
“ActivTrak shows us whether we use the thousands of dollars we spend monthly on various software tools efficiently, helping us make smarter vendor decisions and eliminate unused subscriptions.”
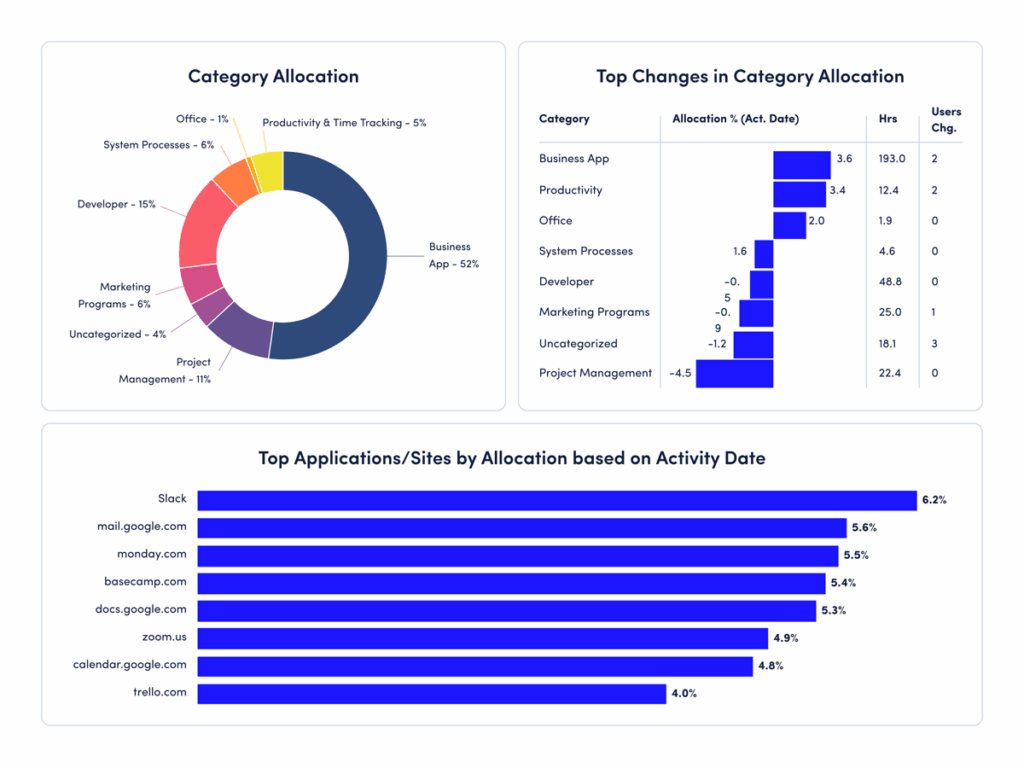
2. Top Websites and Top Applications
(Available on all plans)
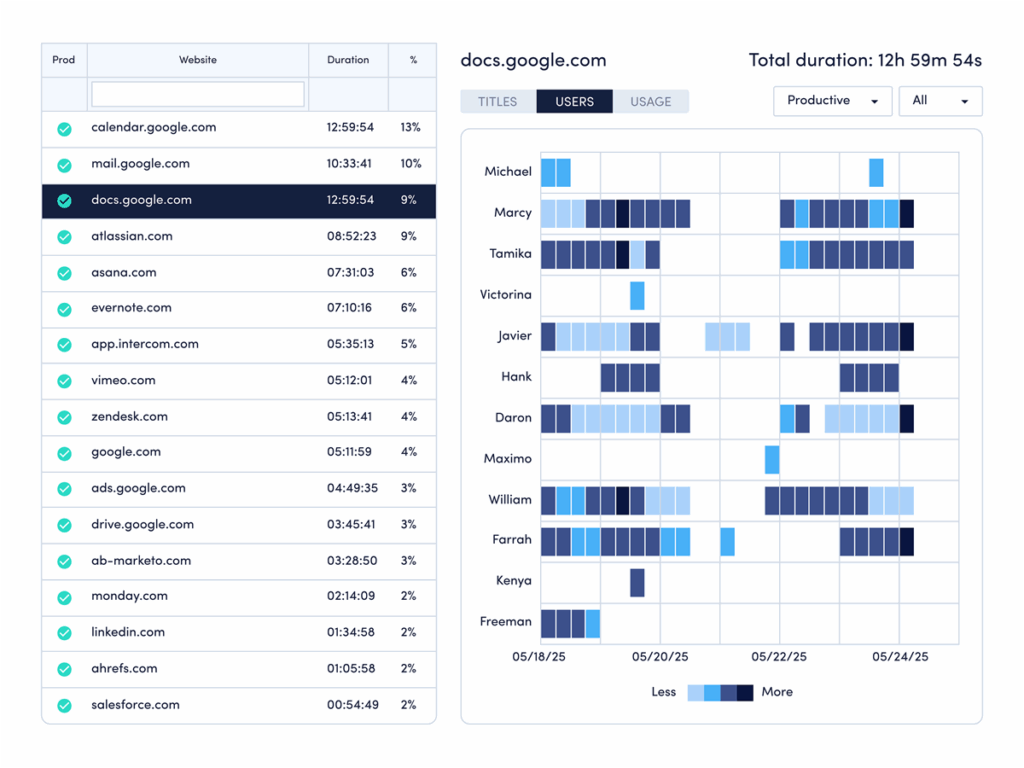
ActivTrak’s Top Websites (Website Usage) and Top Applications (Application Usage) reports paint a detailed picture of where employees spent their time in 2025 — showing you which tools to streamline, reinforce or retire in 2026. Access them by going to Live Reports > Top Websites and Live Reports > Top Applications.
What to look for:
- Most-used sites — websites frequently accessed across teams
- Key differences — how usage varied across teams and departments
- Website types — filter by productive, unproductive and undefined categories to see which sites support work and which pull attention away
How to use the data:
- Look for opportunities to consolidate similar tools, save money and improve cross-team collaboration.
- Build simple training or communication plans to boost adoption of essential tools.
3. Workload Balance
(Available on the Professional plan)
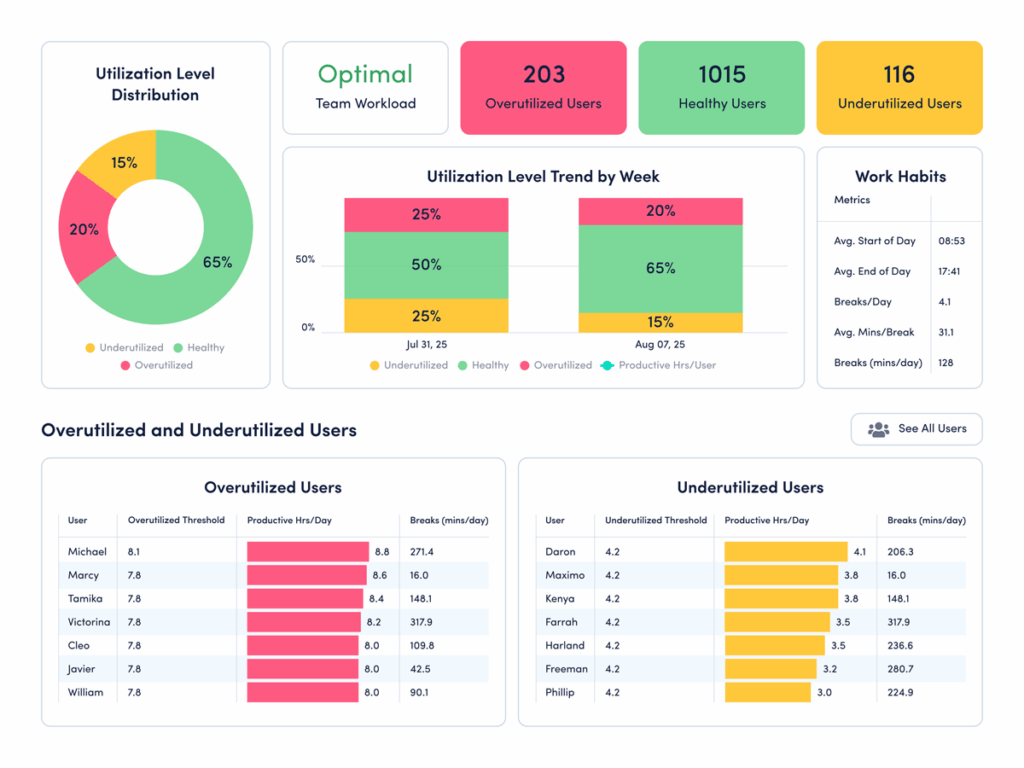
ActivTrak’s Workload Balance dashboard brings clarity to who’s overworked or underworked — and how to ensure proper distribution for the year ahead. To access it, go to Insights > Workload Balance.
What to look for:
- Burnout risk — teams that chronically worked long hours in 2025
- Underutilization — teams that frequently had extra capacity throughout the year
How to use the data:
- Identify overworked teams and flag them for intervention in 2026.
- Look for opportunities to shift tasks from frequently overwhelmed groups to teams with more availability.
Real-world example:
For one ActivTrak customer, Workload Balance revealed significant imbalances across the organization’s 2,500 employees. Some teams were at risk of burnout while others had untapped capacity. By reallocating work instead of adding headcount, leadership avoided nearly $5.25 million in annualized hiring costs.
4. Top Users and Groups
(Available on all plans)
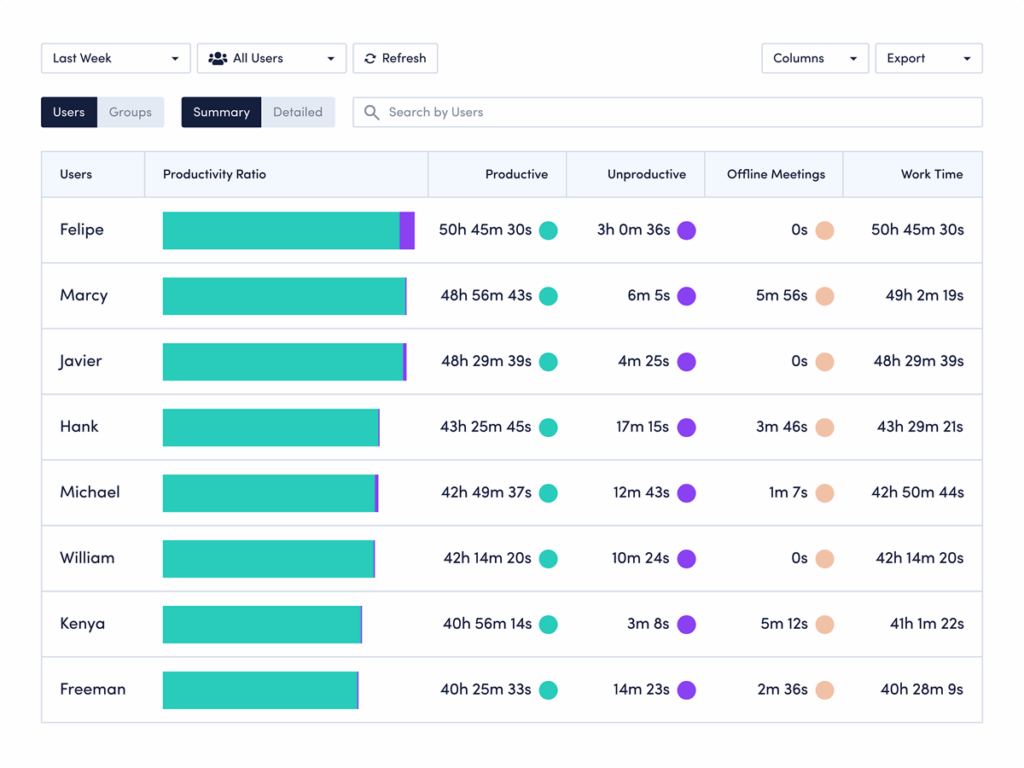
Top Users and Groups helps you spot patterns in how people worked in 2025 — a great resource for deciding how to support, rebalance and plan smarter coverage in 2026. To access it, go to Live Reports > Top Users & Groups.
What to look for:
- Users who stand out — people with much higher or lower productivity patterns than the rest of the team
- Unusual work habits — employees who regularly worked long hours or outside of standard schedules
- Sudden shifts in behavior — big changes in screen time or activity levels that hint at workload issues or support needs
How to use the data:
- Use the outliers to guide coaching plans so managers know who needs support and who’s ready for more advanced work in 2026.
- Look for overtime patterns that indicate coverage issues and use those insights to adjust staffing or schedules.
- Note any surprising changes in behavior and check in with those employees — find out what changed and what they need for the year ahead.
Step 2: Test what actually worked
Many organizations make changes throughout the year — then move on without checking the impact. ActivTrak shows you what worked. Before you finalize 2026 plans, review your change management data for two or three big transitions your workforce faced in 2025.
If you’re on the Essentials or Essentials Plus Plan:
- Pick a change you made in 2025, such as a new policy or team restructure.
- Navigate to Live Reports > Top Users & Groups.
- Review your productive vs unproductive hours for the three months preceding the transition. Then compare it to the same data for three months following the transition.
If you’re on the Professional Plan:
- Pick a change you made in 2025, such as a new policy or team restructure.
- Navigate to Insights > Impact.
- Follow these instructions to create segments for a before-and-after comparison using ActivTrak’s Impact Analysis.
- Review the results to determine if you should scale or make adjustments in 2026.
Need help deciding what to test? Try one (or all) of the following common scenarios.
Did your RTO policy work?
Many companies required employees to return to the office in 2025. If yours did, this is a perfect opportunity to test the impact with ActivTrak. Compare work patterns before and after the change:
- Are teams more or less productive?
- Do they take more breaks?
- Do they stay focused?
- Do they work longer or shorter hours?
These insights help you see how your new policy impacts productivity. For example: If screen time stayed flat but focus time dropped, that’s a strong indication of workplace interruptions. In this instance, you might consider shifting to a hybrid schedule that allows employees to work in distraction-free remote environments two or three days a week.
This method works equally well for measuring the impact of four-day workweeks, unlimited PTO and other flexible work policies.
Did your new AI tool deliver ROI?
Workplace AI usage increased 107% in 2025, making this a great time to see how these tools impact work behaviors. If you rolled out a new AI tool in 2025, use ActivTrak to see if it actually improved productivity.
First, compare your pilot group to employees who did not use the tool:
- Did productive time increase?
- Are teams collaborating more? Or less?
- Are workflows faster or slower?
- Did new users spend less time switching between apps?
Then use your findings to decide if you should expand the rollout, adjust your training plan or retire the tool before renewal season.
Is your new process effective?
Did HR update new-hire onboarding in 2025? Did one of your teams update important workflows? Now’s the time to see how well those changes worked. Compare a group of employees using your new process with a team still following the old one:
- Did new employees achieve productivity goals faster?
- Did teams spend less time reworking tasks?
- Did productive hours rise or fall?
Use these results to refine, adjust or expand successful processes in 2026. And if your company faced other big transitions in 2025, review those too. The goal is to understand what worked (and what didn’t) and use that data to guide future plans.
Step 3: Present your findings
Once you review your data and identify key takeaways, package them into a succinct report to share with other leaders.
When sharing with executives, focus on metrics most likely to move the needle in 2026:
- Reduce technology spend by trimming unused licenses, consolidating overlapping tools and retiring apps with low adoption.
- Reallocate capacity by shifting work away from overloaded teams to those with more bandwidth.
- Prevent burnout before it starts by coaching employees and redistributing work from overworked teams to ones with extra capacity.
- Strengthen productivity by doubling down on tools and processes that delivered gains in 2025.
- Streamline operations by removing steps, handoffs or processes that slowed teams down.
When sharing with managers, focus on opportunities to boost team performance in 2026:
- Celebrate team wins by highlighting progress on focus time, collaboration and healthy work habits.
- Spot coaching needs early by reviewing longer-than-usual hours or other surprises that signal a need for more support.
- Strengthen team habits by reinforcing tools and practices that helped people work more efficiently in 2025.
- Address workload imbalances by shifting tasks, reassigning projects or adjusting schedules for employees who carried too much.
- Improve tech adoption by providing training and setting clear expectations for usage.
- Set realistic team goals by rooting 2026 targets in their actual 2025 performance patterns.
Step 4: Build your 2026 strategy
Once you review your dashboards and see what worked in 2025, the final step is turning those insights into next year’s plan. Use what you learned about technology usage, workloads and team behaviors to make confident choices on what to scale, adjust and rethink for 2026.
Double down on:
- Initiatives that improved productivity. Expand them to more teams or make them part of your standard workflows.
- Policies that helped work-life balance. Keep these in place and look for simple ways to reinforce them.
- Tools that had strong adoption. Build out training, best practices or integrations to help more teams make the most of them.
Fix or adjust:
- Policies that led to overworked teams. Update expectations, rebalance workloads or adjust schedules to prevent burnout (and retain high performers).
- Tools that had low adoption. Decide if people need more training — or if it’s time to retire unused apps.
- Teams that were regularly overextended. Shift tasks, add support or adjust staffing plans to ensure evenly distributed workloads.
Plan to measure:
- New initiatives. Start with small pilots to learn what works before doing company-wide rollouts.
- Alternative solutions. Try new ideas for collaboration, schedules and other challenges that emerged in your 2025 data review.
- Big changes. Use Impact Analysis throughout 2026 to track changes and prevent year-end surprises.
Use your data to:
- Set realistic 2026 targets. Build goals based on actual work patterns, not assumptions.
- Customize team goals. Match workload, capacity and technology usage instead of providing a single benchmark for everyone.
- Plan regular check-ins. Stay aligned throughout the year to adjust early when something shifts.
And be sure to document your 2025 productivity playbook — what worked, what didn’t and what you want to improve. This will serve as your quick-reference guide for smart, confident decisions in 2026.
Look ahead with confidence
Your 2025 data offers a clear roadmap for taking teams to next-level productivity in 2026. And that’s not an empty promise. Organizations like yours use ActivTrak data to:
- Recapture 12,000 hours of lost productivity each month
- Uncover $600,000 in labor savings
- Recover $500,000 in billing reconciliation …
And the list goes on. Bottom line: Get into the habit of consulting your workforce data regularly, and the results are bound to follow.
Want more tips like this? Subscribe to our LinkedIn newsletter for the latest insights on using workforce data to boost productivity and drive growth.