Executives today face a fundamental challenge: Labor is their biggest investment, yet many still lack a clear understanding of how work actually gets done. When organizations rely on instinct instead of insight, they struggle to spot productivity gaps, assess capacity or respond quickly to operational risks. In an environment where margins are tight and expectations are high, operating without visibility is financially detrimental.
In response, leaders are turning to modern workforce management tools that make work measurable, comparable and actionable. Workforce analytics reports give executives the clarity they need to understand how their teams spend their time, where performance is strong and where inefficiencies quietly erode profitability. When analyzed together, these reports offer a strategic foundation for making faster, smarter decisions that directly impact growth.
Summary/TLDR: Workforce analytics reports give executives the visibility needed to understand how work happens, where productivity breaks down and how engagement and operational health impact profitability. These four reports — productivity, time tracking, engagement and operational — equip leaders with data-driven insights to optimize capacity, reduce waste and build a more productive, resilient workforce.
Why workforce analytics reports matter to CEOs and managers
Improving workforce performance requires more than tracking activities — it requires a holistic view of productivity, engagement and workflows across the entire organization. The most actionable reports highlight the connection between employee behavior and business outcomes, helping executives identify blind spots and move from reactive troubleshooting to proactive, data-informed leadership.
According to Gallup, business units in the top quartile of employee engagement achieve 18% higher productivity and 23% higher profitability than those in the bottom quartile. These findings underscore the symbiotic relationship between engagement, output and financial performance. Without insight into the signals behind engagement and productivity, leaders risk missing early indicators of underperformance.
The stakes are even higher when you consider that disengaged employees cost U.S. companies an estimated $450 billion per year in lost productivity, according to The Conference Board. This loss is rarely visible in traditional reporting; However, it becomes clear through the right analytics framework.
By embracing data-driven workforce intelligence and surfacing the metrics that matter, executives uncover hidden inefficiencies, improve alignment and optimize productivity across teams.
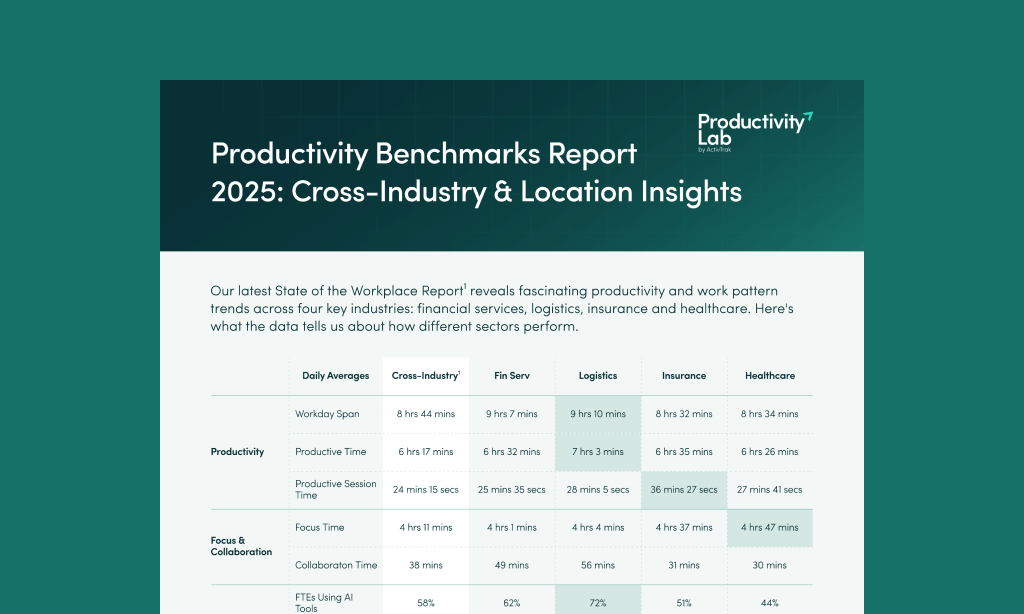
1. The employee productivity report: How work drives profit
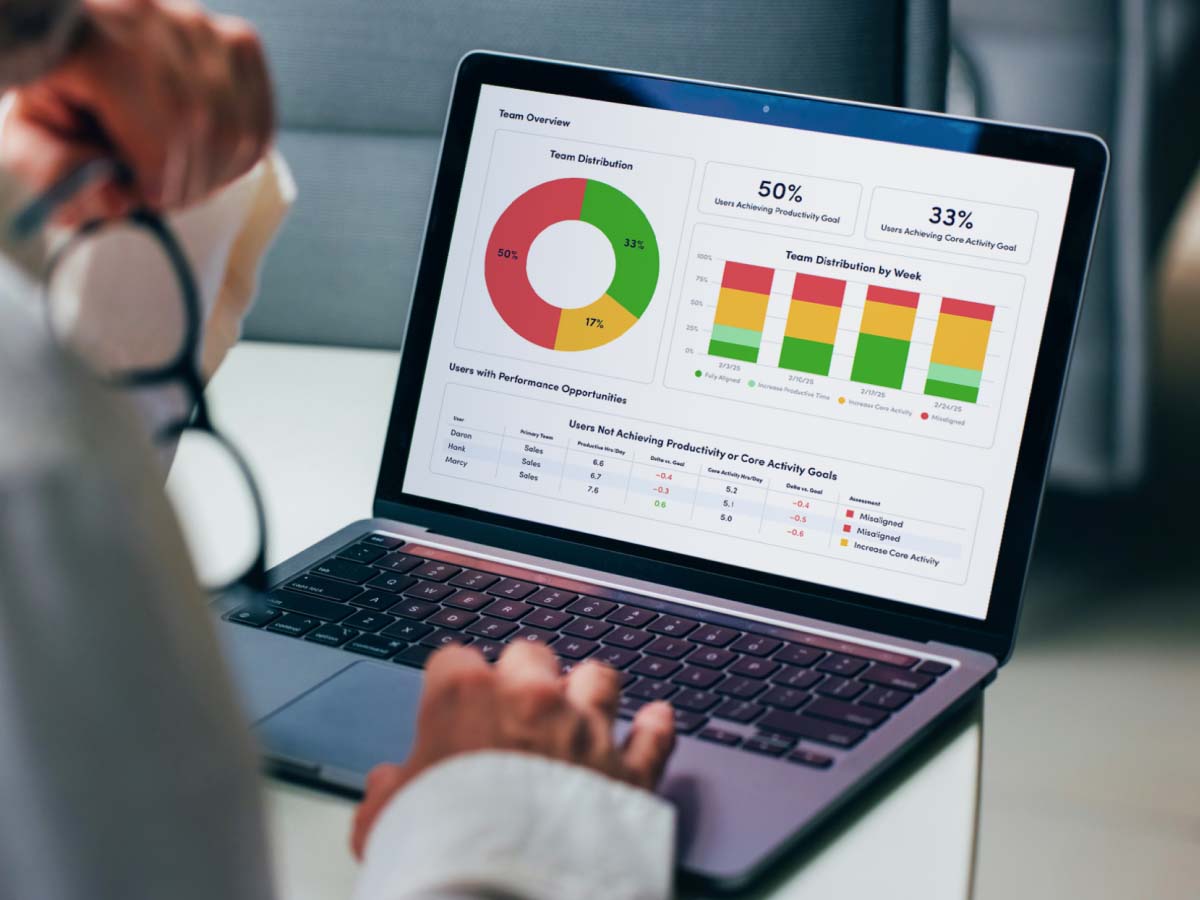
The Employee Productivity Report is the executive’s lens into how effectively daily effort translates into meaningful business outcomes. It offers a comprehensive look at how teams spend their time, whether work aligns with strategic objectives and where opportunities exist to improve focus and performance.
This type of report bridges workforce activity and financial results. Benchmarks from the Bureau of Labor Statistics show that productivity measurably impacts long-term revenue growth, but only when organizations understand the patterns behind how work gets done.
A robust productivity report helps leaders answer questions like:
- Are employees spending time on high-impact work?
- Do workloads support sustainable performance?
- What’s standing in the way of hitting operational targets?
Key metrics for employee productivity
The most valuable productivity reports include four essential data points:
Output per employee/revenue per full-time employee (FTE)
This is a top-level indicator of whether your labor investment is producing expected value. Declines in revenue per FTE often point to inefficient workflows, misaligned initiative ownership or excessive time lost to low-value tasks.
Productive vs. unproductive time ratios
This metric reveals how much of an employee’s day is spent on meaningful, outcome-driving work versus administrative or repetitive tasks. High ratios of unproductive time highlight process friction or role ambiguity.
Activity alignment with strategic goals
Executives need to know whether the hours spent by their teams support core business priorities. When activity drifts away from strategic initiatives, progress stalls and costs escalate.
Utilization rates and workload balance
Healthy utilization indicates employees have a manageable amount of work that’s balanced across the team. Overutilization drives burnout, while underutilization wastes labor capacity.
Connecting productivity data to profitability
Linking productivity insights to financial performance is where this report becomes indispensable for the C-suite. Gallup data shows that companies with highly productive, engaged workforces experience significantly higher earnings-per-share growth and rebound more quickly during economic downturns.
When productivity metrics reveal inefficient workflows or capacity gaps, leaders can reallocate resources or adjust priorities before those issues erode revenue. This is the difference between reacting to problems and anticipating them.
To explore deeper insights into productivity trends, use the Employee Productivity Report within ActivTrak, which highlights patterns in activity, focus and output.
2. The time tracking report: Where do the hours go?
While productivity reports show how effectively work is done, the Time Tracking Report shows where time actually goes. This report identifies hidden inefficiencies that drain hours (and margins) across teams.
When teams don’t understand how their time is spent, it’s difficult to improve workflows or identify unnecessary tasks. Visibility into time use helps executives reclaim lost hours and improve operational efficiency.
Time utilization metrics
According to APQC, the average knowledge worker spends only 30 out of 40 hours per week on productive work. The remaining time is often absorbed by:
- 3.6 hours spent on internal communications
- 2.2 hours in unnecessary meetings
- Routine administrative tasks
- Switching between tools or workstreams
These patterns are rarely visible without a time tracking analysis. Yet they have a major impact on individual performance and organizational output.
The most valuable time tracking reports highlight:
- Focus time
- Multitasking and context switching
- Productive vs. non-productive hours
- Time spent in meetings or collaboration tools
Detecting time inefficiencies and bottlenecks
A strong time-use analysis acts like an operational X-ray. It reveals:
- Projects that drain more time than expected
- Workflow slowdowns
- Meeting overload
- Work fragmentation due to excessive context switching
- Repetitive manual tasks that could be automated
Executives use these insights to streamline operations, eliminate unnecessary meetings and redesign processes that cause delays.
Begin this assessment with ActivTrak’s Free Time Tracking Report, which provides a real-time view of work patterns across teams.
3. The employee engagement report: Assess motivation and burnout
Engagement is one of the strongest predictors of performance, retention and employee well-being. The Employee Engagement Report helps leaders assess motivation, understand burnout risk and measure the health of team culture.
Engagement insights are especially important for organizations facing attrition challenges, hybrid work adjustments or high-pressure growth environments.
Key engagement indicators
Powerful engagement reporting includes metrics like:
Workload consistency and balance
Inconsistent workloads signal process issues or unclear responsibilities — and often drive burnout.
Focus time vs. multitasking
High multitasking correlates with stress, reduced quality of work and increased errors.
Indicators of burnout or disengagement
Reduced consistency, low focus time and declining utilization often signal emerging burnout. Explore these insights further through ActivTrak’s key engagement indicators.
Correlating engagement with performance and retention
The financial impact of engagement is undeniable. According to Gallup, highly engaged teams:
- See 23% higher profitability
- Experience 18 to 43% lower turnover
- See 81% lower absenteeism, which dramatically reduces indirect labor costs
This makes engagement reporting one of the most powerful tools for preventing turnover and improving long-term performance.
4. The operational reports: Essential metrics for business health
Beyond productivity, time use and engagement, organizations also need to understand the operational indicators that underpin workforce performance. Operational Reports offer insight into staffing, capacity, policy compliance and financial risk.
These reports give executives a complete view of the inputs that influence day-to-day performance and long-term planning.
Key operational metrics
Essential operational metrics include:
Headcount vs. budget
This ensures labor costs stay aligned with financial planning.
Schedule adherence and absenteeism rates
High absenteeism hurts productivity, makes planning harder and increases labor replacement costs.
Overtime monitoring
Frequent overtime is often a sign of understaffing or unsustainable processes.
Policy and training compliance
Compliance ensures operational consistency and reduces risk.
Correlating operational data to business health
Operational reporting helps leaders identify issues like:
- Financial overruns from unexpected overtime
- Productivity loss from understaffing
- Compliance gaps with legal or safety implications
- Workflow imbalances that affect delivery timelines
The CDC Foundation estimates absenteeism alone costs U.S. employers tens of billions of dollars every year, emphasizing the need for better visibility into staffing patterns.
With operational insights in hand, leaders can take targeted action to adjust staffing plans, reduce costs, and build a healthier, more resilient workforce.
Get actionable analytics reports with ActivTrak
These four core workforce analytics reports provide executives with the intelligence needed to manage and optimize your most valuable resource: your people. Use ActivTrak and gain the insights you need with these reports:
- Employee productivity reports reveal how work translates into outcomes.
- Time tracking reports show where hours are spent and where efficiency breaks down.
- Employee engagement reports highlight well-being, focus and burnout risk.
- Operational reports provide the structural insights needed to ensure compliance, proper staffing and efficient operations.
Together, these reports offer a holistic view of workforce health and performance — allowing you to reduce waste, increase productivity and ultimately drive profitability.
Hidden productivity loss, unused capacity and technology waste quietly drain margins. ActivTrak links workforce analytics with financial impact, helping leaders improve headcount planning, reduce unnecessary hiring and recapture millions in lost value.
Turn workforce analytics reports into ROI. Connect with our team to discuss your workforce goals and see organizations like yours use the above reports daily.