Workforce Management Reimagined
ActivTrak goes beyond traditional WFM by showing how work really happens — across knowledge workers, back-office functions, front-lines and hybrid environments.
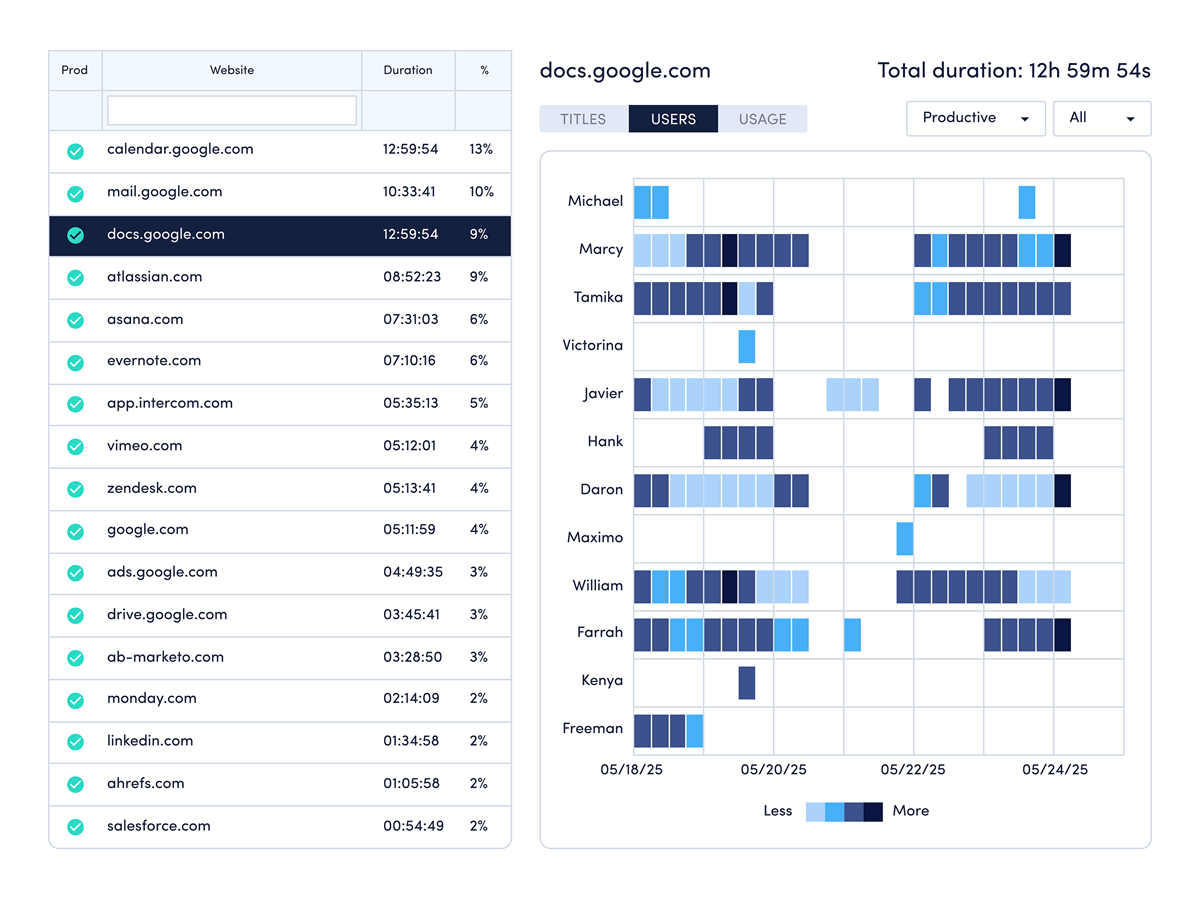
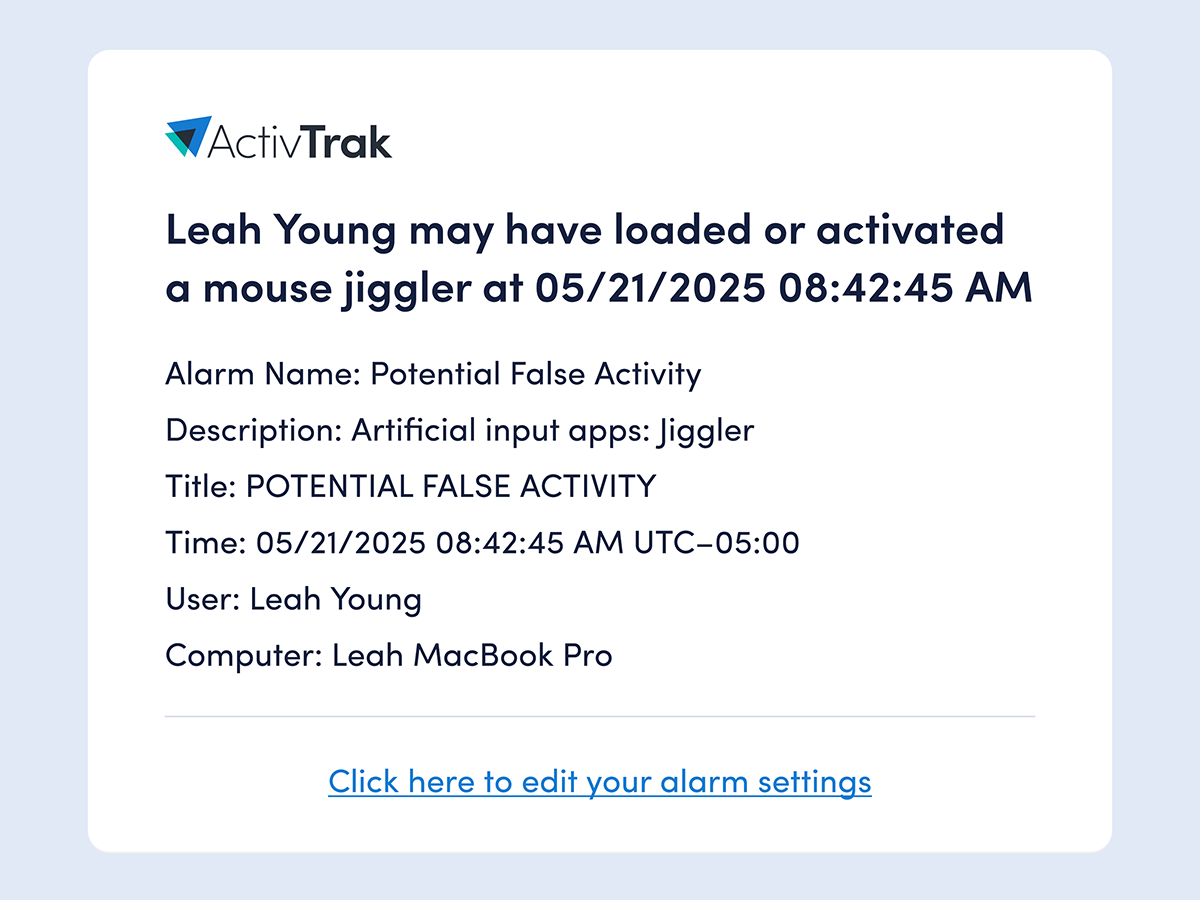
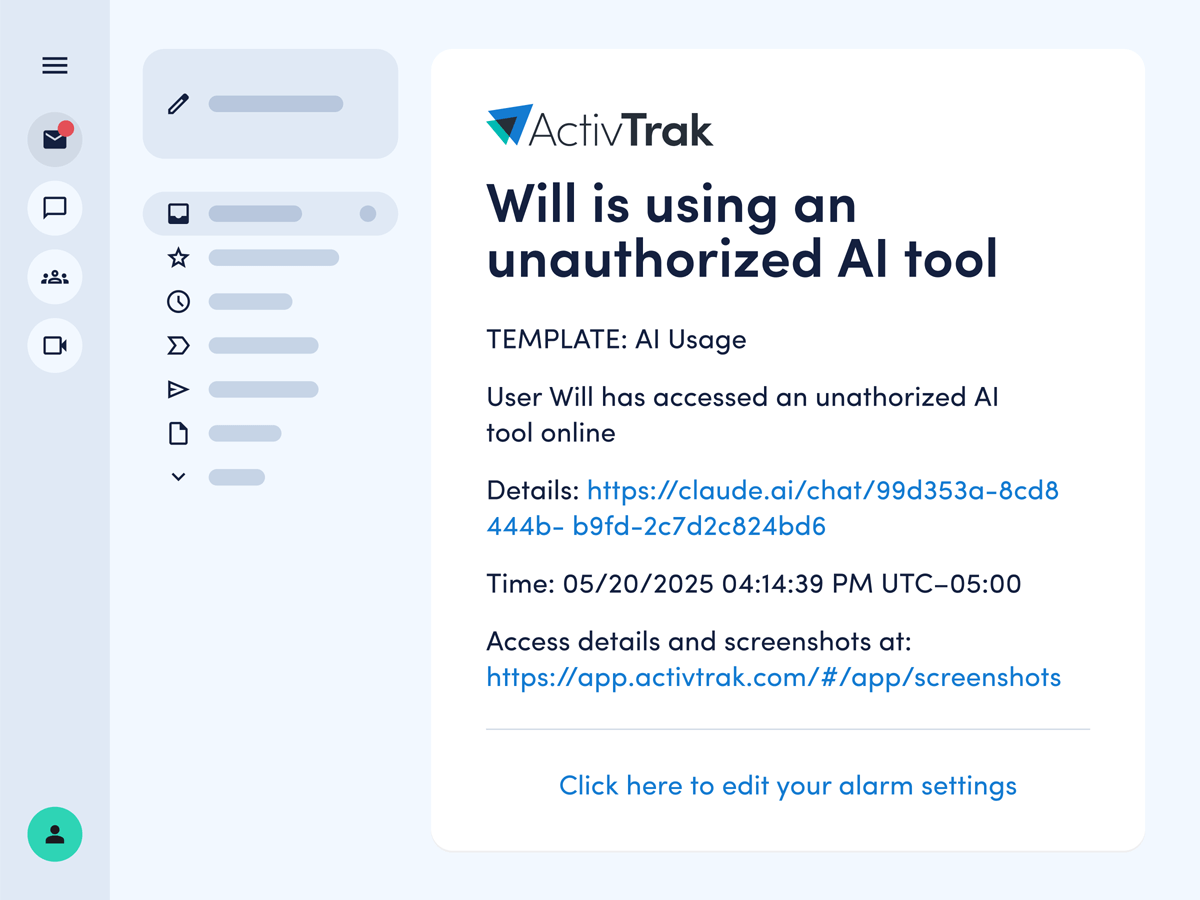
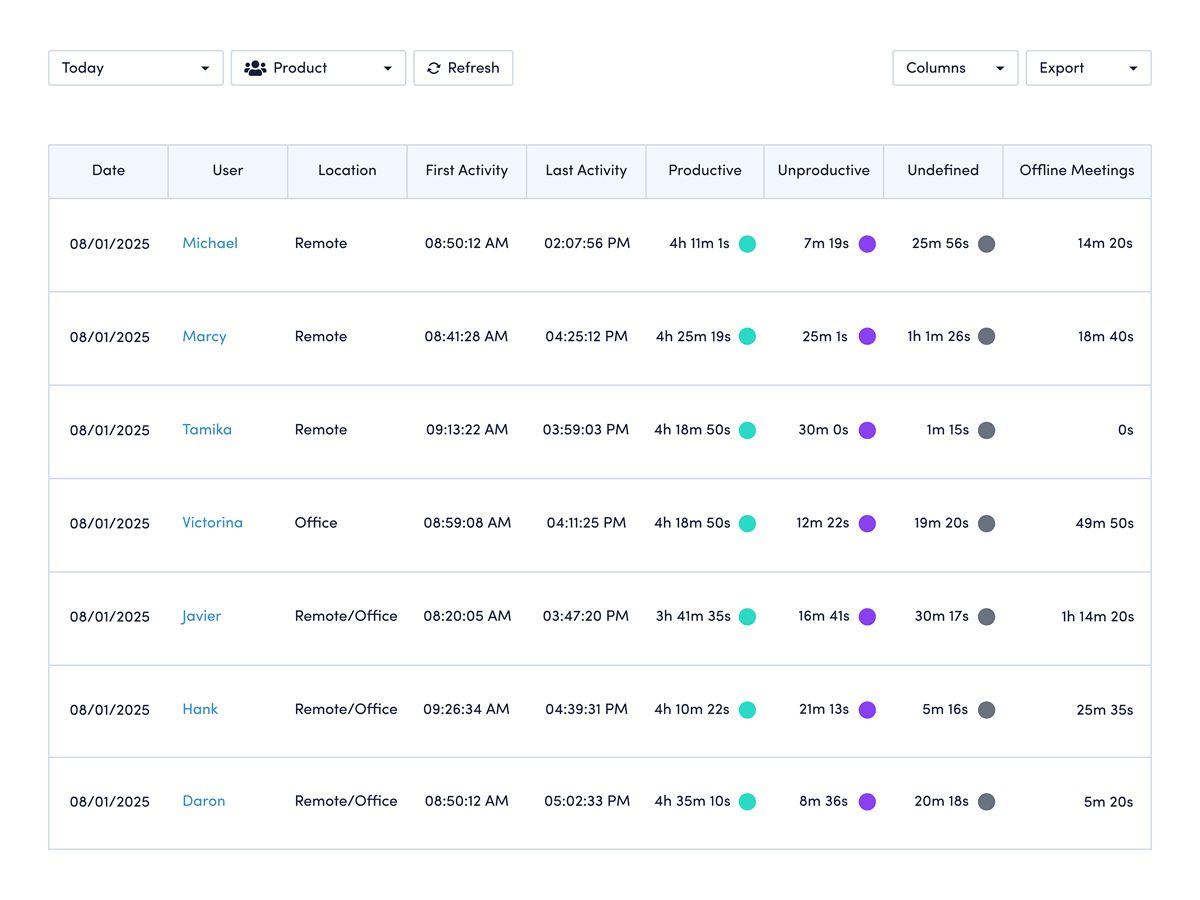
Real-time Visibility
View team activity details in real time, from who’s working right now to which apps they’re using and how productive they are.
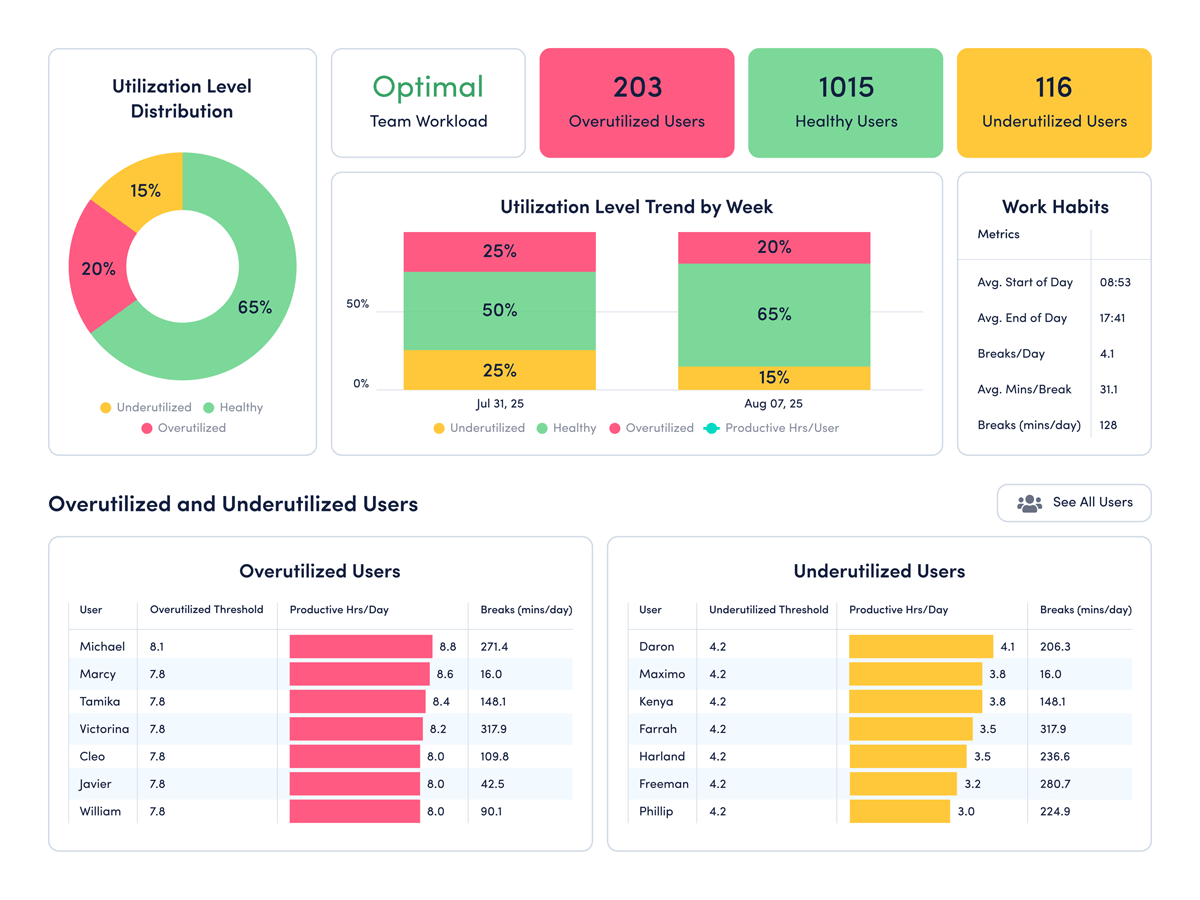
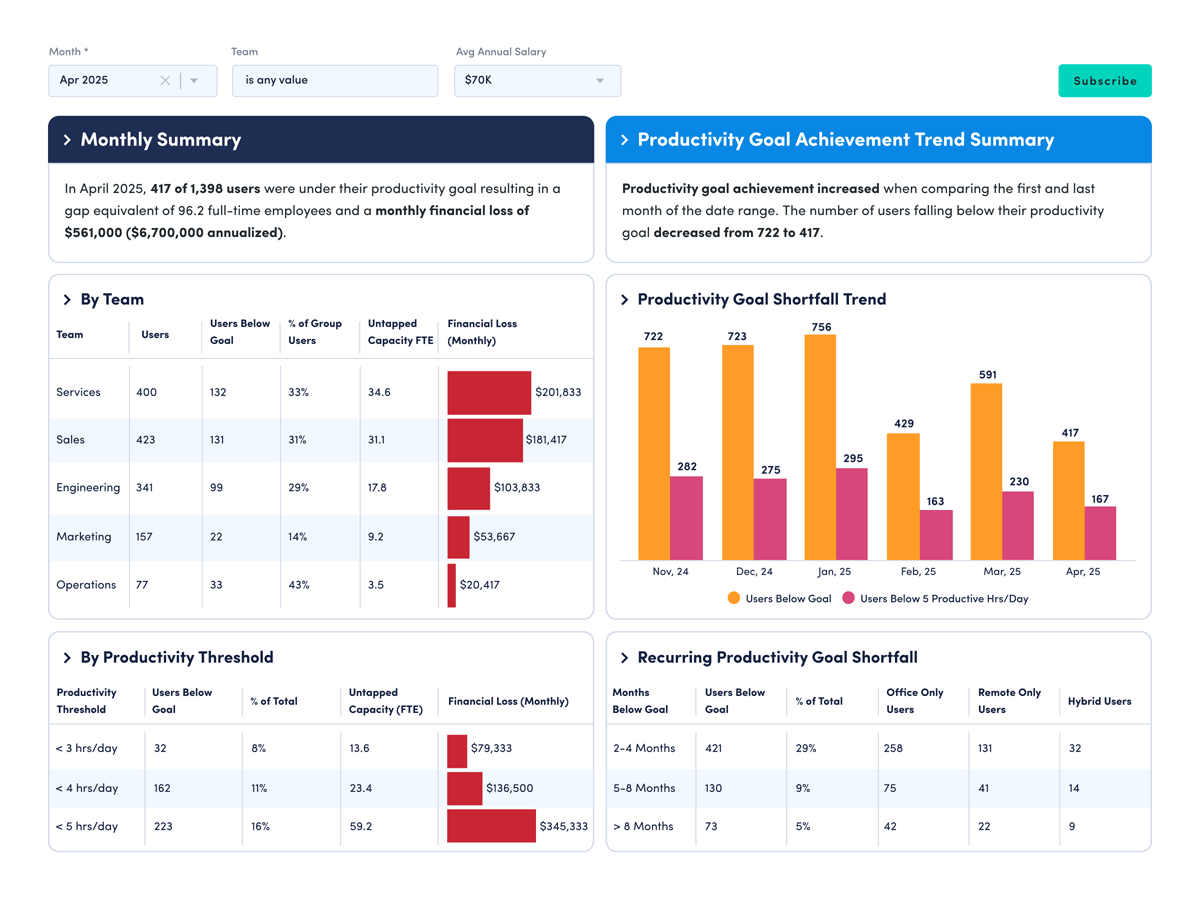
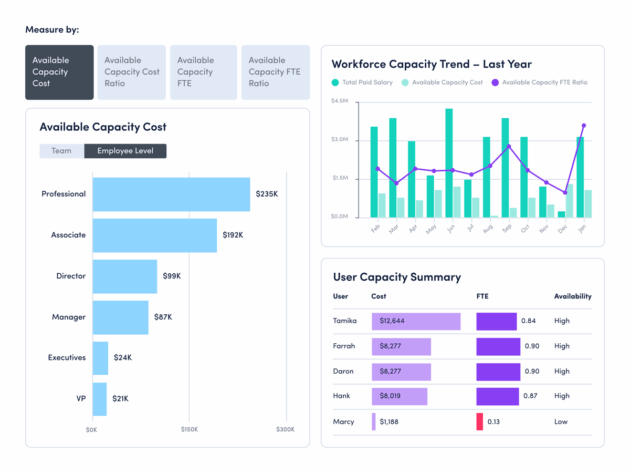
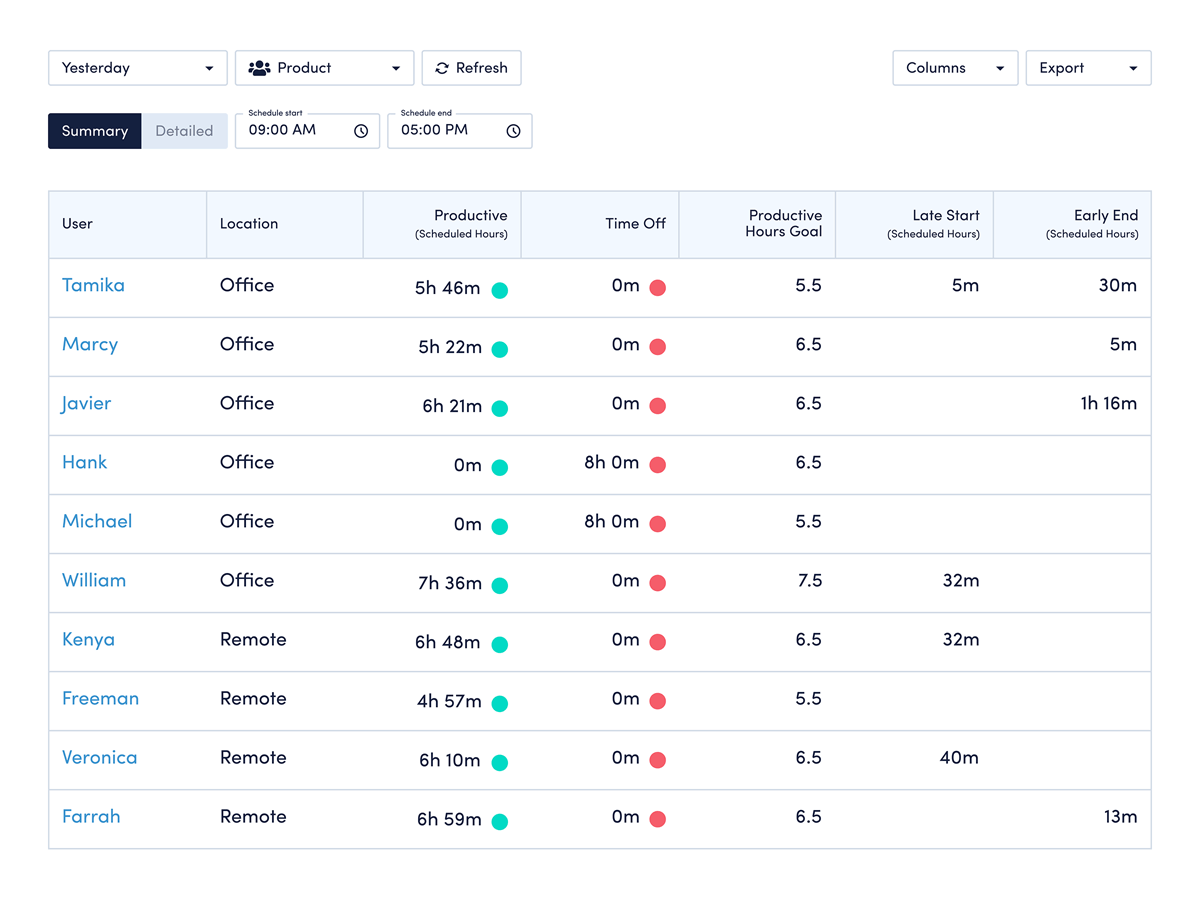
Daily Work Metrics
Easily see how closely employees follow assigned work schedules. Compare actual work hours to planned shifts in a single, clear view — any time.
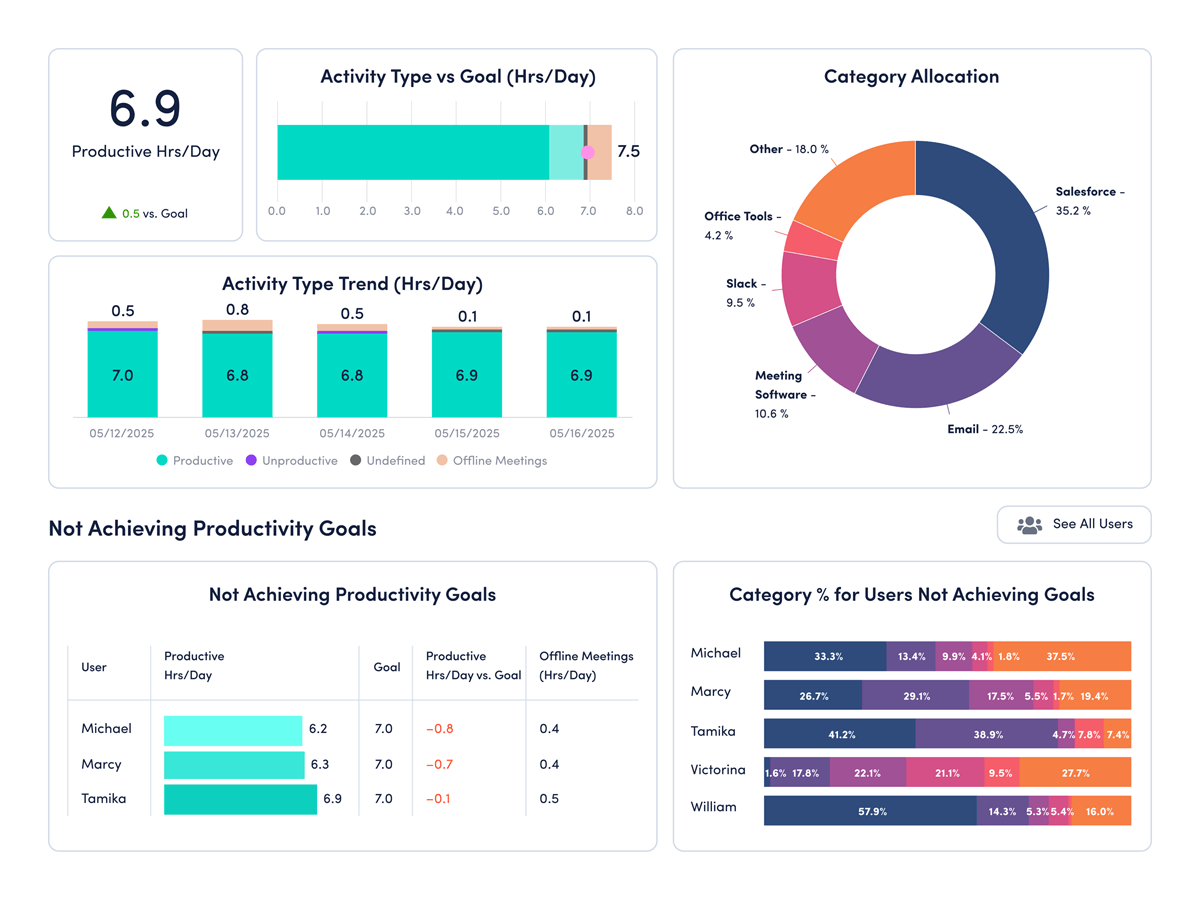
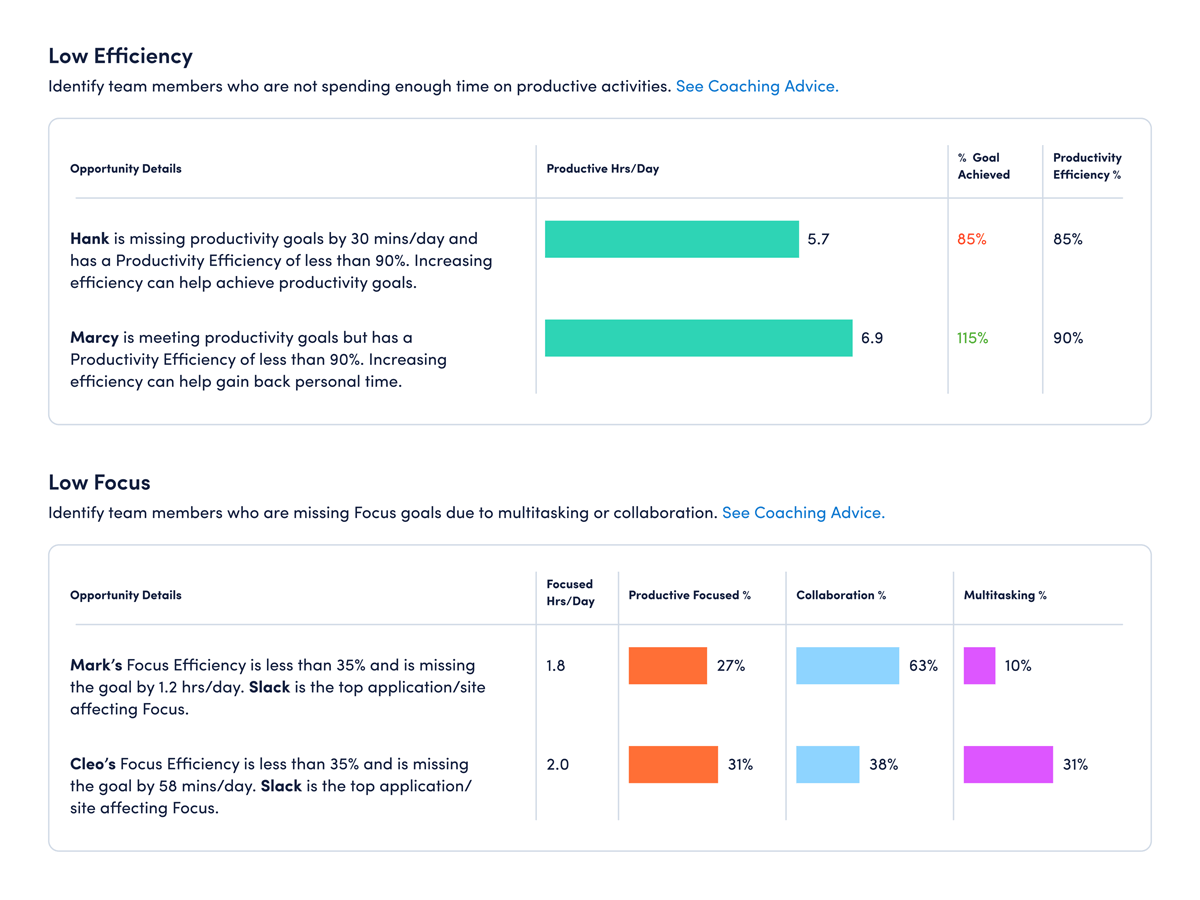
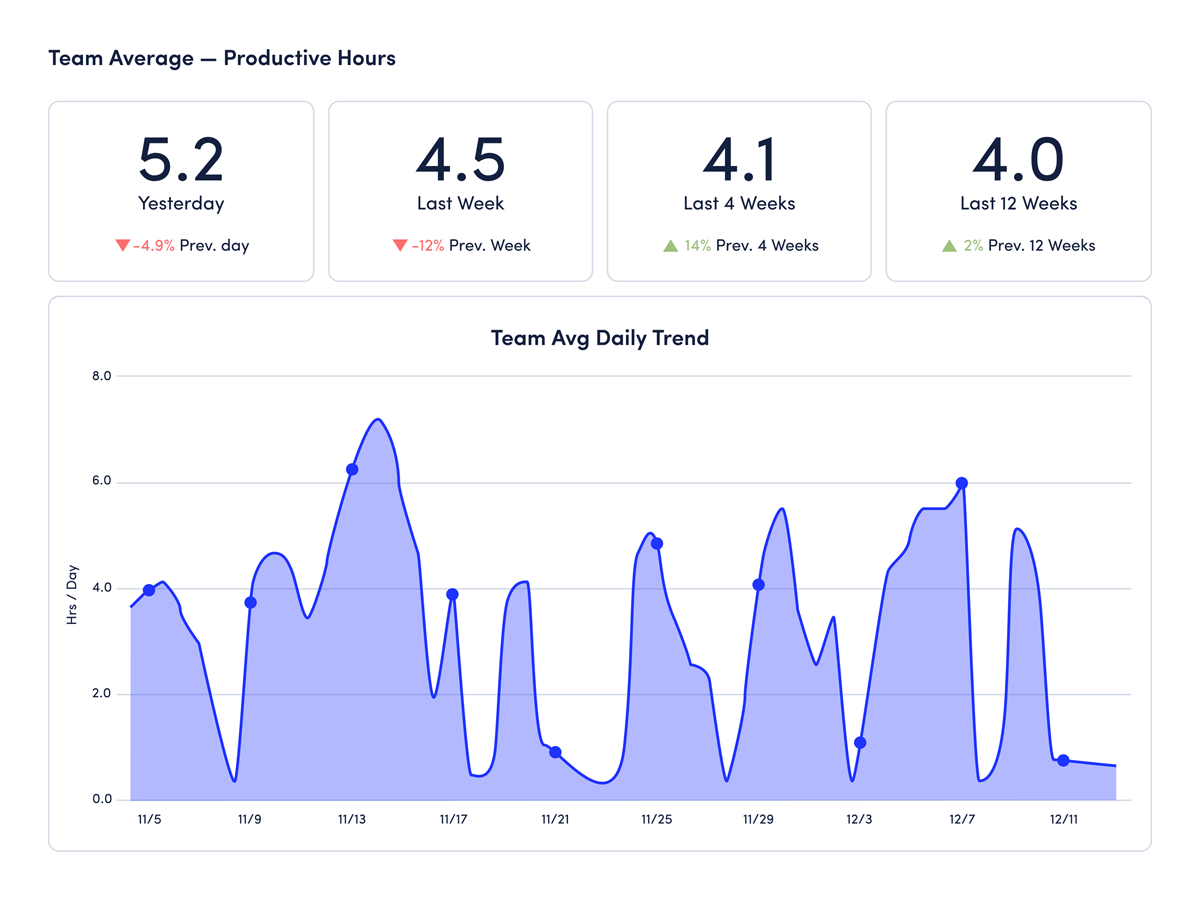
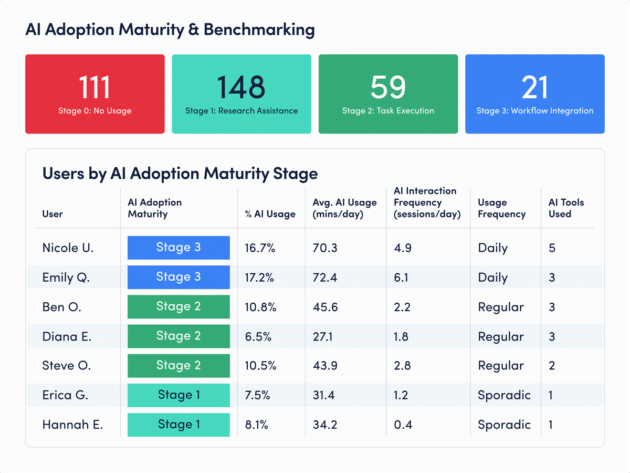
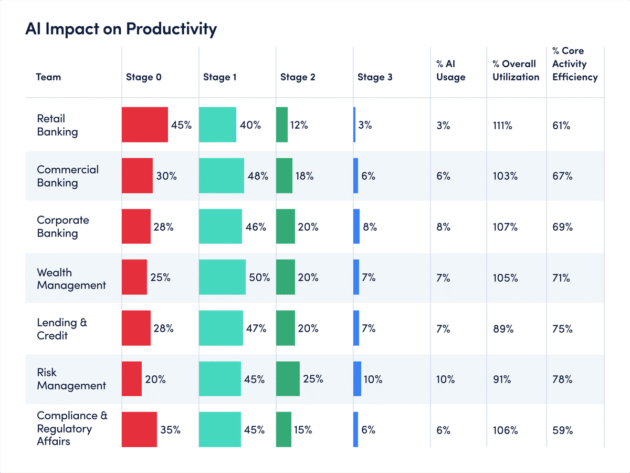
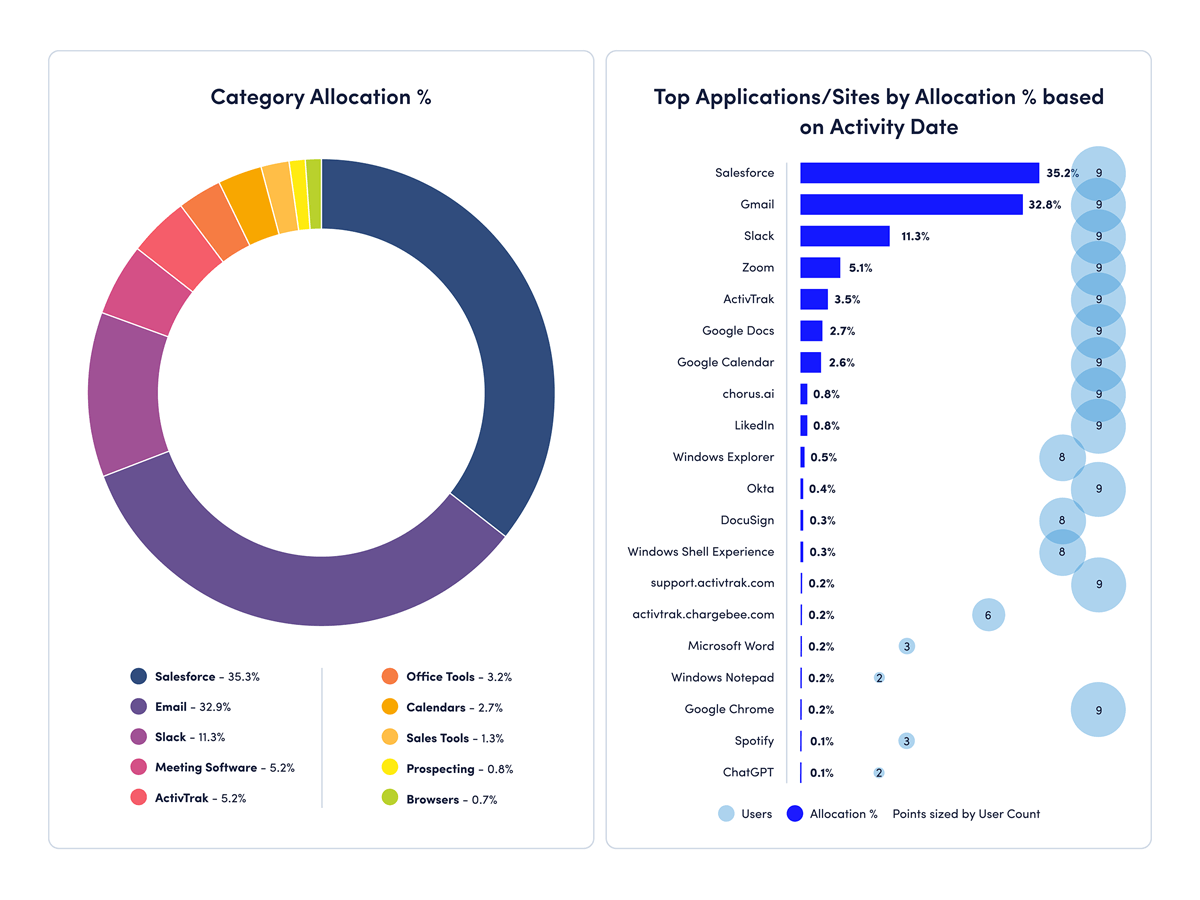
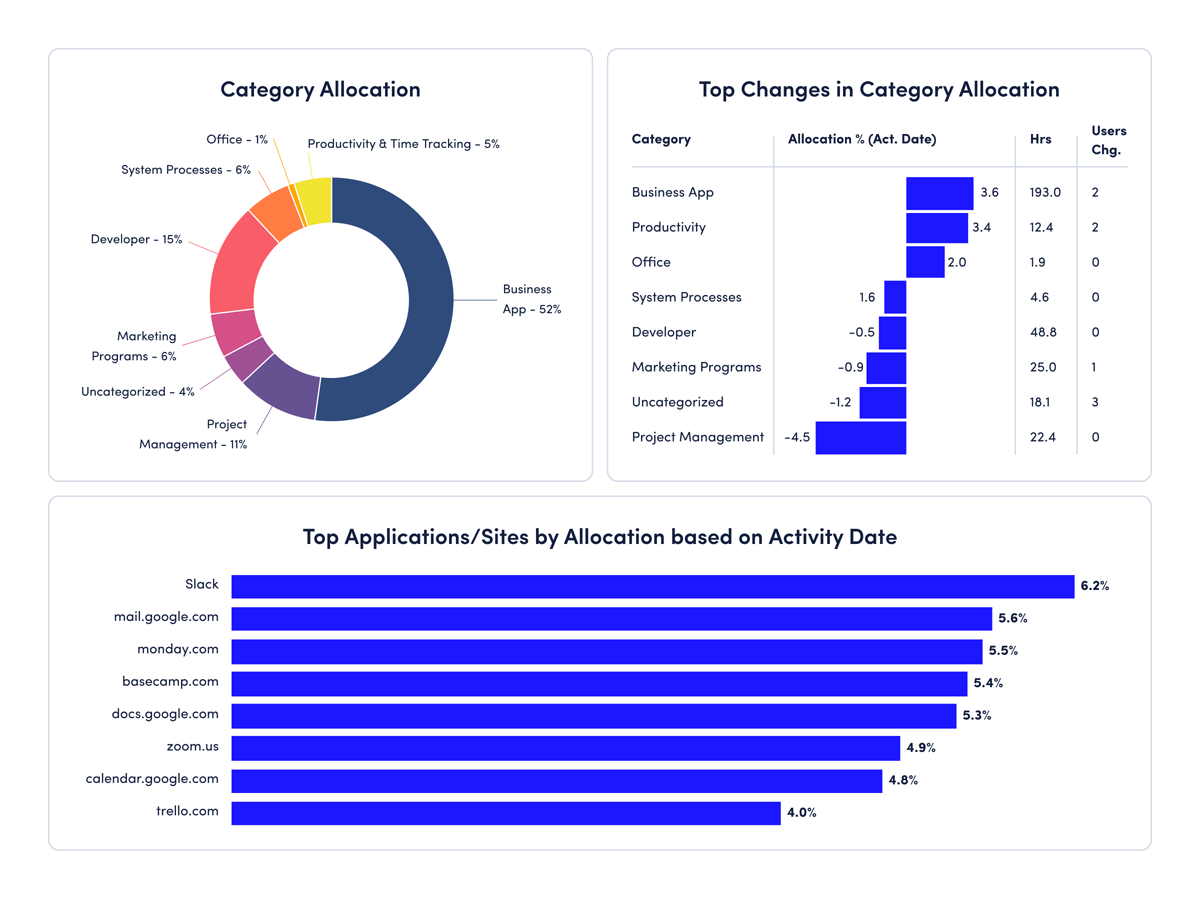
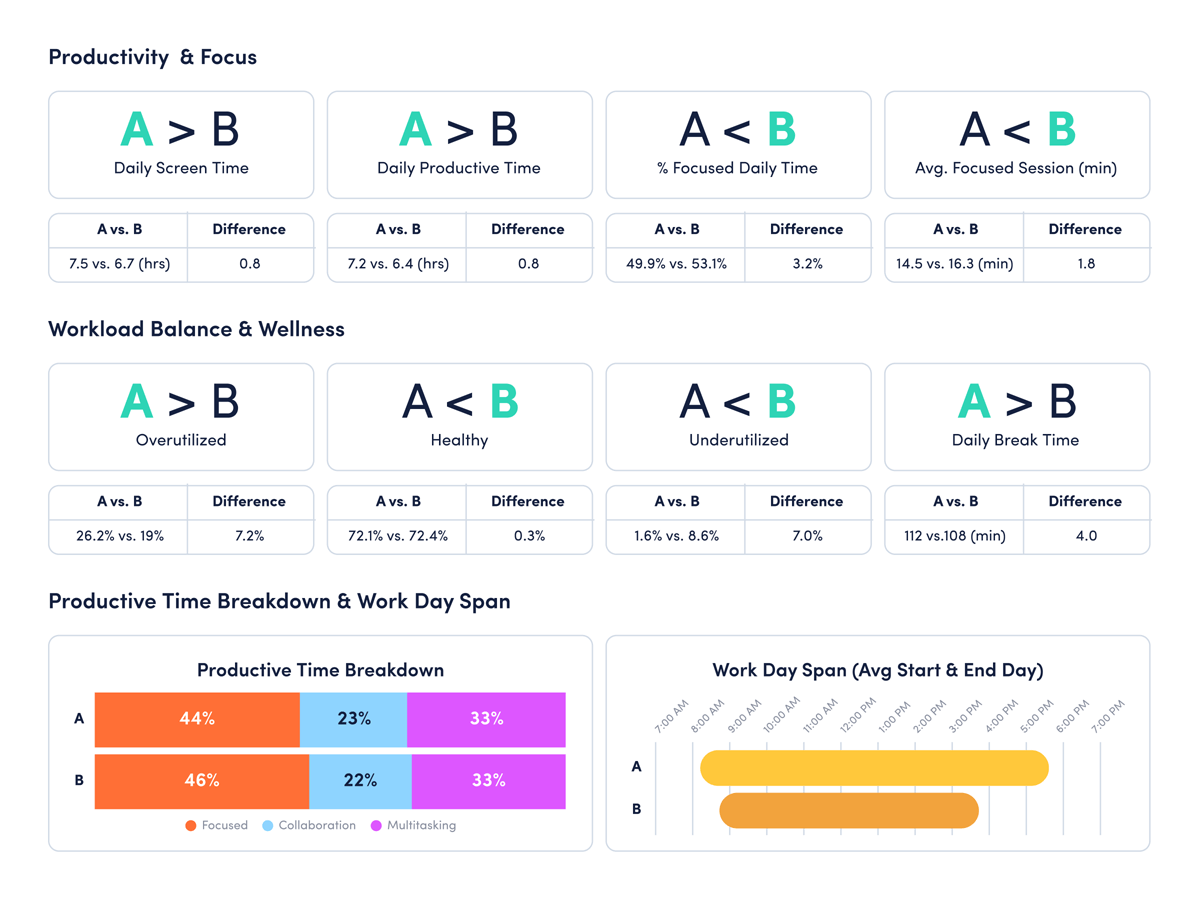
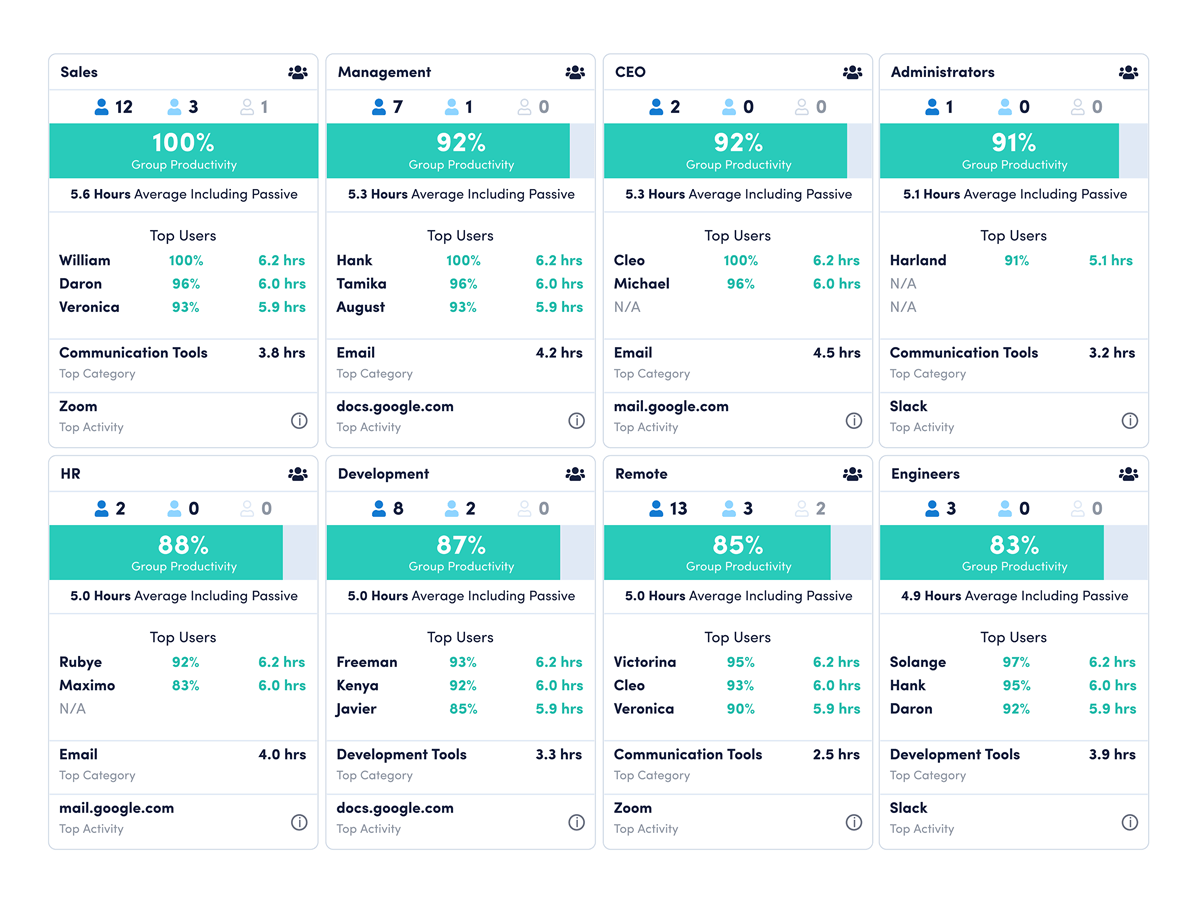
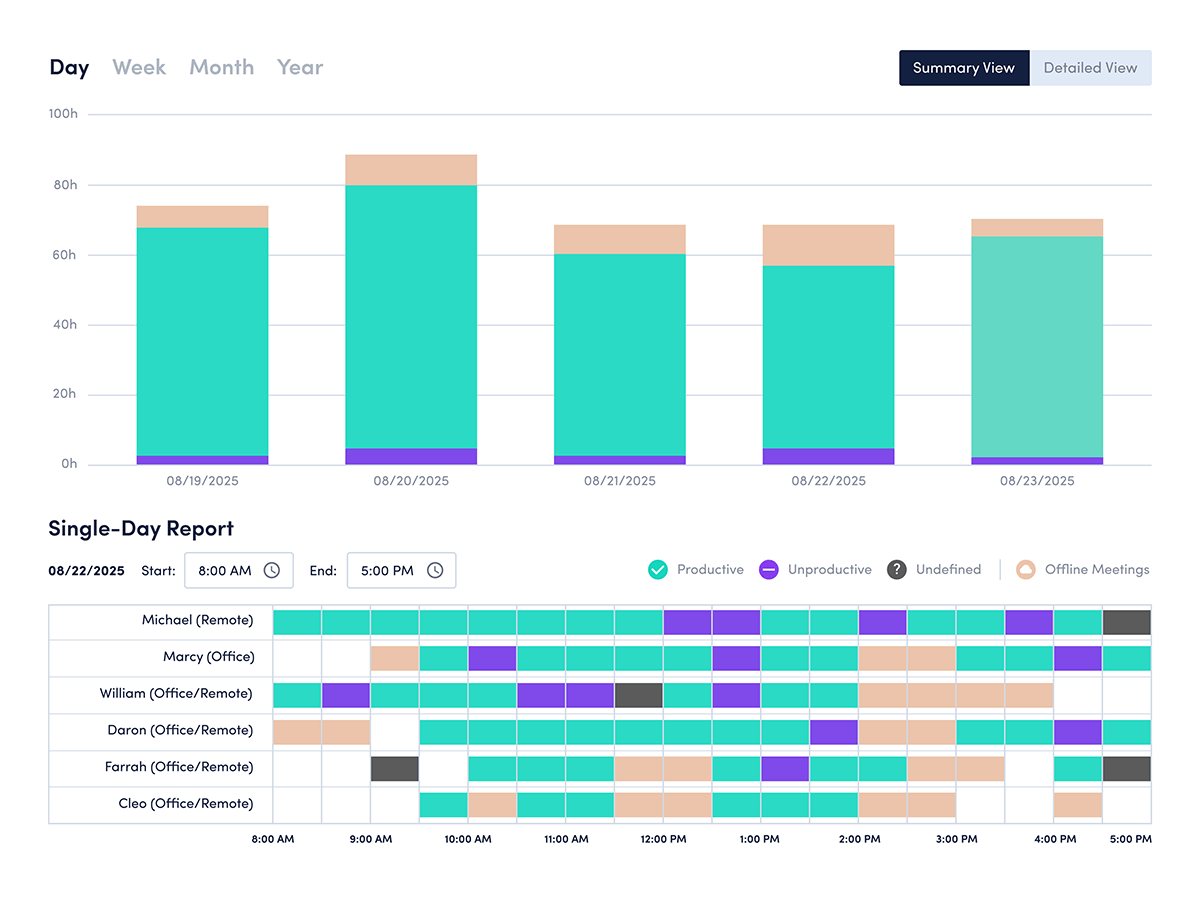
Productivity Trends
See how much time teams spend on productive (and unproductive) activities. Daily, weekly and monthly reports make it easy to spot slowdowns and tailor coaching.
Schedule Adherence
Easily see how closely employees follow assigned work schedules. Compare actual work hours to planned shifts in a single, clear view — any time.
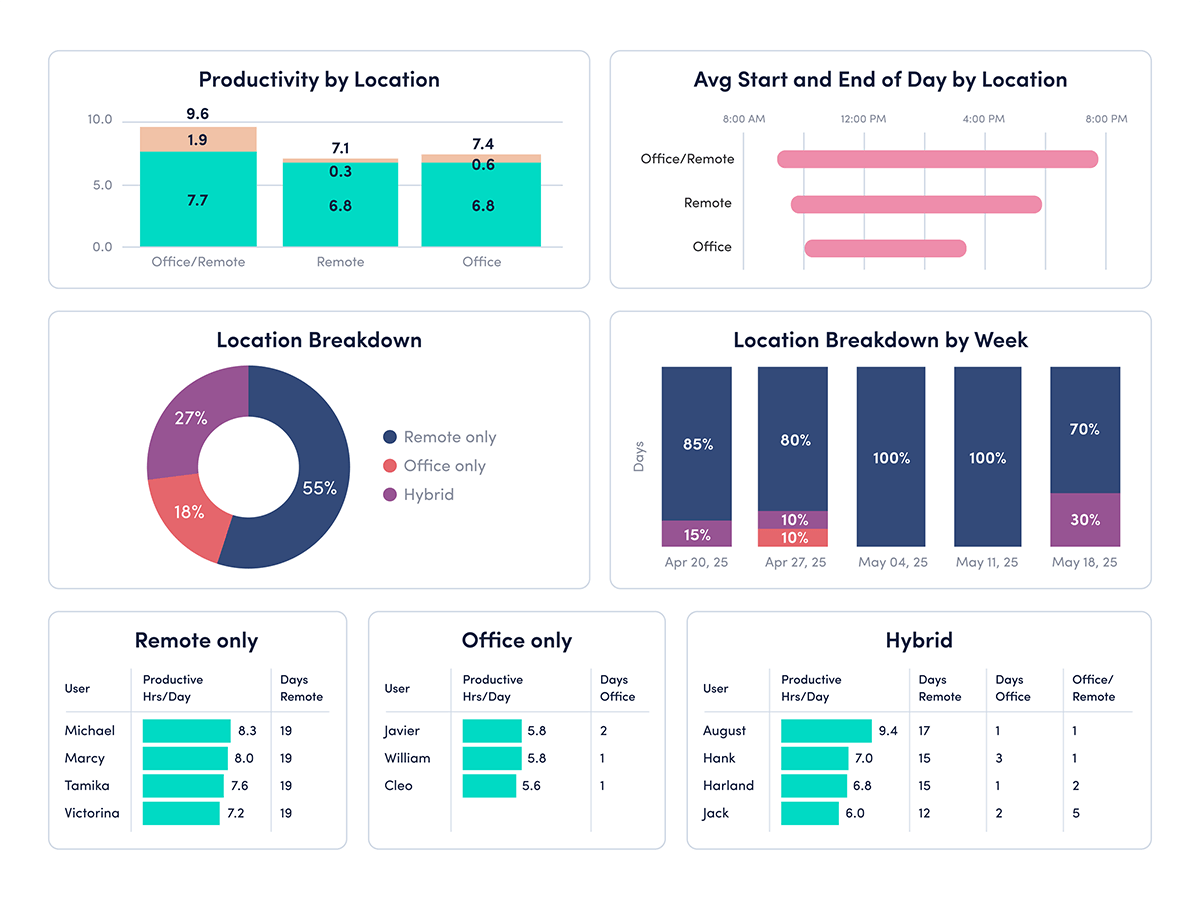
Location Adherence
See when employees work remotely or in the office, without the need for GPS tracking. Compare productivity across locations, ensure compliance with return-to-office policies and make informed decisions about hybrid work, all from one simple report.