Understanding your team’s work habits is key to driving effective coaching conversations and maximizing productivity. But where should you start?
We put together a list of the top 10 ActivTrak productivity reports and dashboards to help your organization zero in on the insights that matter most. Use the guidance below to get more ROI from your workforce investments.
1. Organizational Overview
This bird’s eye view for leaders allows you to track activity and performance across teams. Get real-time visibility and trends for context in a single pane of glass.
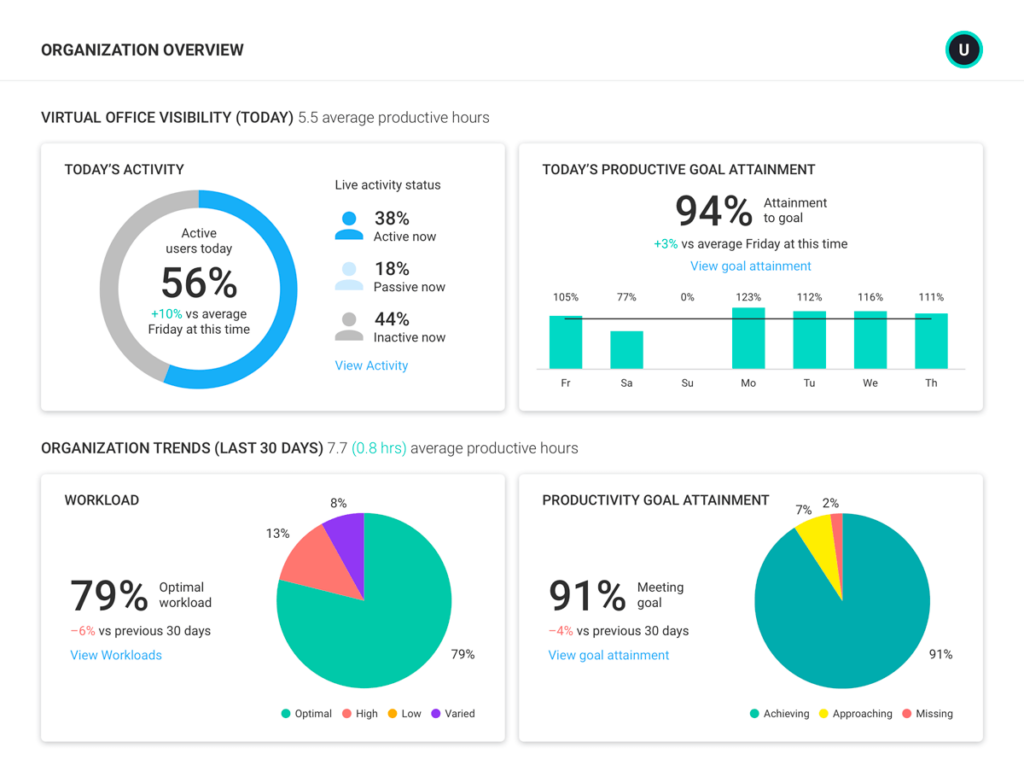
Find out if your team has the focus time they need for creative thinking, problem-solving and prioritization. ActivTrak’s Organization Overview gives you quick insights into how long team members stay focused without interruptions, as well as total work hours vs productive hours.
Use Organization Overview to:
- Quickly identify dips in productivity
- Understand utilization trends to ensure ongoing work balance
- Identify abnormalities and deviations from the norm across your company
2. Daily Work Metrics
Discover the prime hours your team is most productive and get “walk around” visibility into presence and activity.
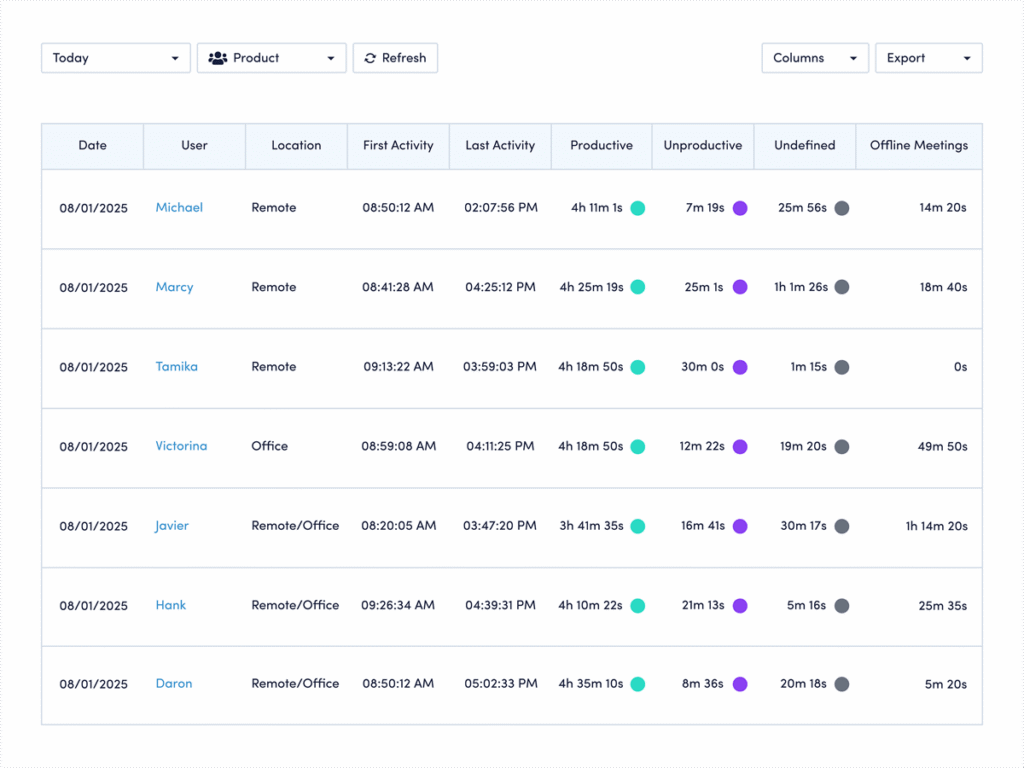
Get a better understanding of your employees’ work behaviors through trends and patterns. ActivTrak Daily Work Metrics highlights your employees’ first and last activity for each day and provides an overview of their daily work. It’s a great way to establish an operating baseline.
Use Daily Work Metrics to:
- Compare the total time spent on productive and unproductive activities
- Highlight when your employees are actively working or taking breaks throughout the day
- Use adjustable time intervals to analyze daily productivity for individuals or teams
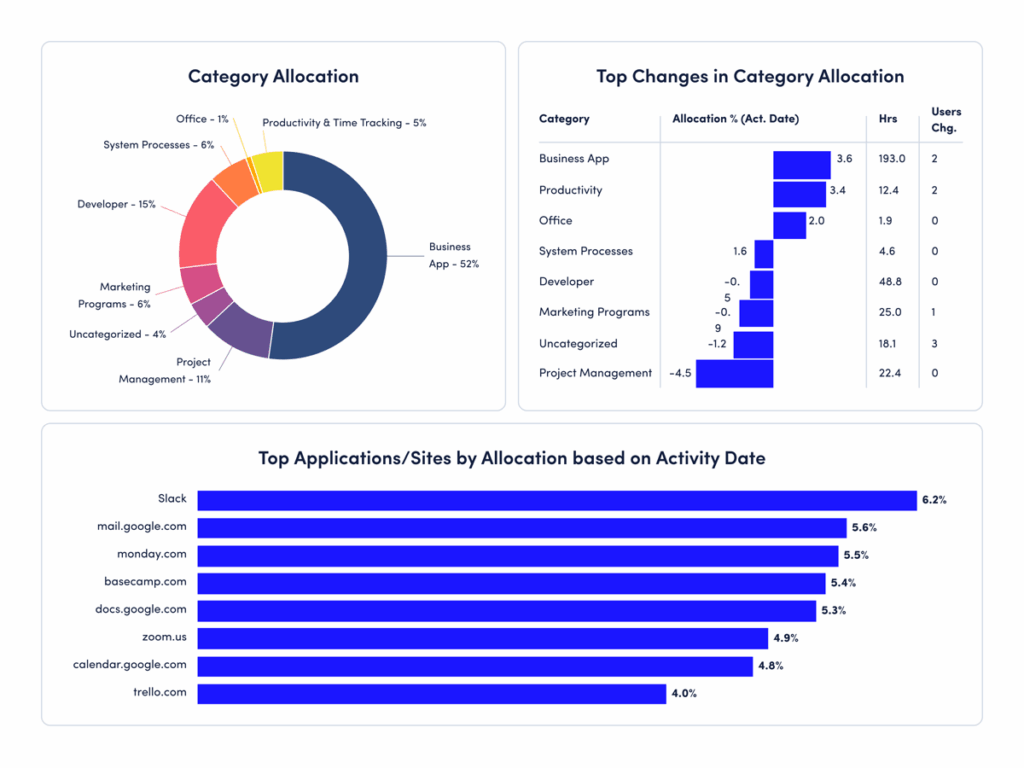
3. Activity Alignment
See how much time teams spend on low-value activities so you can direct them to higher value work that drives results.
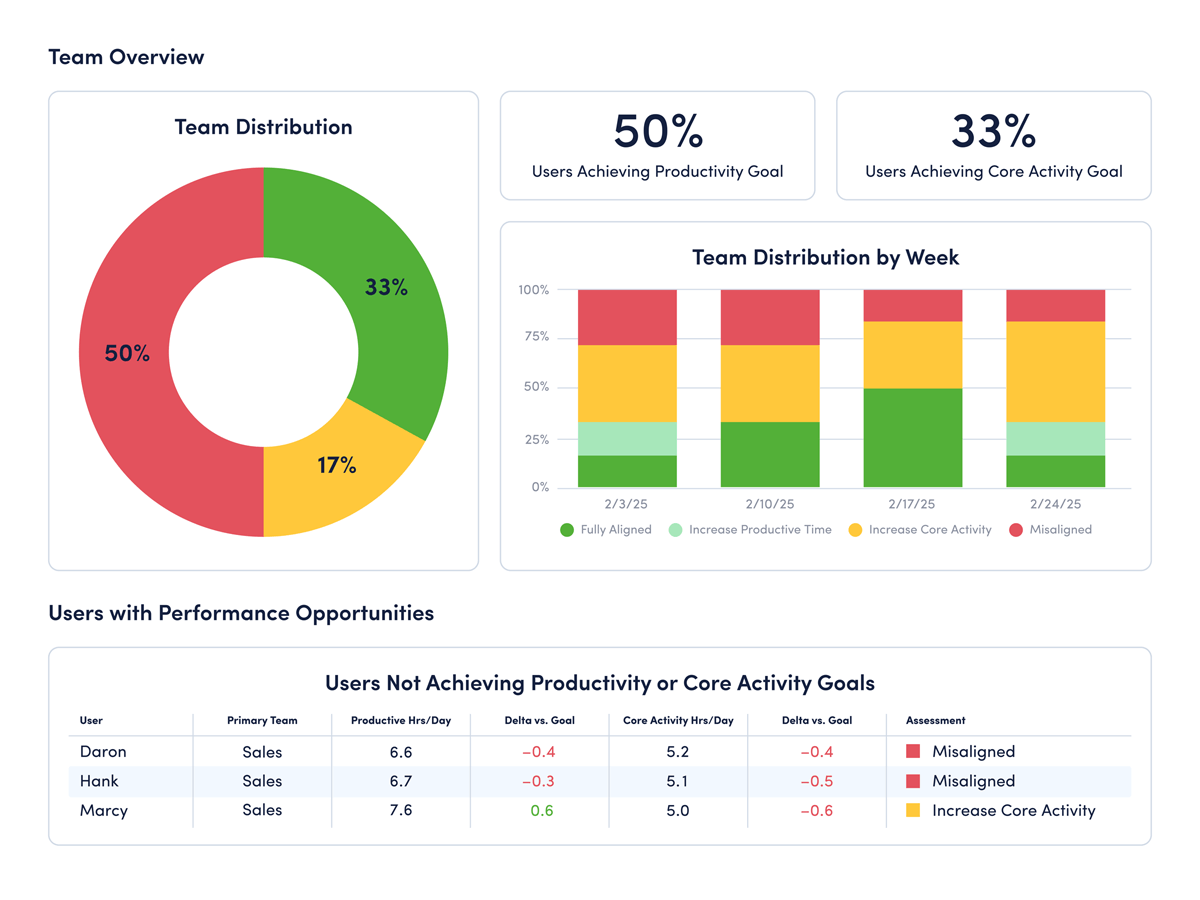
Your employees work hard, but do they focus on the right work? ActivTrak shows exactly how your teams divide their time between core responsibilities and secondary tasks, so you can spot when busywork crowds out the high-impact activities powering your bottom line.
ActivTrak Activity Alignment categorizes productive time into core and non-core activities, showing you how well teams focus their time on high-value work that drives business results.
Use Activity Alignment to:
- Identify how employees spend their time
- Reduce the amount of time non-revenue generating activities
- Use data to guide conversations and free employees to focus on high-value work
4. Productivity by Location
Compare work habits and productivity by location and measure adherence against your work policy.
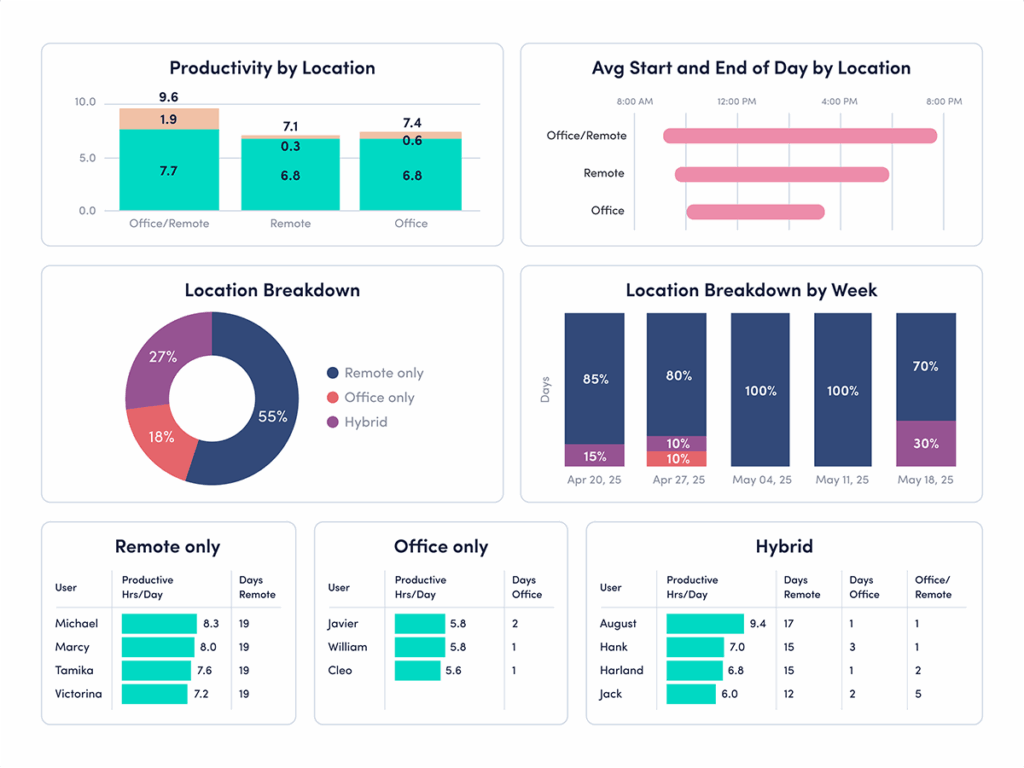
With distributed, hybrid or remote teams, organizations need to know where their employees are most productive. ActivTrak Productivity by Location gives you data on which team members are more productive in which places so you can make informed decisions on setting policies or helping coach employees on workplace habits.
Use Productivity by Location to:
- Determine return-to-office or flexible workplace arrangement policies based on data
- Compare productivity data based on location to help teams determine their own work schedules
- Identify productivity issues for individual team members to provide support when necessary
5. Workload Balance
Spot signs of disengagement (underutilization) and burnout (overutilization). Distribute workloads evenly throughout your team and ensure well-being.
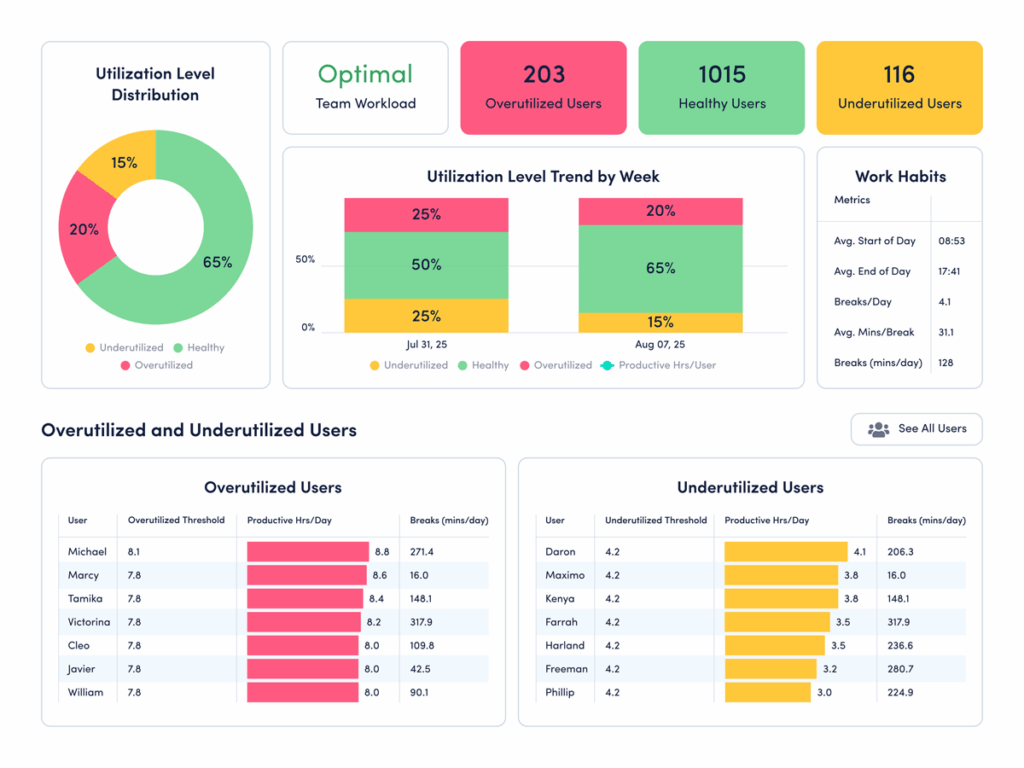
If you’re struggling to get visibility into who needs help, you are not alone. Studies show organizations that help teams avoid burnout are more likely to outperform their competition, retain top performers and attract new talent.
ActivTrak Workload Balance helps you view work habits across teams to identify which ones work long hours and off-hours on a consistent basis, so you know when to rebalance where people spend their time.
Use Workload Balance to:
- Determine how long your employees are online
- Understand if your teams take the right amount of breaks
- Identify employees at risk of burning out as well as those individuals with low engagement
6. Focus & Collaboration
Boost team output by identifying opportunities to improve productivity, efficiency and focus.
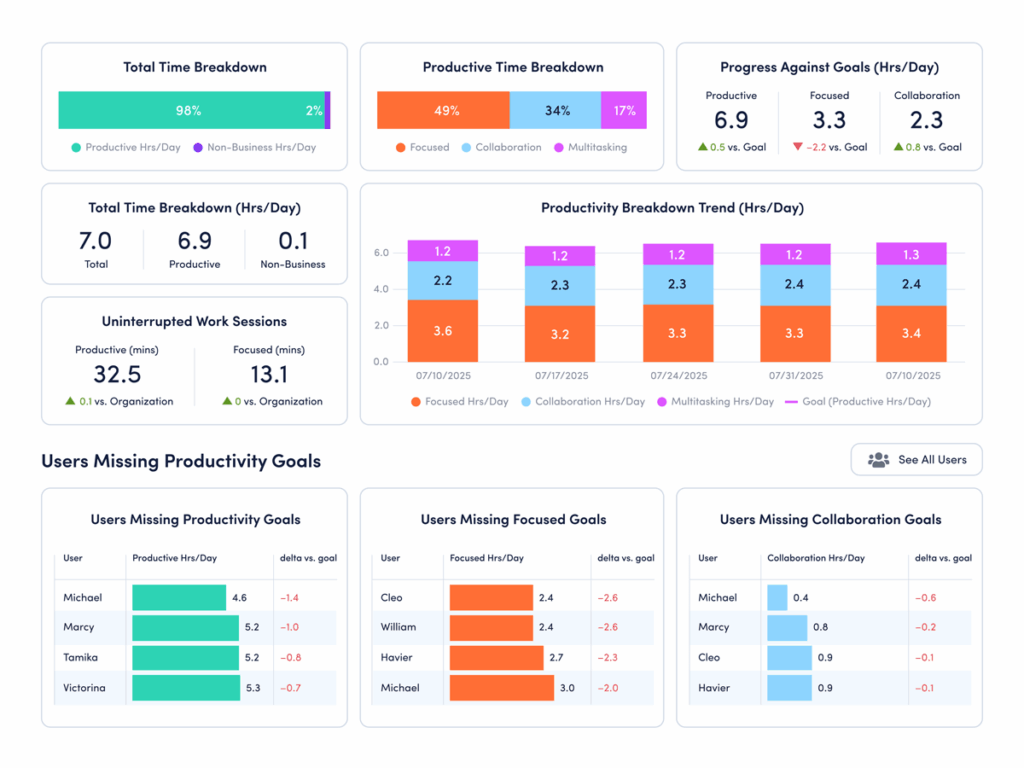
ActivTrak Focus & Collaboration breaks down the amount of time spent on deep work, meetings, collaborations and distractions. This visibility allows you to compare overall workforce hours to the number of productive and focused hours. You can also easily identify what might be contributing to workplace distractions and unproductive behavior.
Use Focus & Collaboration to:
- Review productive and focus time to see where distractions can be removed
- Compare efficiency metrics with team goals and company benchmarks
- Hold teams accountable for goals and identify areas for improvement
7. Technology Utilization
See which apps and websites teams regularly use to align tech spending with actual usage.
Research shows nearly one-third of SaaS spend goes to waste — a problem accelerated by the explosion of AI tools. ActivTrak Technology Utilization shows which apps and websites teams use, and how often.
Use the Technology Utilization report to:
- Get a comprehensive view into employee usage of websites, applications and AI tools
- Measure technology adoption to guide investments and policies
- Ensure compliance and spot use of unsanctioned apps
8. Coaching Opportunities
Empower managers to enable and uplift their teams with actionable coaching guidance.
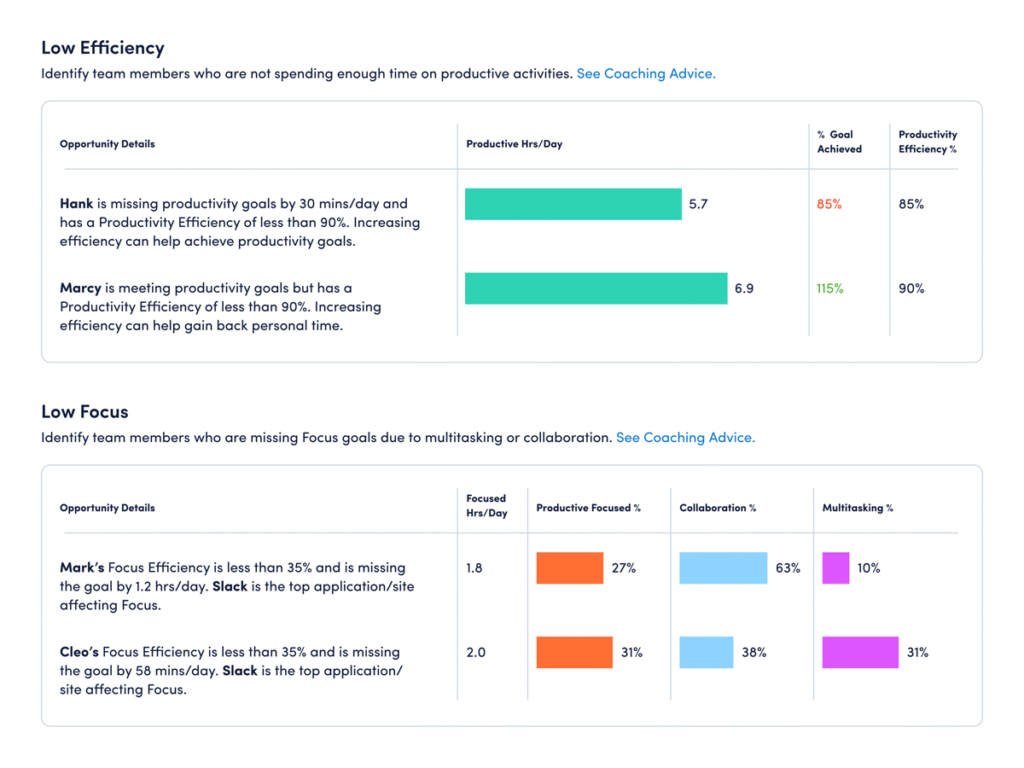
ActivTrak Coaching Opportunities uses AI to surface meaningful productivity insights and guidance tailored to individual employee challenges. These actionable insights empower managers to become more effective coaches.
Use Coaching Opportunities to:
- Identify and validate potential issues such as burnout risk, waning productivity or inefficient workflows
- Drive collaborative discussions with team members
- Assess the impact of coaching on team behavior
9. Benchmarks & Goals
Track team performance against established goals and industry benchmarks.
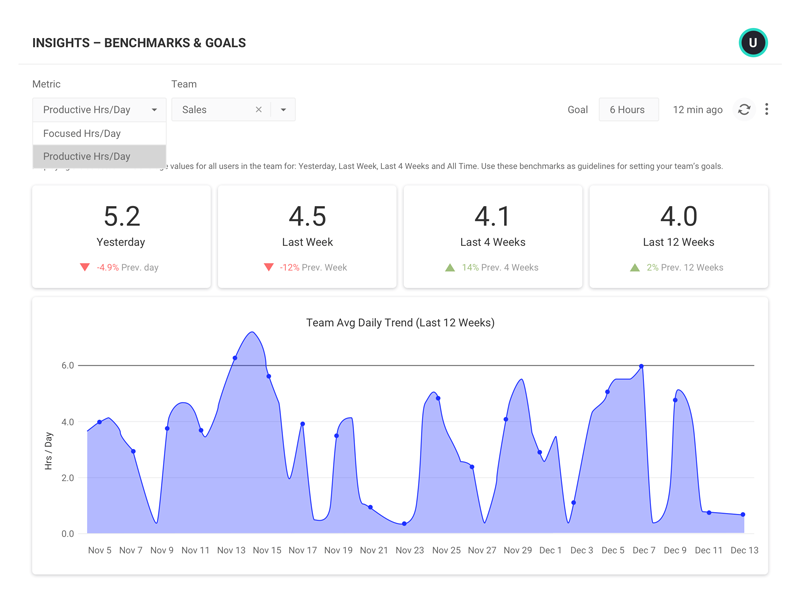
ActivTrak’s Productivity Benchmarks & Goals allows you to set goals for how teams work. You can then compare current productivity levels against established benchmarks.
Use Benchmarks & Goals to:
- Set data-based goals for sales, recruiting, productivity and more based on previous performance
- Use industry benchmarks to compare your organization’s productivity trends and find gaps
- See trends in productivity like seasonality to help guide goal-setting and equip teams for busier seasons
10. Personal Insights
Empower employees to join the conversation, self-manage and course-correct with personalized data delivered directly to their inboxes.
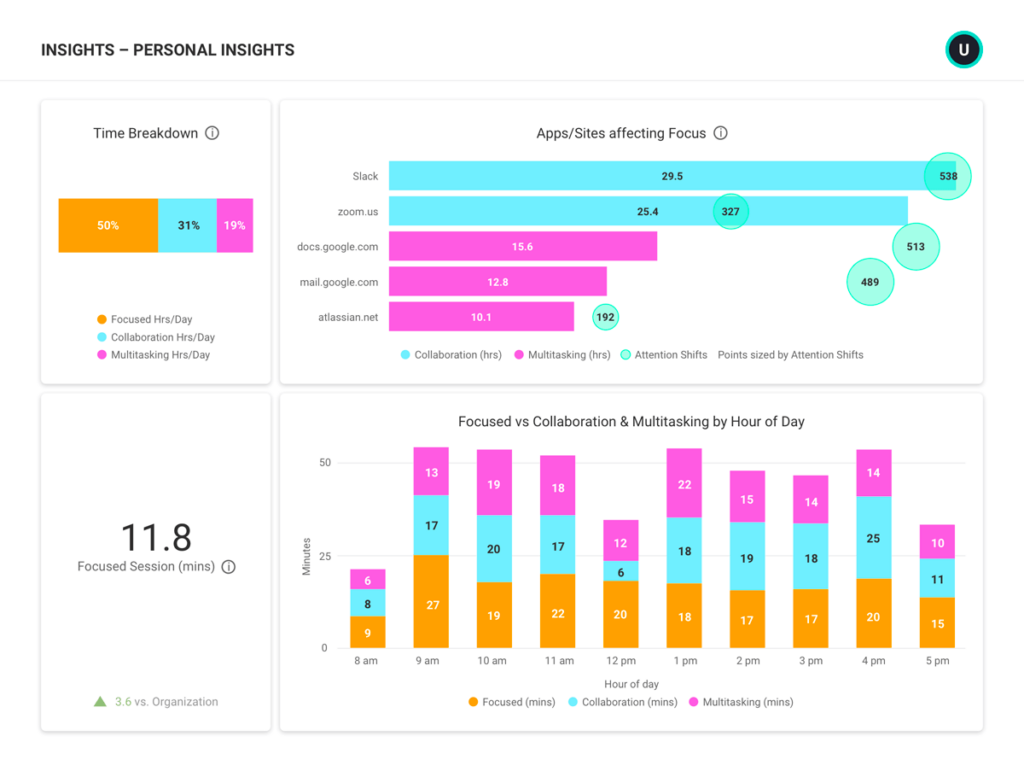
Empower your team members to build healthy work habits with ActivTrak Personal Insights. They can get a weekly view of personal work habits, including where distractions come from, when they’re most focused and when they should take healthy breaks.
Personal Insights allows employees to:
- Compare activity habits to team goals and trends
- View focus time vs. distractions and see which applications and sites play a role
- Share their Personal Insights dashboards via email (even with others who don’t have access to the app)
Ready to unlock workforce potential?
ActivTrak’s productivity insights make it easy to replace gut instinct with real data, empowering you to make workforce decisions with confidence. Use them to improve productivity across your organization in numerous ways, from company-wide policies to individual coaching and resources.
Looking for deeper insights? Get a free demo to learn more ways ActivTrak unlocks workforce ROI.
This article was originally published on Nov 21, 2023, then updated on Jan 30, 2026