
ActivTrak’s fifth annual State of the Workplace report is full of surprises.
AI is clearly changing work. The average workday is faster, more fragmented and less focused than ever. But what do the findings mean for your teams? In our new companion guide series, we’ll walk through 440+ million hours’ worth of work data to show how to apply the findings to your workforce — one step at a time.
You’ll learn:
- Which ActivTrak reports to pull
- How to compare your workforce data to this year’s benchmarks
- What the numbers tell you — and what to do next
TABLE CONTENTS
Compare your data to key benchmarks
Part 1: AI Adoption
(Sign up to be notified when the next guide is ready, or check here for weekly updates.)
Compare your workforce data to key report benchmarks
Let’s start by answering three critical questions:
- Do your employees stay focused and on task?
- Do you have chronically underutilized employees?
- Where do your teams stand on AI adoption?
(New to ActivTrak? Sign up for a free trial to start collecting data and gain full access to Professional features for 14 days.)
1. Do your employees stay focused and on task?
The finding: Overall productivity is up. But focus is down.
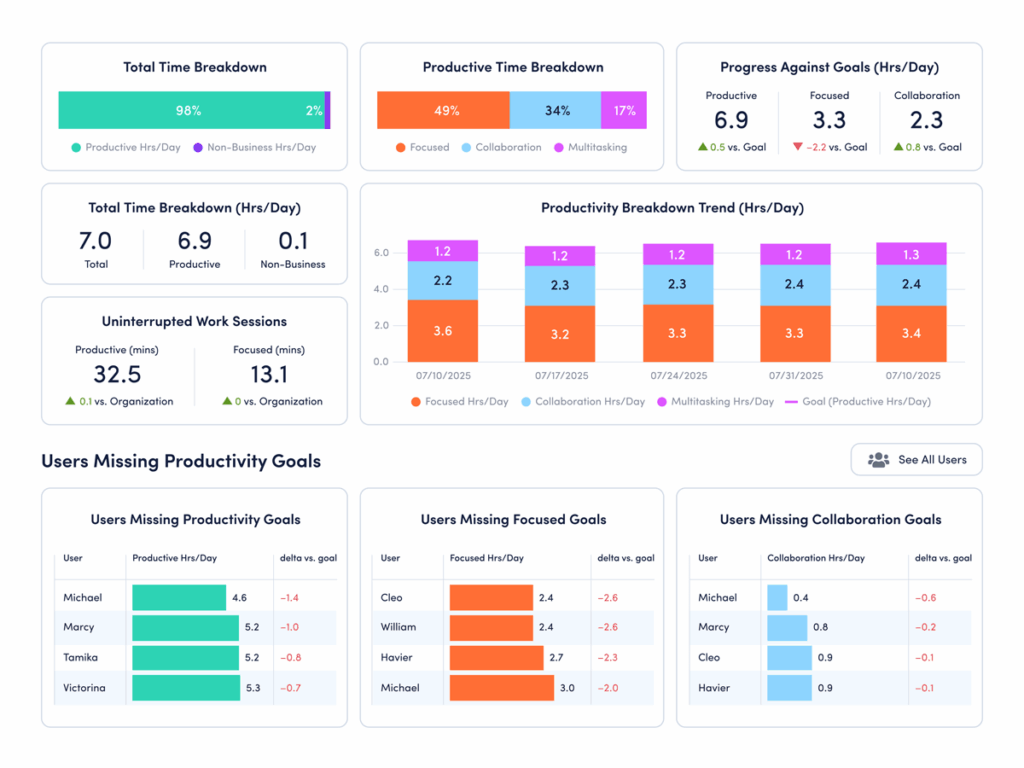
The average employee is productive for 6 hours 36 minutes a day — a 5% increase from 2023 to 2025. But at the same time, the average focus session length dropped 9% to just 13 minutes 7 seconds. This means employees stay on task for less than 14 minutes before a ping, chat, email, meeting or other distraction interrupts them.
Why it matters: This focus fragmentation is not sustainable.
While the productivity gains are real, the rise of multitasking and context switching threatens to erode them. Most employees are interrupted 275 times a day, and more than half say distractions are the biggest barrier to getting work done.
How to compare your data: Use ActivTrak’s Focus & Collaboration dashboard (available on the Professional plan):
- Navigate to Productivity Optimization > Focus & Collaboration.
- Under “Uninterrupted Work Sessions,” look at “Focused (mins).”
How to interpret the data:
- If focused minutes are significantly above 13.7: Congrats! Your employees have longer uninterrupted work sessions than the current benchmark. This indicates a healthy balance of collaboration and deep work. Protect it. Look at meeting schedules, notification settings and expectations for how quickly people respond. This helps ensure interruptions don’t slowly creep in.
- If focused minutes are significantly below 13.7: Your teams likely struggle with frequent interruptions. Start by identifying where attention breaks down — meetings, messaging tools or constant app switching. Then experiment with protected focus blocks, fewer recurring meetings and clearer expectations on how quickly to respond.
- If focused minutes are in the range of 13 to 14 minutes: Your organization sits close to the current benchmark. However, the new average of 13 minutes 7 seconds is still a concerning drop from previous years in our study. Look at this as an opportunity to change course before distractions continue to increase.
Pro tip: Not on the Professional plan? Navigate to Technology & AI Usage > Website Usage and Technology & AI Usage > Application Usage. If collaboration tools like Slack, Teams, Zoom, Google Calendar and Outlook top the lists, this is a sign your employees spend a lot of time in a distracted state.
2. Do you have chronically underutilized employees?
The finding: A record number of employees are underchallenged.
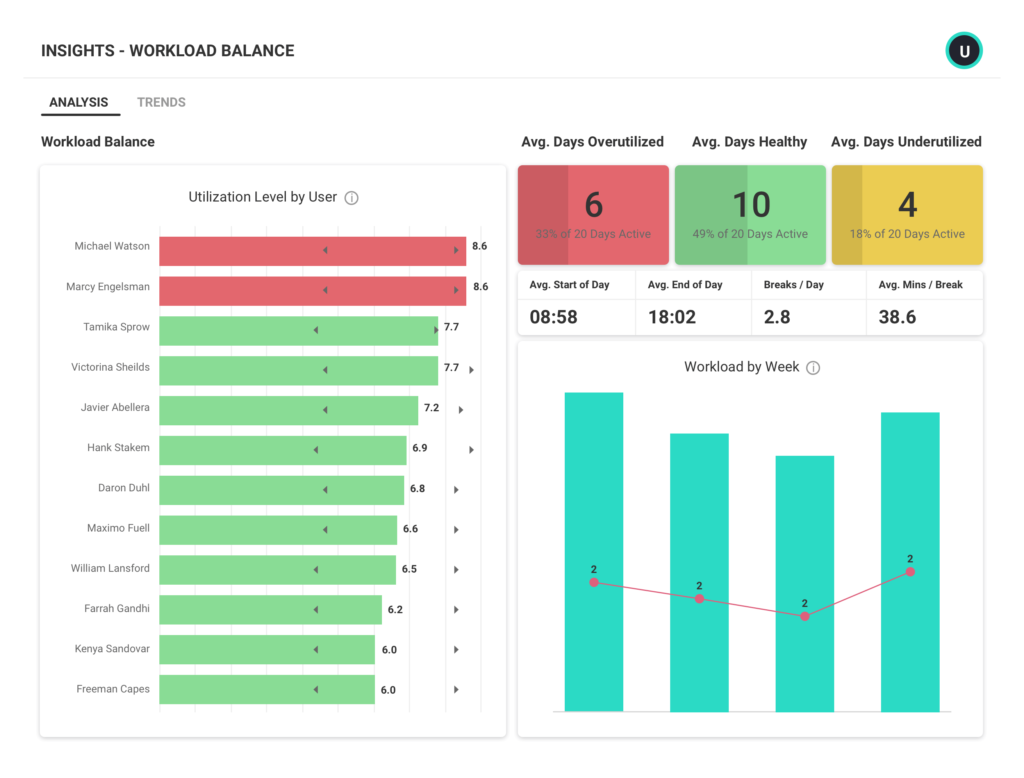
The good news? Only 5% of employees are at risk of burnout. While this is a big win, another silent productivity killer is taking its place. One in four employees spends more than 75% of the year in an underutilized state. They’re chronically under-challenged and under-deployed — two of the biggest predictors of disengagement.
Why it matters: Organizations that overinvested in alleviating burnout must now course-correct to prevent disengagement.
While burnout dominated post-pandemic workforce concerns, the data suggests it’s time to shift that conversation to underutilization and disengagement. Nearly 70% of U.S. employees say their skills go unused at work — a problem that consistently leads to high turnover. The resulting disengagement and attrition cost a median-sized S&P 500 company up to $355 million a year in lost productivity.
How to compare your data: Use ActivTrak’s Workload Balance dashboard (available on the Professional plan):
- Navigate to Productivity Optimization > Workload Balance.
- Under “Activity Date,” set your filter to “Last 365 Days.”
How to interpret the data:
- If more than 23% of employees are underutilized: Don’t wait. This level of untapped capacity often leads to disengagement and turnover. Start by identifying where skills go unused. Then rebalance workloads, assign stretch projects or redirect talent to high-impact initiatives.
- If less than 23% are underutilized: Your teams are in a healthy utilization range. While some employees may need more challenges, work is largely aligned with employee skills. Continue watching the trend and look for ways to invest freed capacity in innovation, training or strategic projects.
- If 23% are underutilized: You’re aligned with the current benchmark. However, this still represents a meaningful amount of unused capacity. Even small improvements in workload alignment could unlock significant productivity gains.
Pro tip: Use Workforce Utilization (available on the Professional plan) to quantify the financial risk of untapped capacity in actual dollars.
3. Where do your teams stand on AI adoption?
The finding: The vast majority of employees now use AI. But only a handful have figured out how to use it to boost productivity.
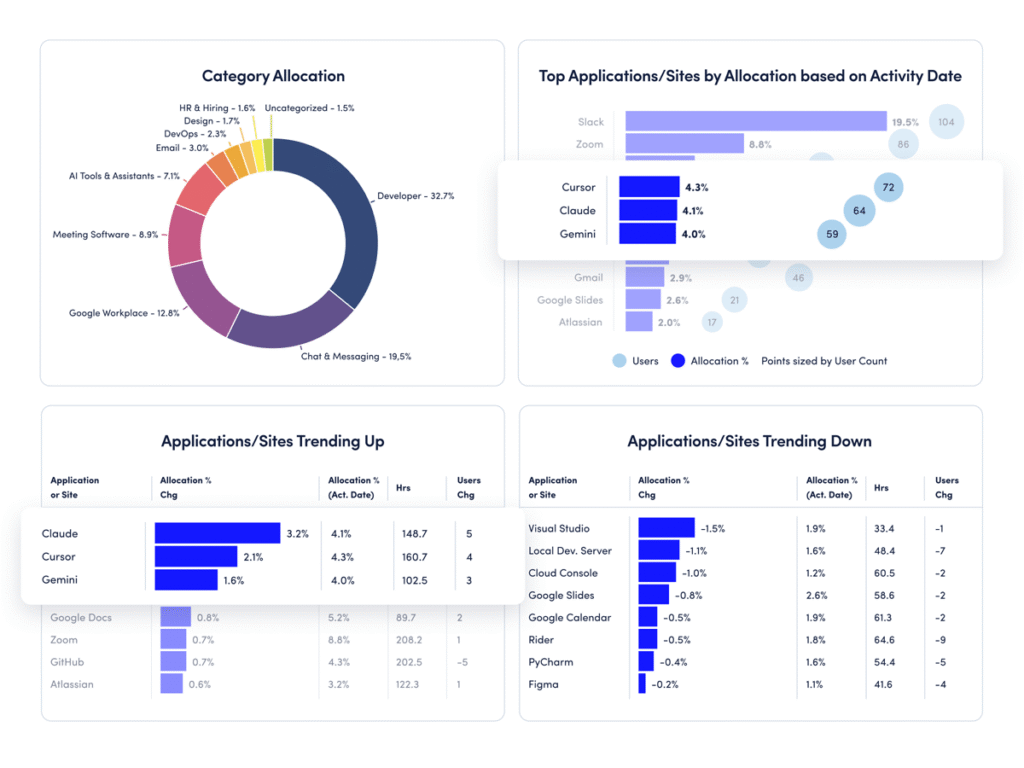
The majority (80%) of employees now use AI tools — up from 53% two years ago — but most are still experimenting. Workers who spend 7–10% of their total work hours in AI tools are the most productive, but only 3% of users currently fall within this range. The largest segment (57%) spends less than 1% of their work time using AI.
Why it matters: Most organizations are adopting AI. But few know how to optimize or operationalize it.
While leaders expect to double AI spend in 2026, most still aren’t sure how to embed it in daily workflows. Even more concerning: More than 90% of organizations will continue to invest in AI even if early initiatives don’t pay off. To benefit from AI, executives need more visibility into what tools employees already use — and how that use impacts work.
How to compare your data: Use ActivTrak’s Technology Utilization dashboard (available on the Professional plan):
- Navigate to Executive Summaries > Technology Utilization.
- Change the “Date Range” to “Last 90 Days.”
How to interpret the data:
- If employees spend less than 7% of their time in AI tools: This is consistent with the current baseline. Many organizations remain in experimentation mode, and most users spend less than 1% of their time in AI tools. Identify where AI actually saves time, and encourage targeted adoption within specific workflows.
- If employees spend more than 10% of their time in AI tools: Your organization is ahead of the curve. This indicates your workforce is moving beyond experimentation and ready to embrace full-scale automation. Looking ahead, make AI governance a top priority to ensure compliance.
- If employees spend 7-10% of their time in AI tools: This is the sweet spot. ActivTrak’s report benchmarks indicate employees who devote 7-10% of total work hours to AI tools are more productive than their peers. As a next step, look for ways to set realistic productivity baselines.
Pro tip: Not on the Professional plan? Navigate to Technology & AI Usage > Category Usage, then scroll down to AI Tools & Assistants. And stay tuned for ActivTrak’s AI Adoption & Impact dashboard add-on, coming mid-2026. This new feature will measure AI adoption maturity across your workforce, help you identify where to invest next and show where your AI tools drive real productivity gains.
Stay tuned for additional guidance on AI impact, workday patterns and more
The 2026 State of the Workplace report reveals an important shift. Work is faster, denser and more fragmented. But while productivity is rising, the conditions that sustain it — focus, alignment and balance — are changing.
The good news? You don’t have to guess at how these trends affect your organization.
In the coming weeks, we’ll release additional comparison guides exploring more benchmarks. Each will focus on a subset of important findings and explain exactly how to compare your own workforce data.
Check back for weekly updates. Bookmark this page to follow along as each new guide is released.
Want updates delivered straight to your inbox? Sign up to be notified as new comparison guides are released.