
(This is part seven of an ongoing series. Check here for weekly updates.)
In part six of this series, we looked at the latest trends in weekend work. Next, we examine remote work data — and how your numbers compare to the latest benchmarks.
(Reminder: If you’re new to ActivTrak, sign up for a free trial to collect data and access Professional features for 14 days.)
1. What is your remote-only status?
The finding: Remote-first is now the dominant workforce model.
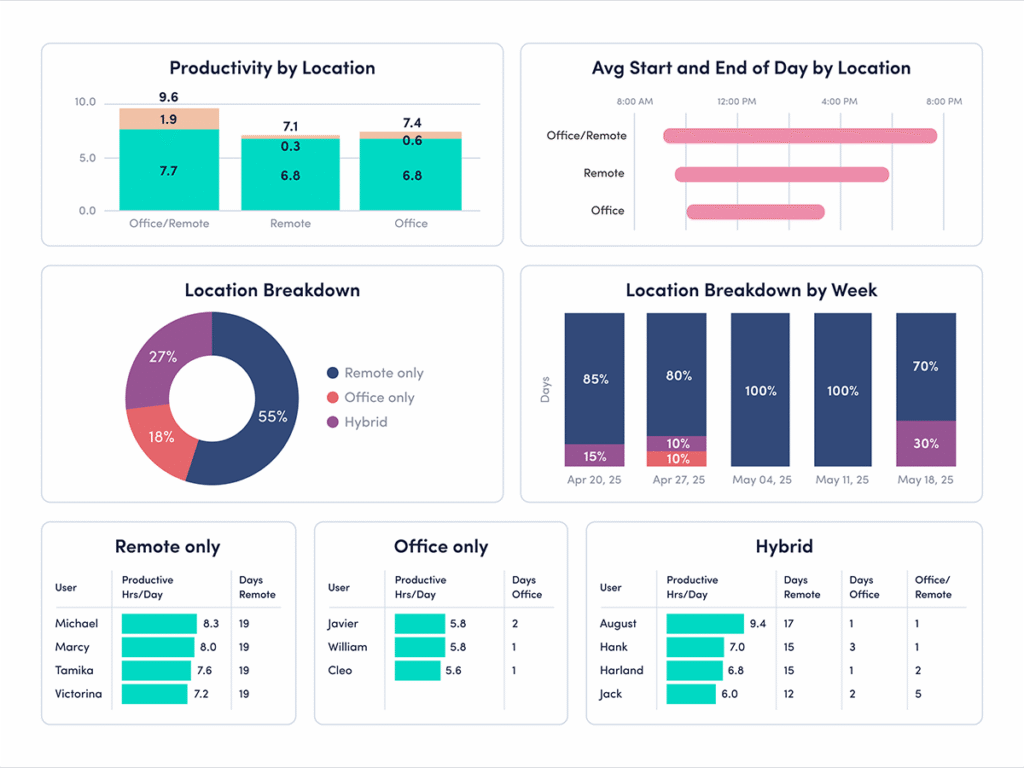
Nearly half of organizations (47%) currently operate as remote-first, making this the most common workforce model today. That’s nearly double the share of office-first or structured hybrid models, each at 25%. In addition, remote-first companies have the highest share of employees in a healthy utilization range at 76%. This data suggests distributed teams are finding ways to balance productivity and workload effectively by allowing at least some employees to work from home full-time.
Why it matters: Knowing where employees work helps you design the right work structure.
Monitoring how many employees are fully remote, especially at enterprise organizations where it’s harder to track thousands of workers, is important. Why? Because it allows leaders to prepare for both opportunities and risks. On the one hand, 31% of fully remote employees are likely to be engaged — more than hybrid and on-site workers. On the other, only 36% describe themselves as truly thriving. They’re also more likely to be actively job hunting. This contrast highlights a key point: Knowing where your employees work, and where they work most often, allows you to create the support and conditions they need to perform their best.
How to compare your data: Use ActivTrak’s Productivity by Location dashboard (available on the Professional plan).
- Navigate to Productivity Optimization > Productivity by Location.
- Change Activity Date to “Last 180 Days.”
How to interpret the data:
- If more than half of employees are remote-only: Your organization leans heavily into remote work, and is above the latest cross-industry benchmark. This flexibility can support efficiency — but it also requires strong systems for communication, alignment and engagement. Pay close attention to how work gets done, not just where it happens.
- If less than half of employees are remote-only: Remote work plays a smaller role in your operating model compared to the latest benchmark. That’s not a disadvantage, but it does mean your results may be driven more by in-office or hybrid dynamics. Compare performance across work types to understand what’s working best.
- If 47%-50% of employees are remote-only: You’re aligned with the current benchmark, but it’s important to look beyond the percentage. Identify which teams perform best in a remote setting, and what conditions help them succeed, so you can apply those insights more broadly.
2. How many hours a day are your remote employees productive?
The finding: Remote employees log the most productive time.
Across industries, the latest benchmark shows remote-only employees average 7 hours 1 minute of productive time per day. That’s 38 minutes more than office-first employees. They also record the longest uninterrupted work sessions, with remote-first organizations averaging 33 minutes of focused, productive work stretches. This suggests remote environments may better support sustained, distraction-free work.
Why it matters: Remote work can improve focus, but only with the right structure.
Remote environments often reduce common workplace interruptions, giving employees more time to focus on meaningful work. Fewer in-person disruptions and more control over the workday often leads to longer productive sessions and higher output. But these gains aren’t automatic. Without clear expectations and strong communication practices, remote work can just as easily lead to overwork or blurred boundaries. The key is understanding how productivity shows up in your environment — and ensuring it’s both effective and sustainable.
How to compare your data: Use ActivTrak’s Productivity by Location dashboard (available on the Professional plan).
- Navigate to Productivity Optimization > Productivity by Location.
- Change Activity Date to “Last 180 Days.”
How to interpret the data:
- If remote-only employees average more than 7 hours of productive time a day: Your remote teams are above the current benchmark for productivity. That’s a strong signal, but it’s worth looking deeper. Are employees maintaining healthy work patterns, or is higher output tied to longer days and fewer breaks? Sustainable productivity should balance output with well-being.
- If remote-only employees average less than 7 hours of productive time a day: This average is below the current benchmark, and may point to gaps in focus, communication or workflow clarity. Look for friction points — unclear priorities, too many tools or interruptions — and address them to help employees stay on track.
- If remote-only employees average 7 hours of productive time a day: You’re aligned with the current benchmark. The next step is optimization. Break this data down by team or role to see where remote workers perform best and where there’s room to improve. Focus on maintaining consistency across your workforce.
Stay tuned for more State of the Workplace benchmarking insights
Remote work plays a central role in how many modern organizations operate. And the data shows it’s working — in many cases, remote employees are highly productive and able to sustain focused work throughout the day.
But productivity alone doesn’t tell the full story. Where employees work is only one piece of the equation. What matters most is how work is structured and whether employees have the clarity, support and conditions they need to perform at their best.
This is why it’s so important to use work data when making decisions. When you understand how remote work shows up across your organization, you can identify what’s driving strong performance and where to make adjustments.
Next up, we’ll compare your ActivTrak data to the latest in-office and hybrid work benchmarks.
Did you miss part six? Read it here.