Trusted by 9,500+ global brands and organizations
WORKPLACE EFFICIENCY
Measure the impact of digital and organizational change
Make data-driven decisions about workplace policy and technology investments with visibility into where and how employees work.
Learn how ActivTrak helps you:
- Optimize workplace policy with location-based productivity insights
- Learn how changes in your workplace impact your organization
- Make data-driven headcount and resource decisions
- Right-size technology investments and streamline workflows
- Connect workforce activity data to business results

June, 2021
LOCATION INSIGHTS
Optimize workplace policy with location-based productivity insights
See how much time employees spend working remotely, in-office and hybrid, and where they are most productive. Assess compliance with workplace policies and determine office space requirements.
Explore Location Insights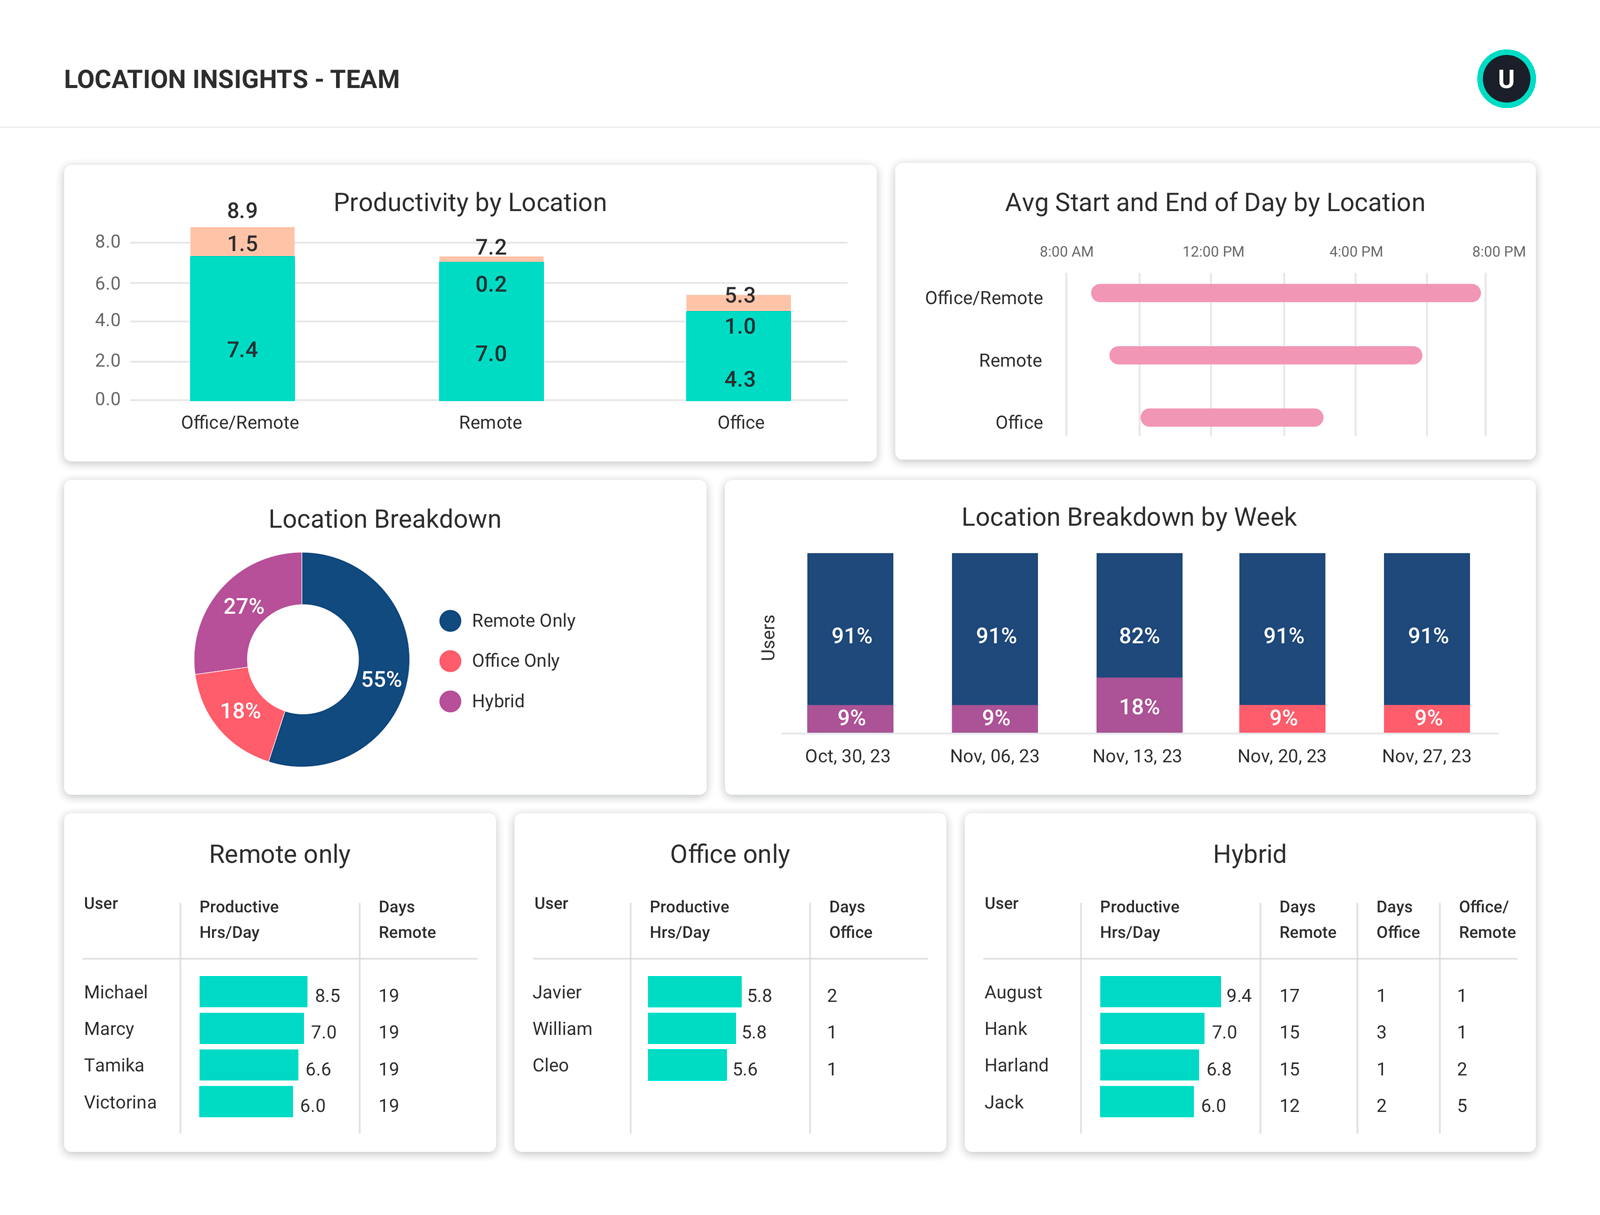
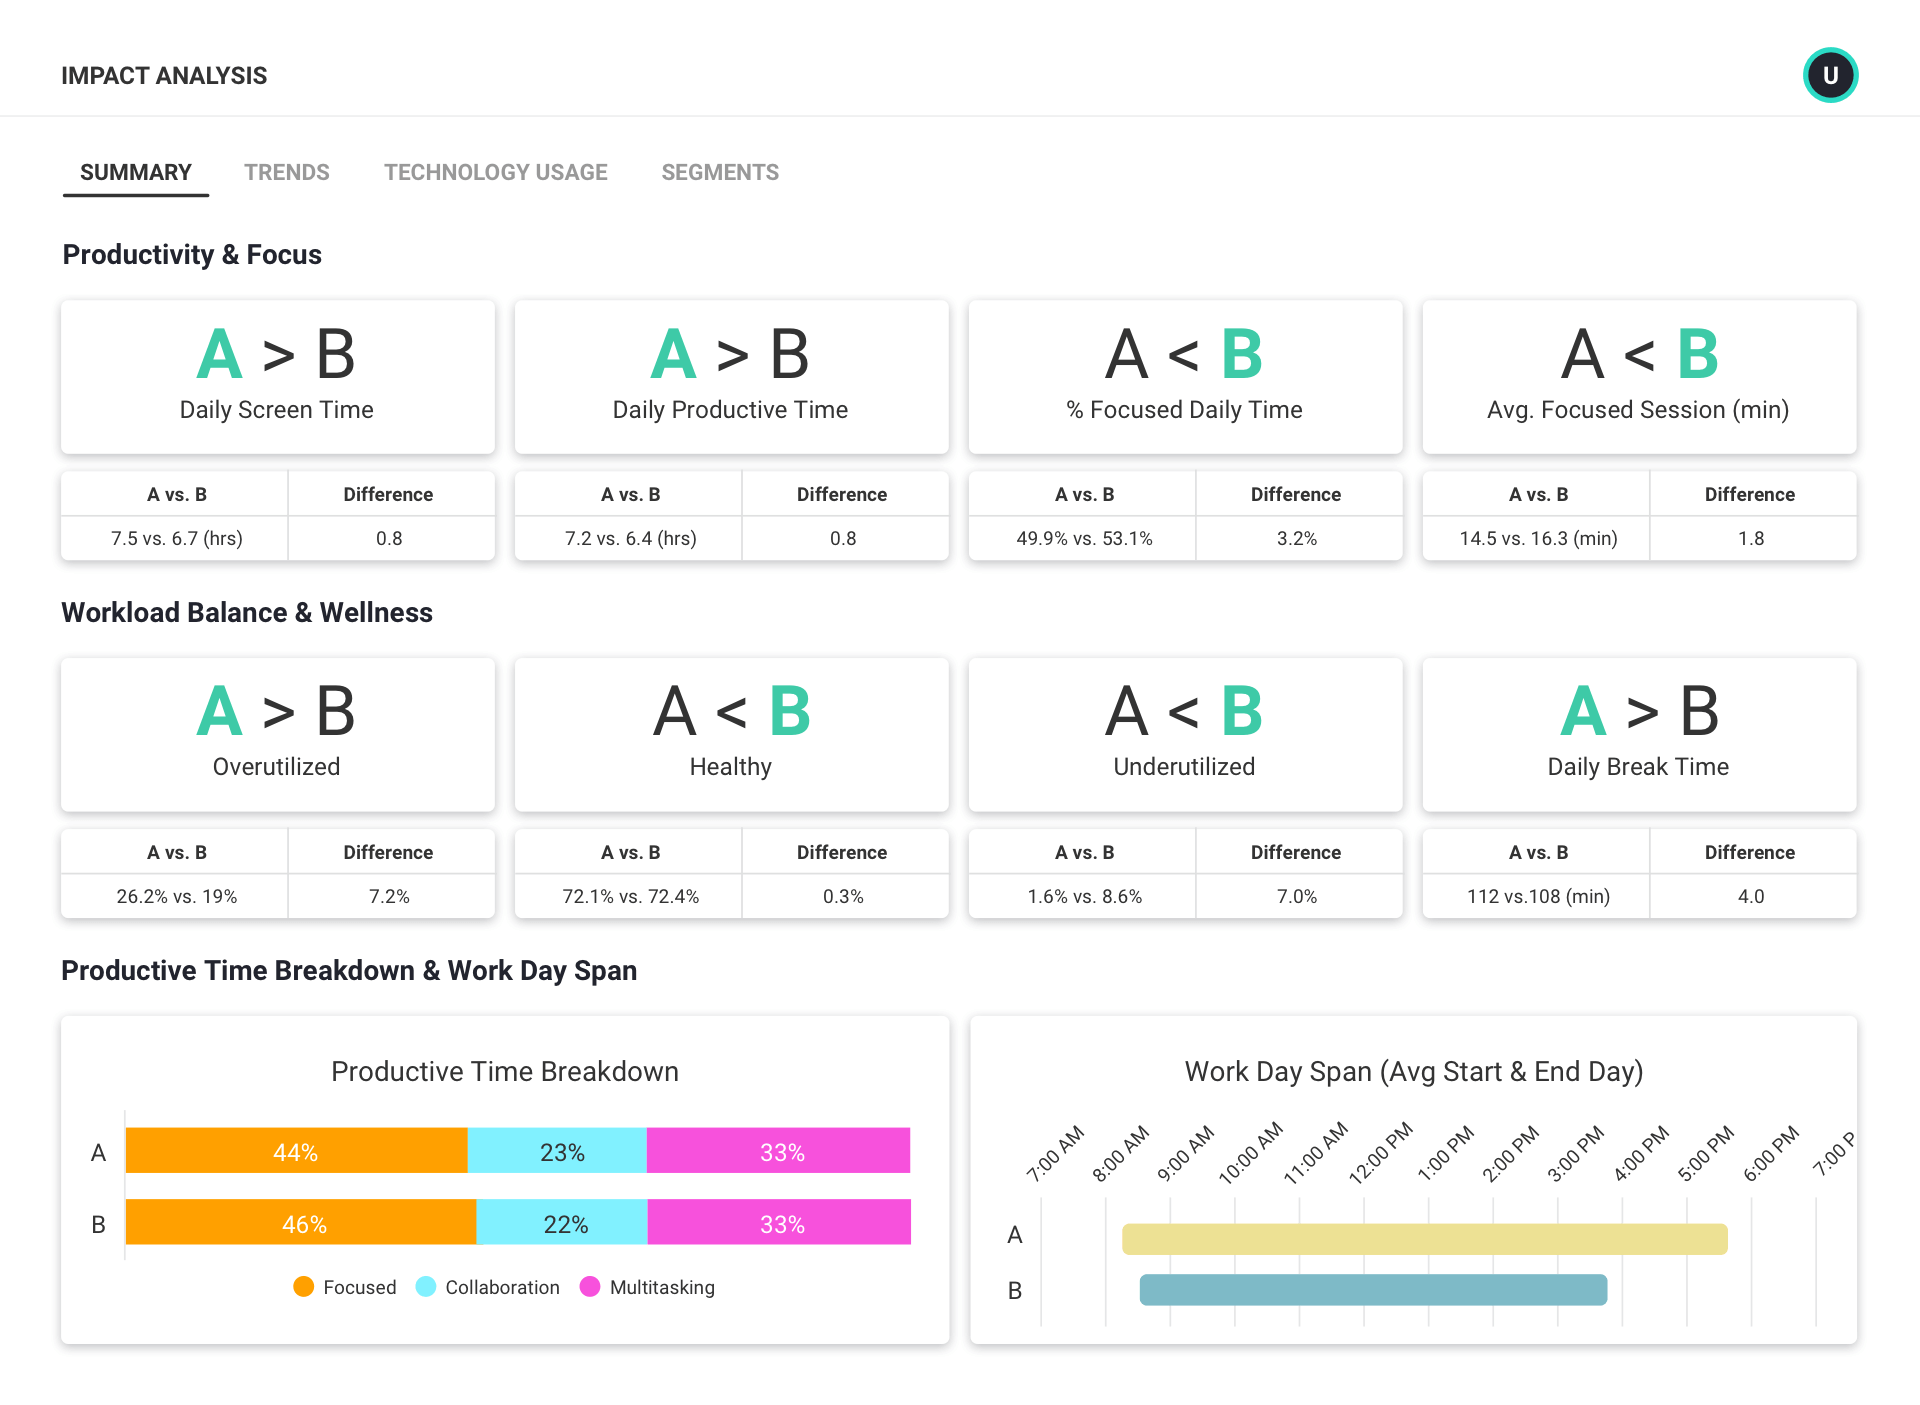
IMPACT ANALYSIS
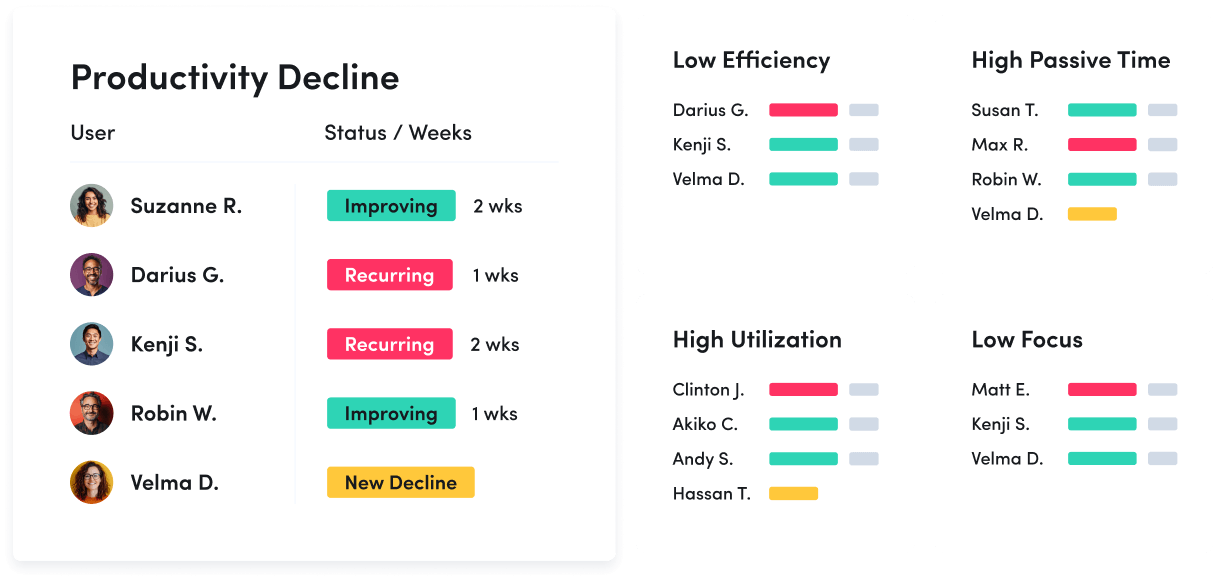
Learn how changes in your workplace impact your organization
See how adjustments like reductions in force, new hybrid work policies or technology implementations affect work habits and well-being.
- Perform before-and-after analyses and A/B tests
- Determine trends in employee productivity, workload, engagement and technology usage
- Quickly find and resolve negative effects
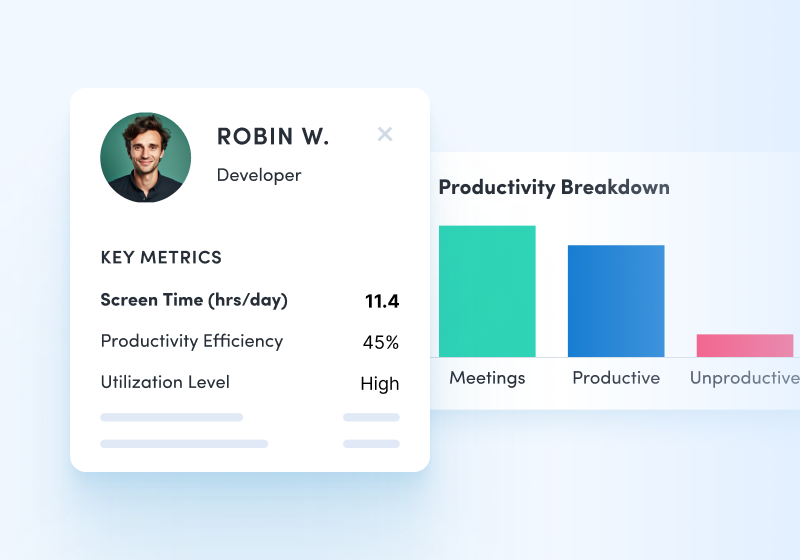
WORKFORCE CAPACITY PLANNING
Make data-driven decisions about headcount allocation and resource distribution
Analyze employee work capacity based on historical data to understand which team members are at or over capacity and which are under capacity in order to help distribute workload in the future.
Explore Workforce Capacity Planning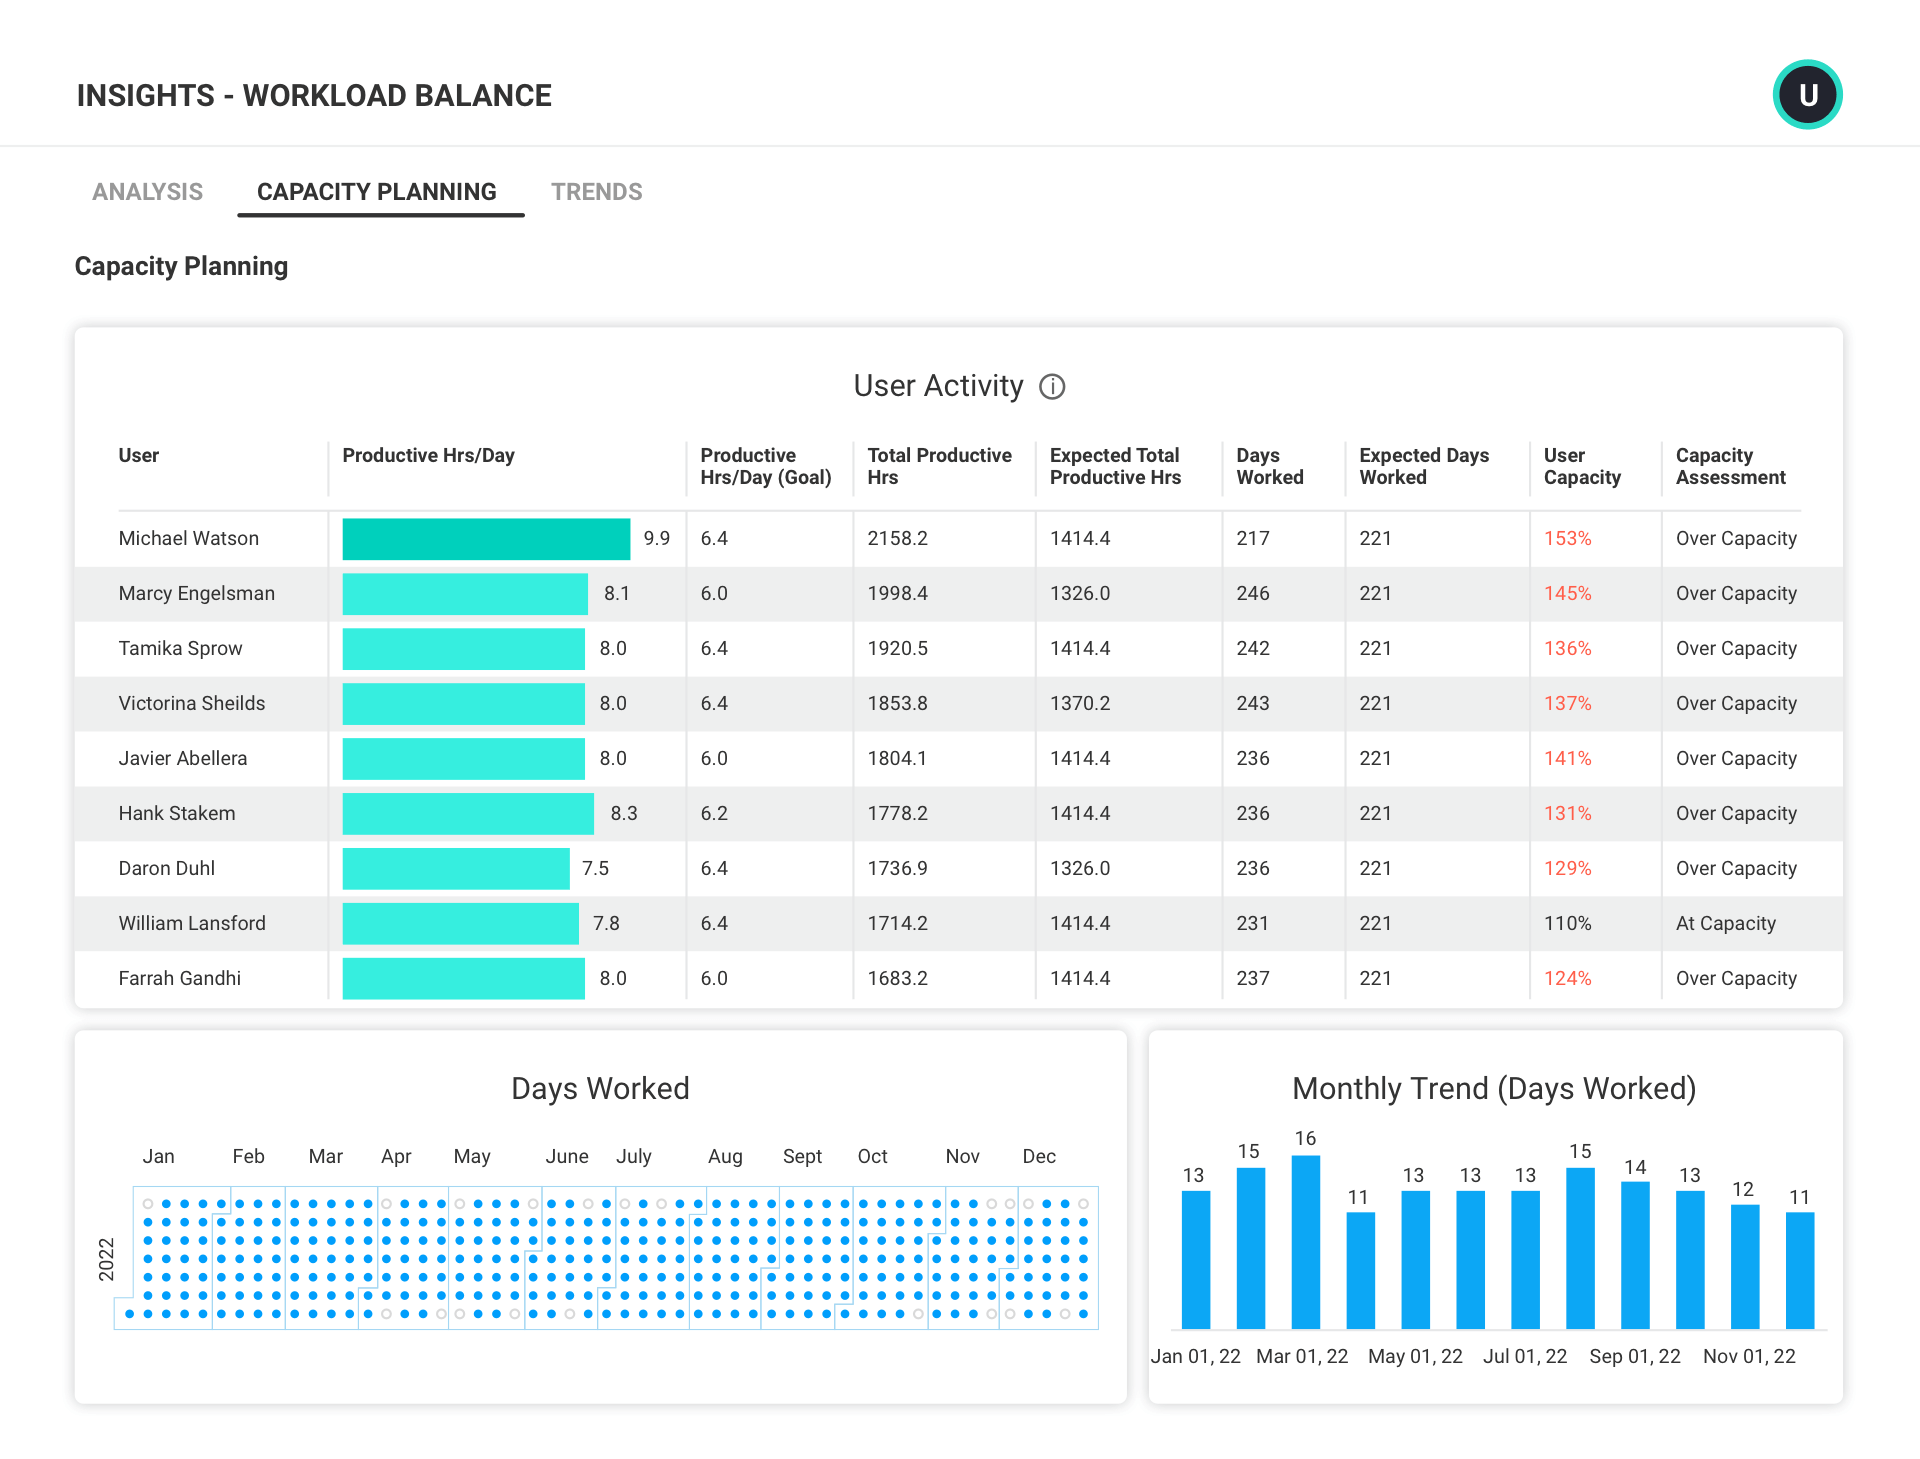
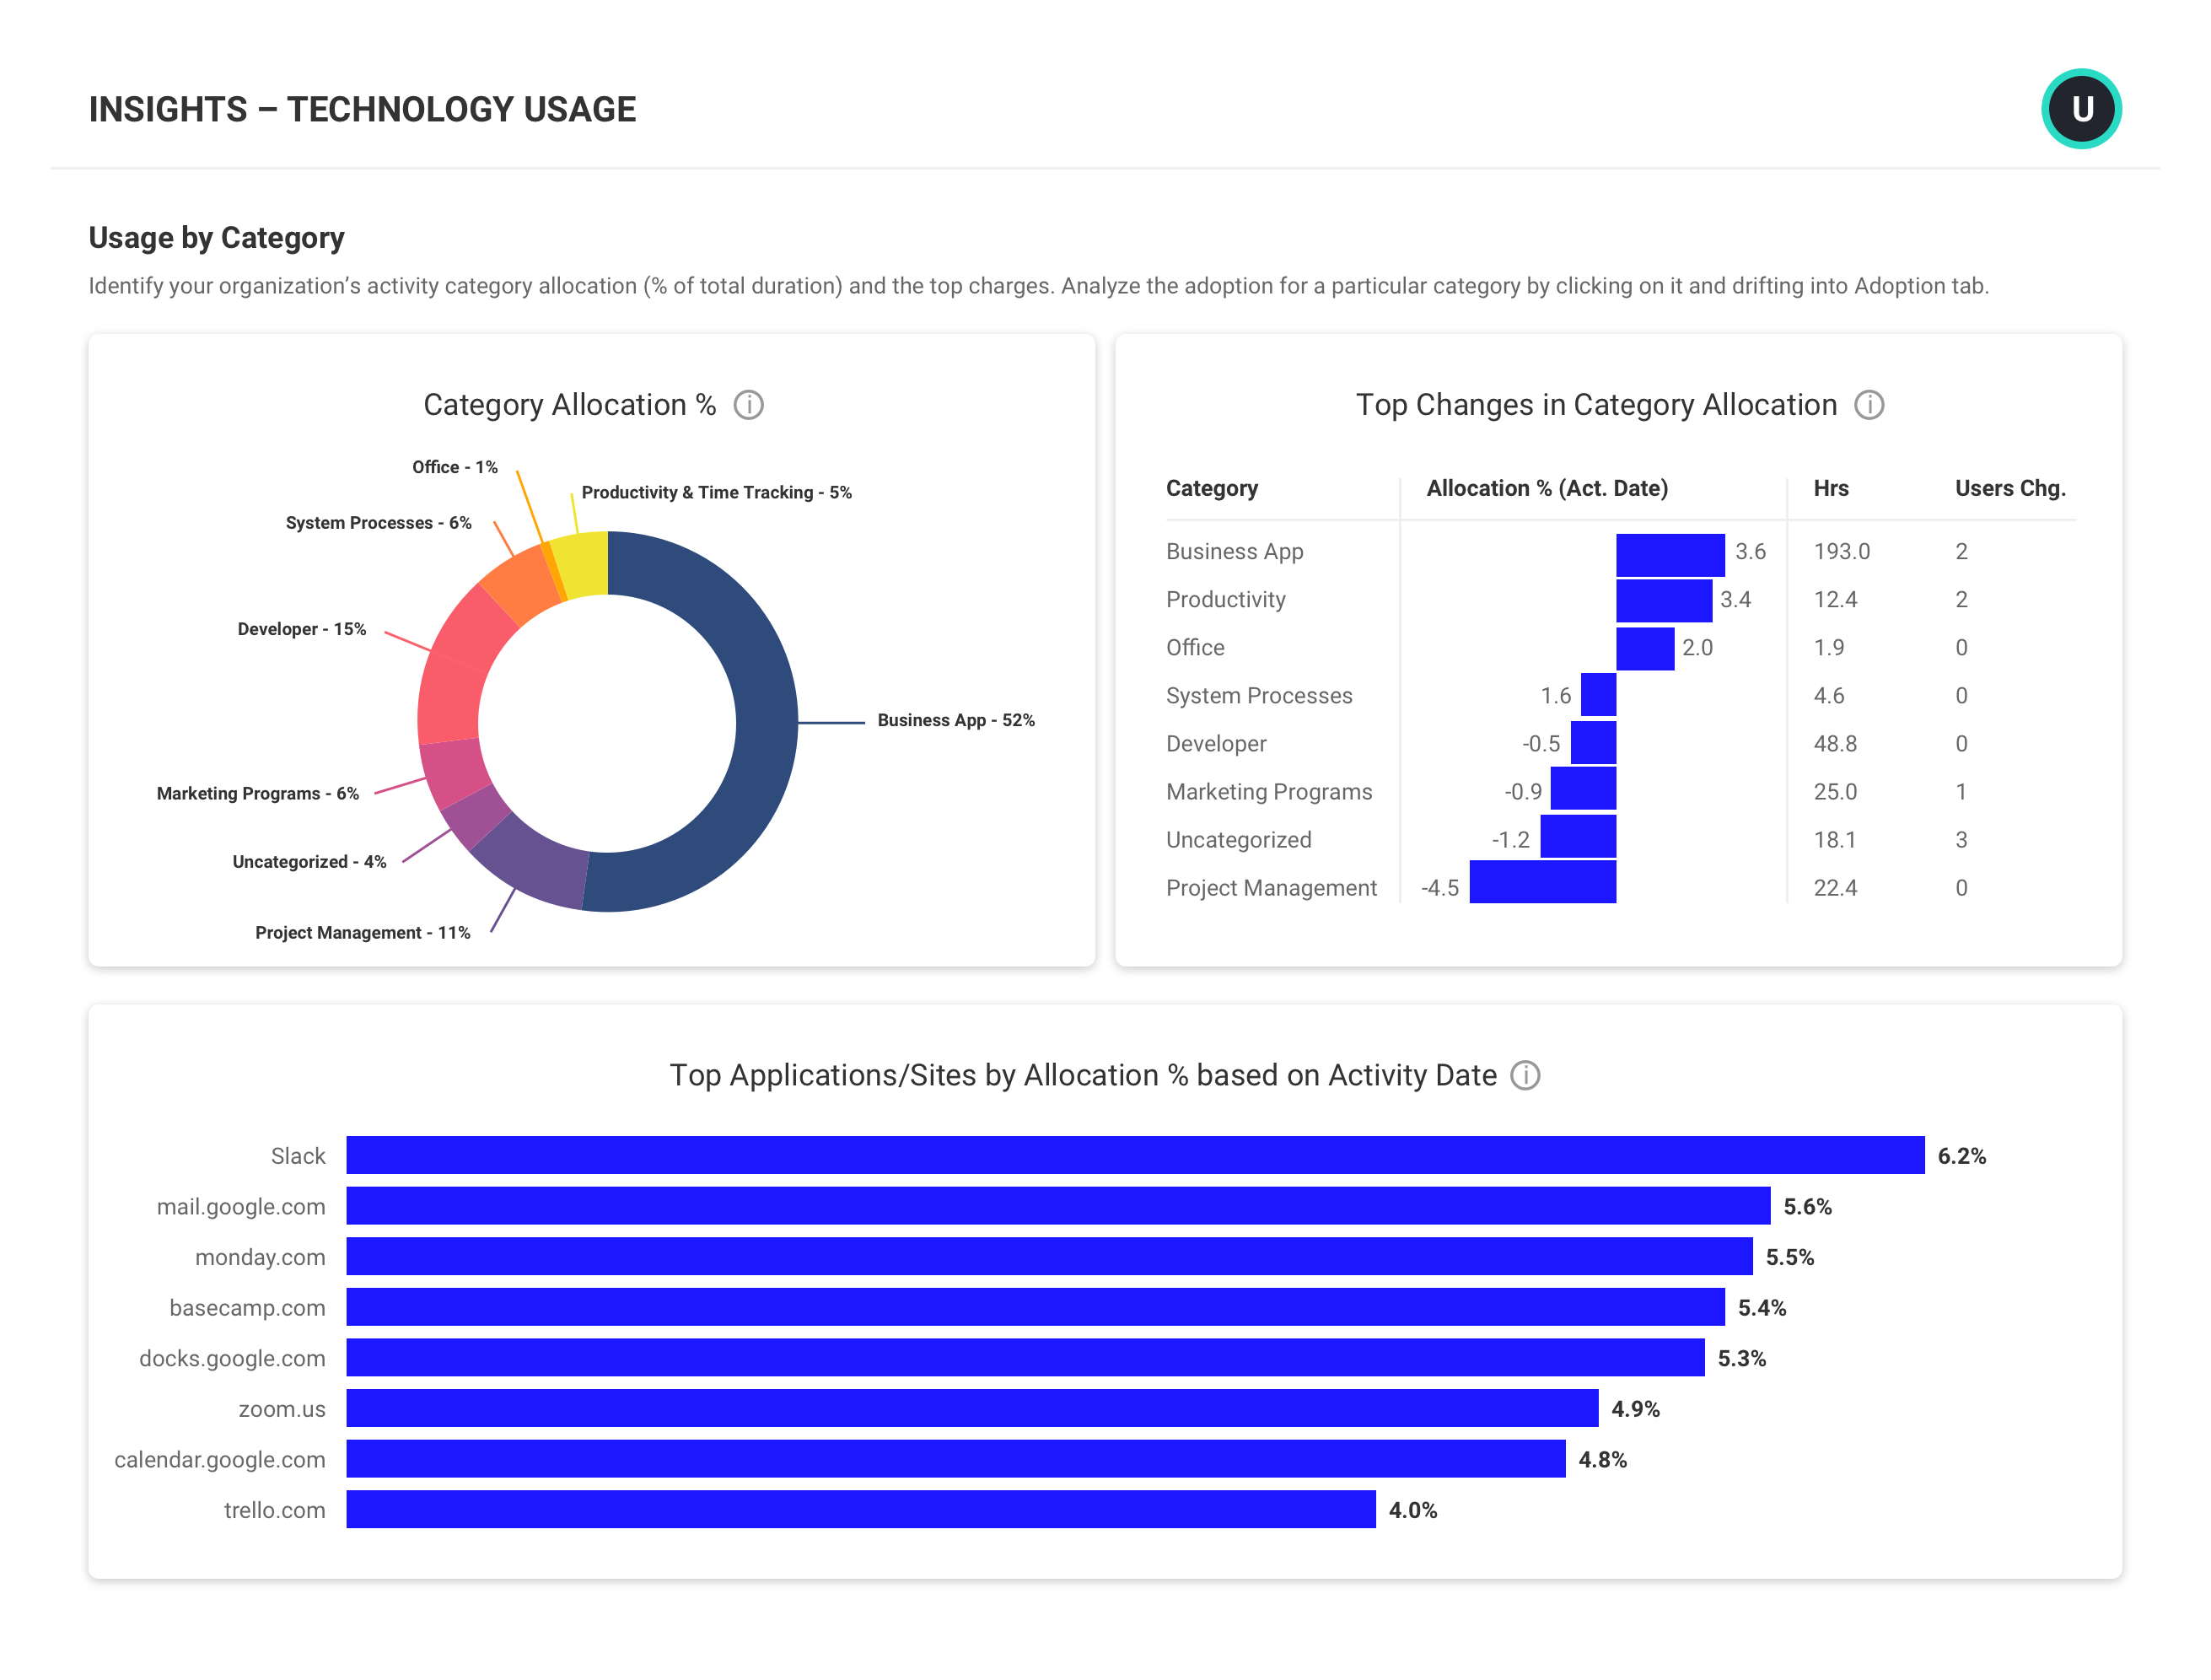
TECHNOLOGY USAGE & ADOPTION
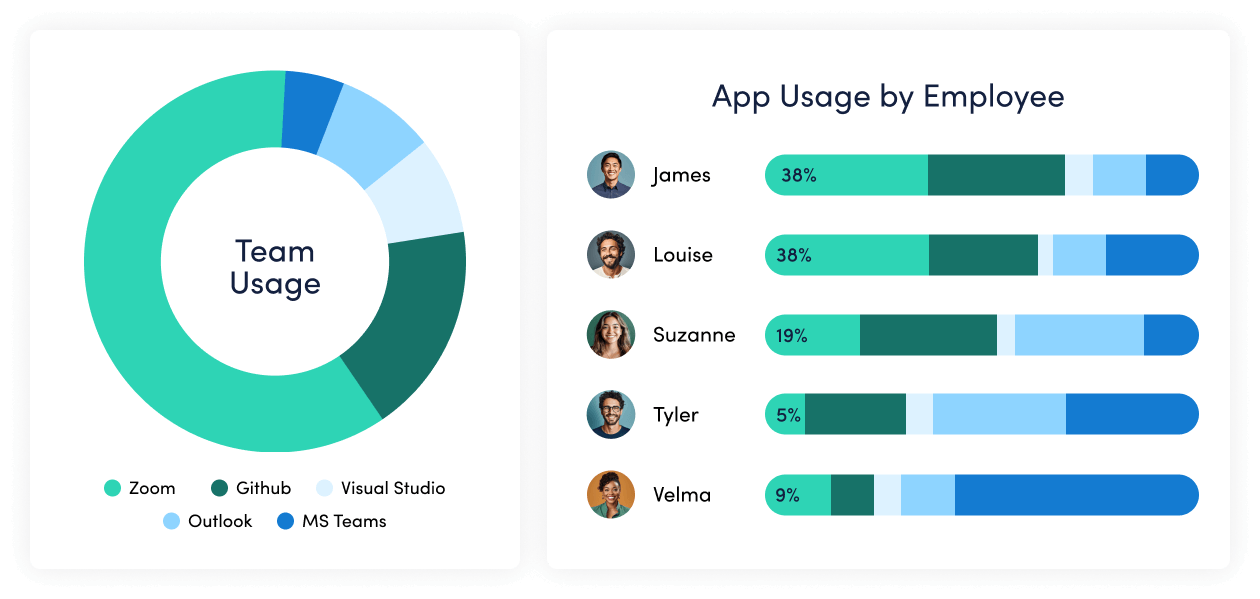
Right-size technology investments and streamline workflows
Gain insight into app and website usage to identify cost-saving opportunities from underutilized or redundant tools. Standardize workflows by ensuring team members are working within the same tools.
Explore technology usage & adoption
INTEGRATIONS
Connect workforce activity data to business results
Combine data from ActivTrak and other business tools — like Salesforce, ZenDesk and Lattice — to draw connections between workplace models, productivity trends and business results. Run custom queries or leverage pre-configured starter templates for Tableau, Power BI and Google Data Studio.
Explore integrations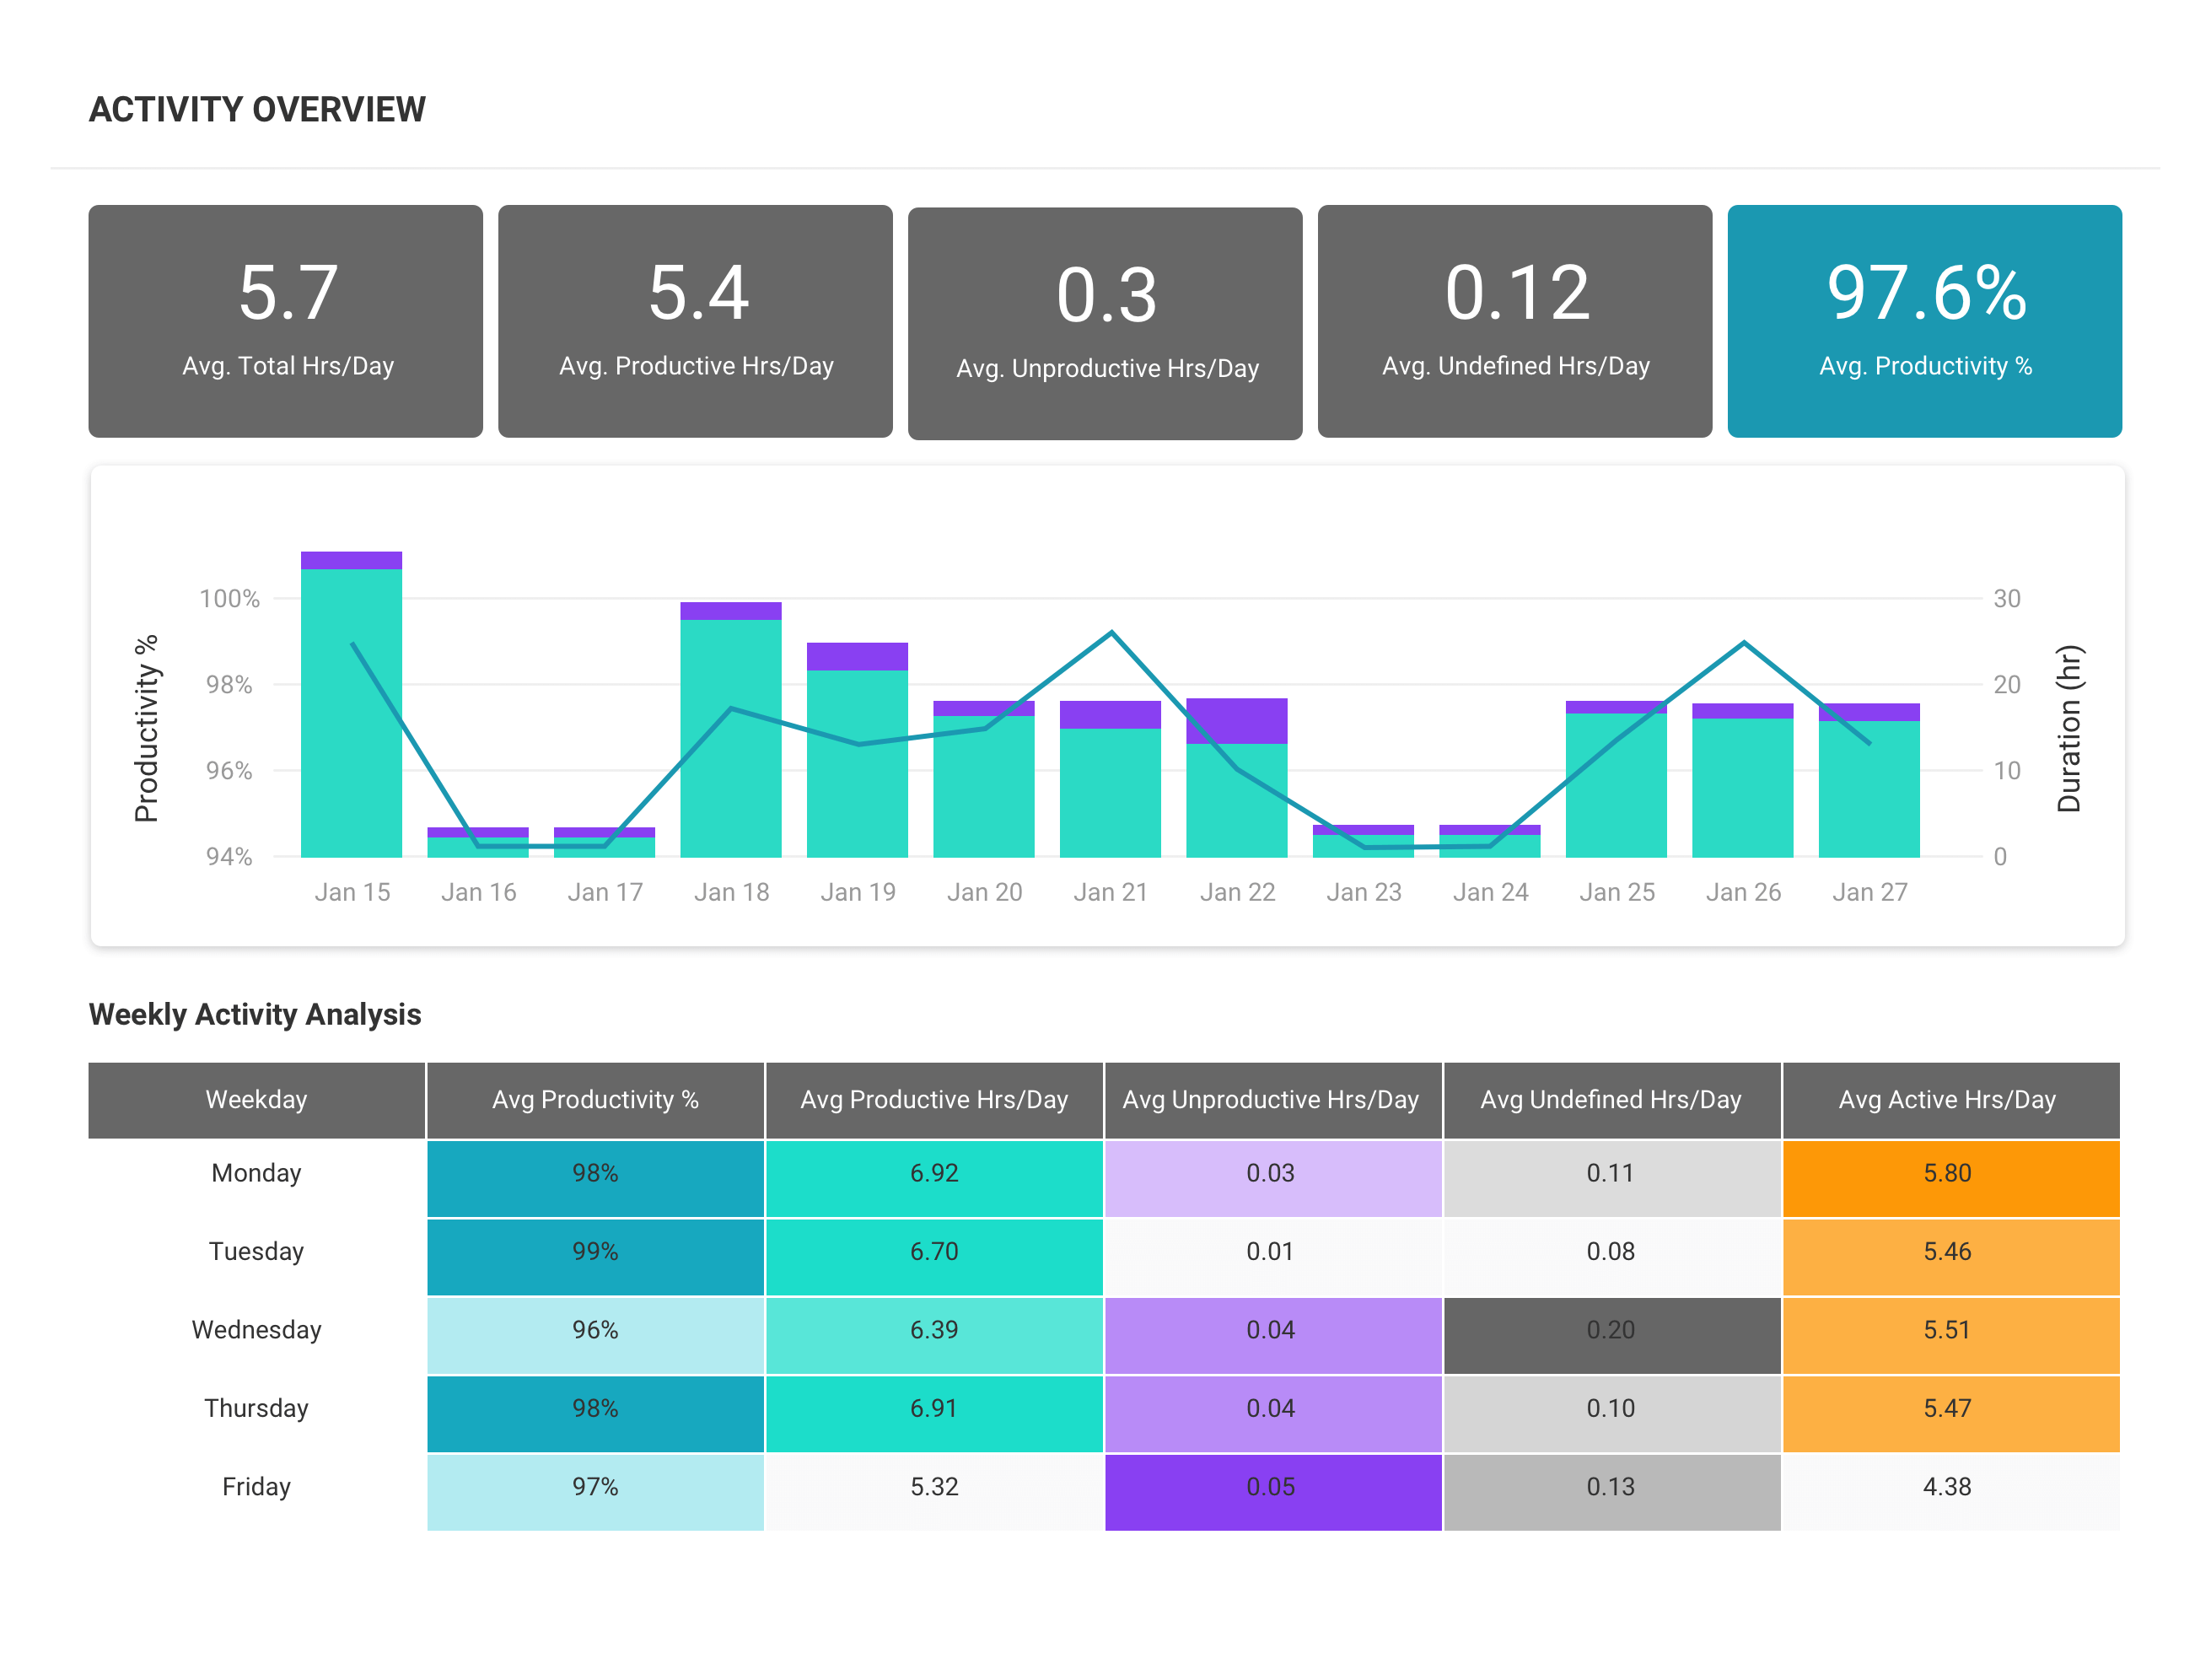
What you can do with ActivTrak
ActivTrak gives you the work intelligence to understand how work happens across people, tools and AI. Measure productivity, improve efficiency, and see how AI is changing workflows—so you can improve performance across your organization.
Executive Insights
Transform workforce data into boardroom-ready insights. See cross-team performance, identify hidden cost savings and make confident decisions that drive measurable business outcomes.
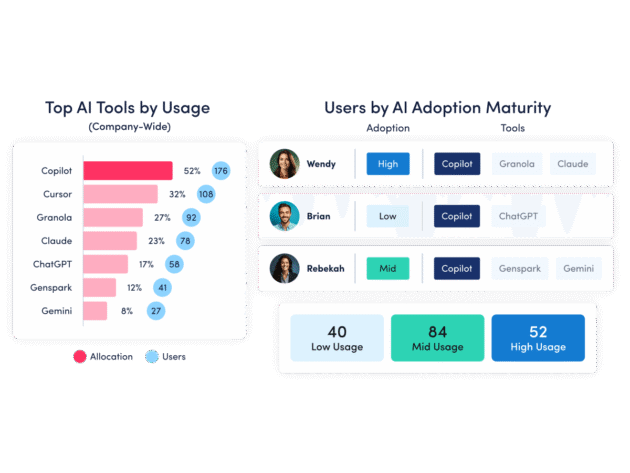
AI Insights
Understand how tools — and AI — are shaping work. See how applications and AI tools are used. Identify what’s driving value, where licenses are underused and how workflows are evolving.
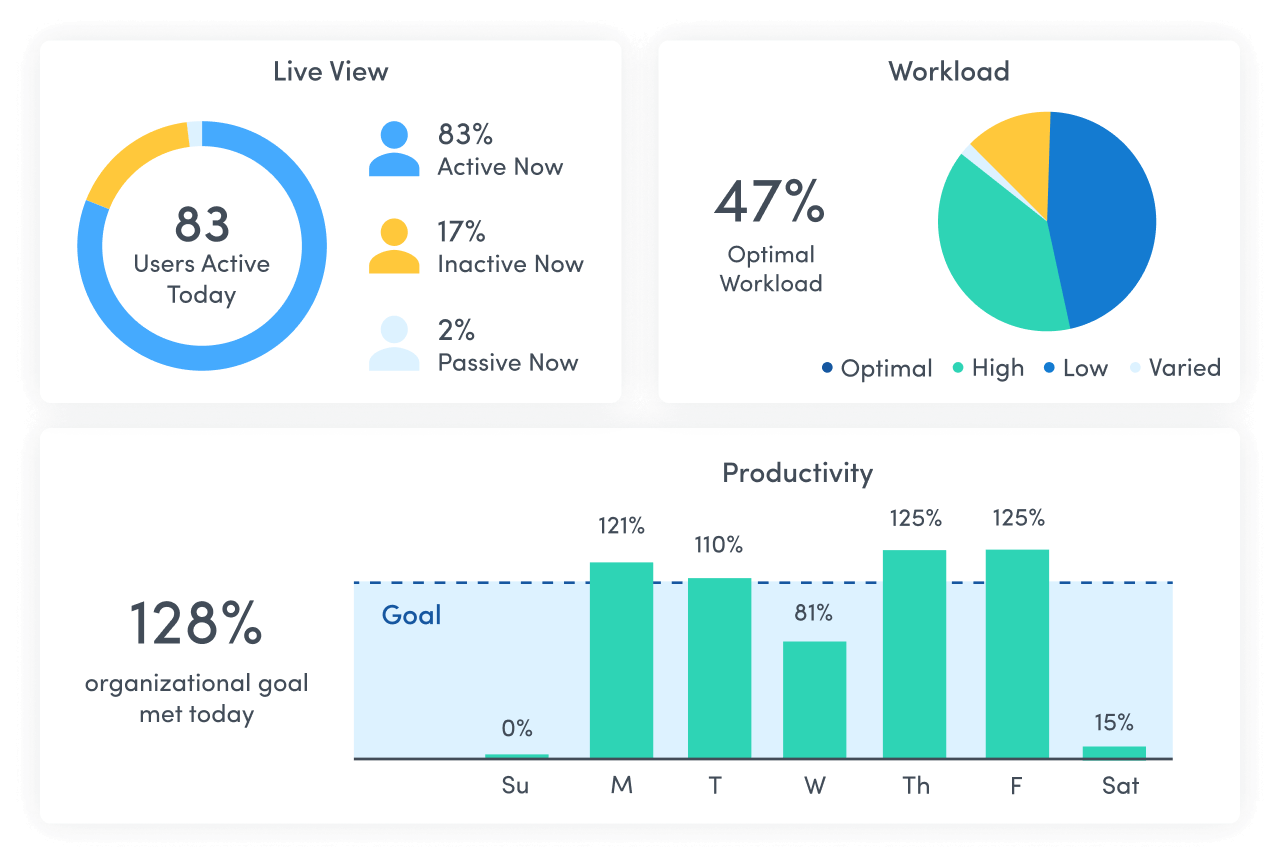
Workforce Management
Understand how work happens across your organization. Analyze work patterns across teams, roles and tools to see where time goes, where friction exists and where performance can improve.
Productivity Optimization
Improve performance with data-driven insight. Quantify productivity, identify capacity and help teams work in more effective, sustainable ways.
Technology Usage & Compliance
Optimize technology investments and ensure compliance. Understand which applications and websites employees use to drive adoption or cut costs, and enforce policies aimed at mitigating risk.
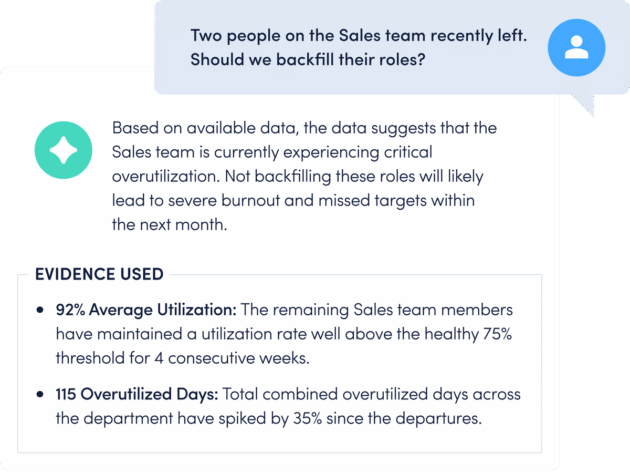
Work Advisor
Let ActivTrak’s conversational AI assistant pull directly from your data for evidenced-backed answers to pressing questions. Skip the manual analysis and get instant insights on work habits, staffing needs, attendance and more.
Connect work intelligence across your tech stack
Integrate existing tools to combine workforce activity, AI usage and business data for deeper, more actionable insights.
Workday
ADP

Microsoft Teams
Outlook

Google Calendar
ServiceNow
Zendesk
ChatGPT
Claude
Gemini
Microsoft Viva
Jira Software
Salesforce
Slack
How It Works
Capture behavioral activity
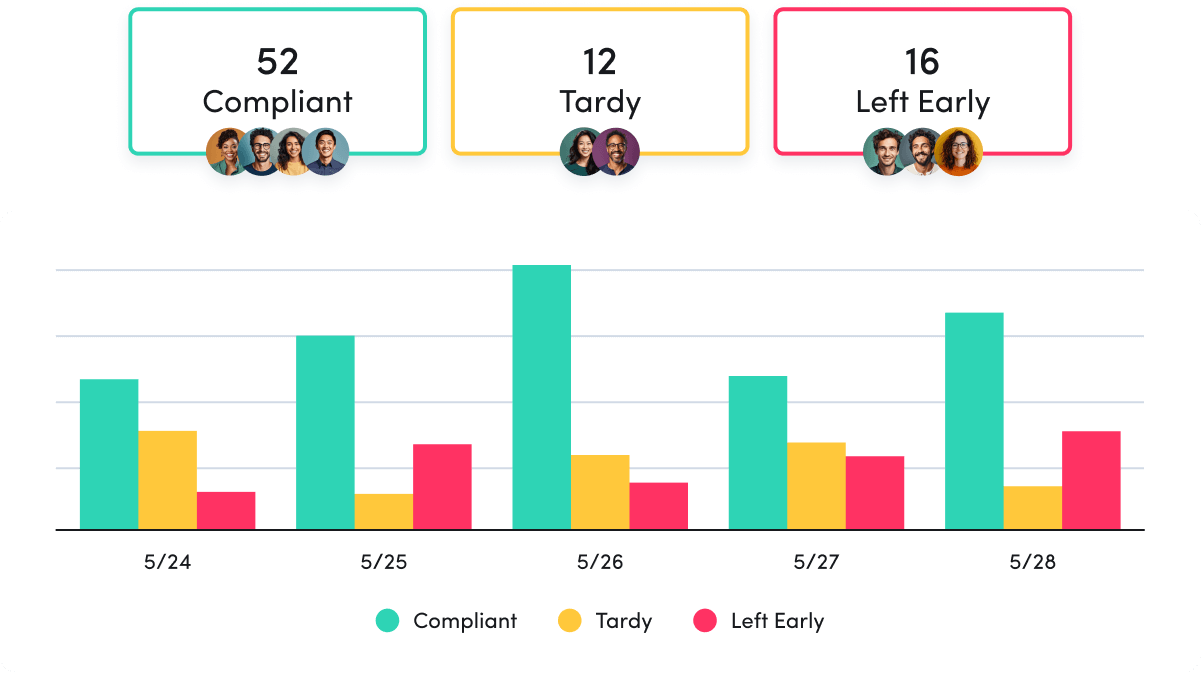
Capture behavioral activity including hours worked, schedule adherence, location policy compliance and app & website usage.
Analyze productivity trends
Analyze productivity trends on employee focus, engagement and utilization to make data-informed decisions on resource allocation.
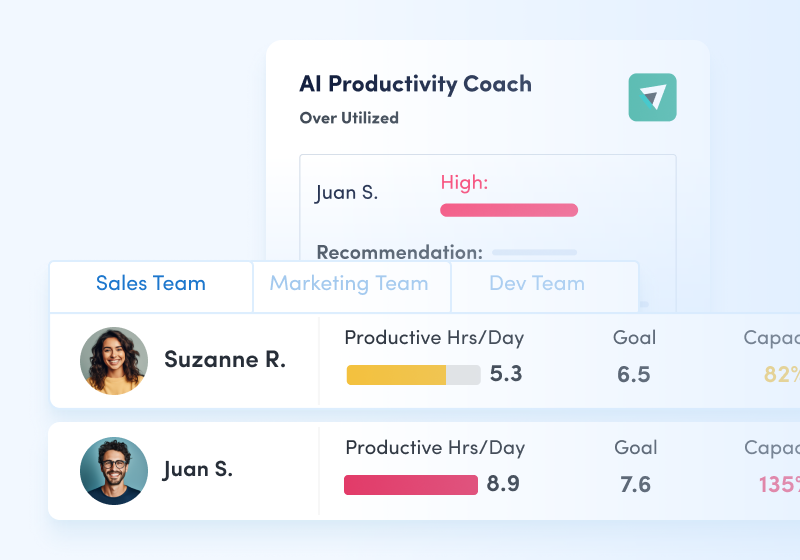
Optimize team performance
Optimize team performance with benchmarks, goal-tracking and AI coaching recommendations to improve workforce productivity.
See what customers say about ActivTrak
Powered by![]()
Getting started is easy. Be up and running in minutes.
FAQs about operational efficiency & compliance:
What is operational efficiency?
Operational efficiency is the relationship between an organization’s output and input, that when healthy, helps businesses cut down on unnecessary costs while increasing revenue. It’s what businesses strive to do – product a high-quality product at scale with as few resources as possible.
To decrease extraneous costs, the operations manager must be able to identify which processes in place are not needed. To do this, they need to be able to identify a baseline of operations.
How do you measure and improve operational efficiency?
Operational efficiency is calculated by dividing output (revenue, sales, cold calls, inbound leads, etc) by input (resources, man-hours, licenses, etc). As explained by Mankins in the Harvard Business Review, efficiency is a matter of producing the same output with less input.
In order to calculate efficiency, decision-makers need to determine which output and input variables are most appropriate for their organization. These variables are determined by their key performance indicators; the quantifiable metrics that reflect the health of an organization (dictionary). These can shed light on the overall direction of an organization by providing unbiased data about performance.
- Step 1: Record your performance and compare it against industry standards. This will give the organization a reference point to measure improvements.
- Step 2: Review the baseline of operations and identify the functions and goals within each department.
- Step 3: Understand the key players involved when it comes to executing those functions and goals.
- Step 4: Then review how much time it takes to achieve those goals and the quality of work done every step of the way.
- Step 5: Within each step, identify bottlenecks that make that process slower. Bottlenecks are any functions or steps that are unnecessary for completing the task at hand. For example, waiting a couple of days for another approval when two approvals are sufficient would be a bottleneck.
- Step 6: Remove those bottlenecks. One strategy to eliminate waste is the 5S method: Sort, Shine, Straighten, Standardize and Sustain. The leadership team needs to collaborate with other employees to ensure the right steps are taken.
- Step 7: Measure the performance and compare to the previous baseline of operations to track improvements. Make sure that the quality of work done along the way is not impaired.
- Step 8: Track performance by creating reports or a dashboard. Convene with your team at regular intervals to discuss performance and areas of improvement.
Note to the COO
There is much more to efficiency than simply cutting costs. It takes more strategy and forethought. A study done by PwC UK showed that two-thirds of UK businesses planned to cut costs over a 12-month period, but less than 30 percent of those organizations were able to reach their operational efficiency goals and only about a fifth of them could sustain the benefits of cutting costs over a period of three years.
What is ActivTrak’s approach to operational efficiency and employee monitoring?
Improving operational efficiency requires the collection and monitoring of data to establish a baseline upon which you can measure growth. We know employee monitoring and activity analysis have a mixed history and association with intrusive supervision and heavy oversight. ActivTrak intends to change that by focusing on the real output of employee monitoring: improved productivity and efficiency.
We designed ActivTrak from an ethical direction: with cornerstones of transparency, collaboration and informed insight. We’ve consciously developed a powerful platform that focuses on the collection of contextual data, avoiding intrusive employee monitoring technologies like keystroke logging and video surveillance. We invite the users of our product to join us on our journey to migrate employee monitoring from the age of surveillance and into the results and data-driven space that is productivity insights and operational efficiency.