Trusted by 9,500+ global brands and organizations
Make better decisions on how to run your team and optimize performance
Managers are expected to know it all: who does what, how, why and when. On top of that, they’re expected to motivate, engage, improve, coach and deliver – a challenging endeavor without the right analysis of key metrics.
ActivTrak delivers the management analytics you need to:
- Track team availability and productivity with real-time insights
- Empower teams to do their best work & achieve big goals
- Understand how & where your teams work
- Empower your team’s potential & drive performance
- Engage everyone, everywhere

“The data and insight provided by the built-in dashboards is everything we wanted and more, and our employees enjoy having access to their data to monitor their own performance and productivity.”
– Director Of Business Development, Services Industry
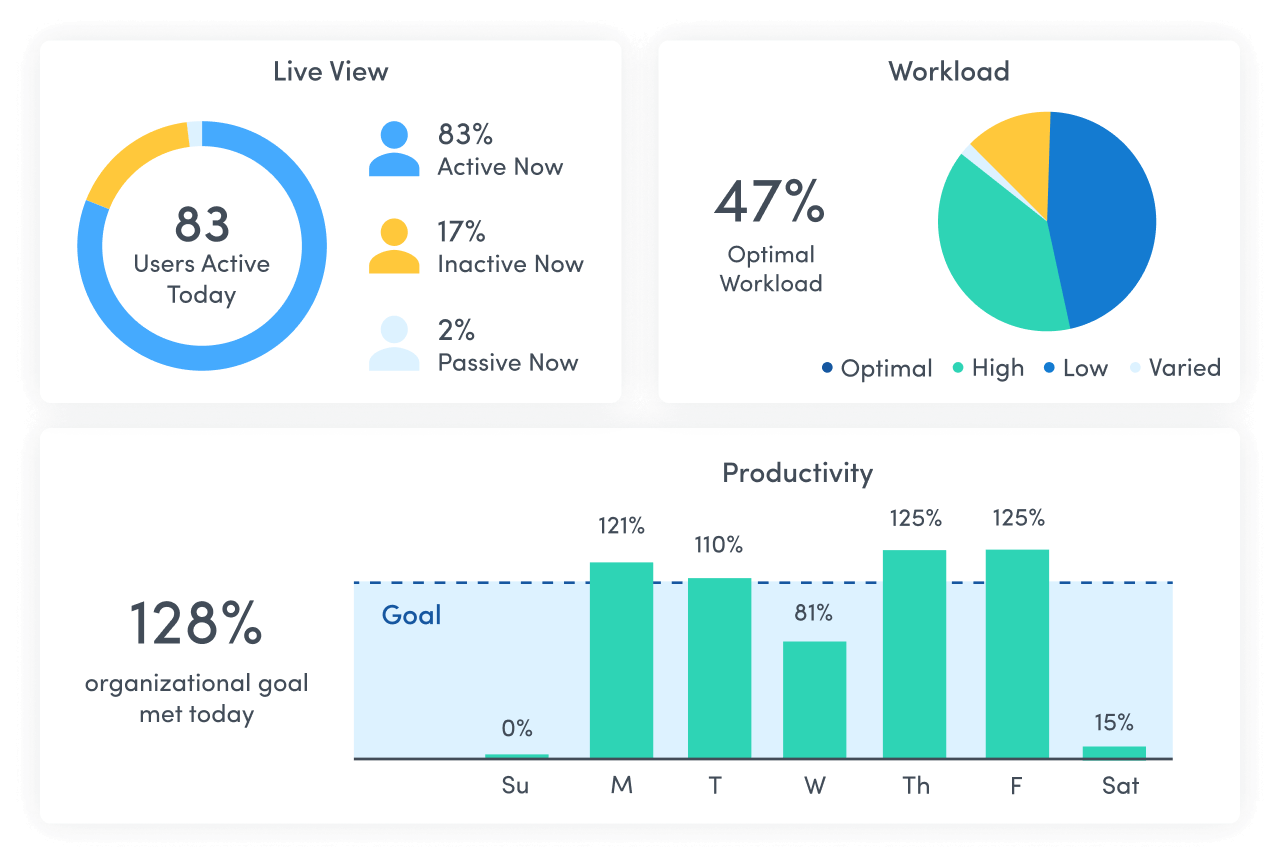
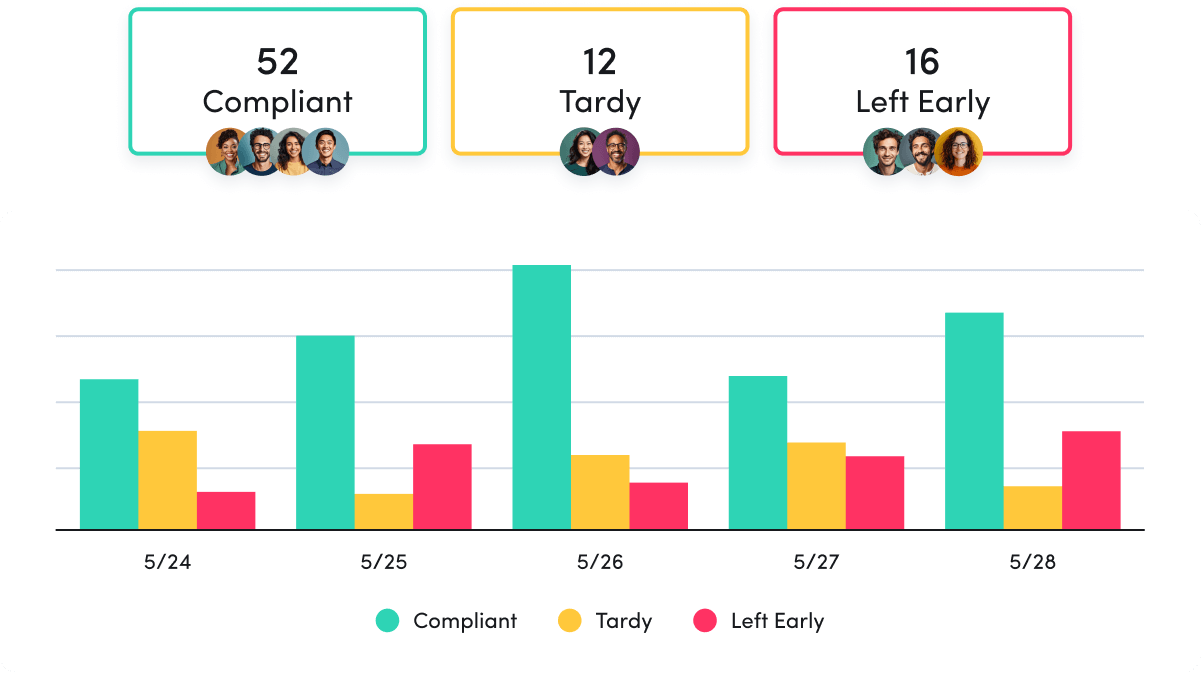
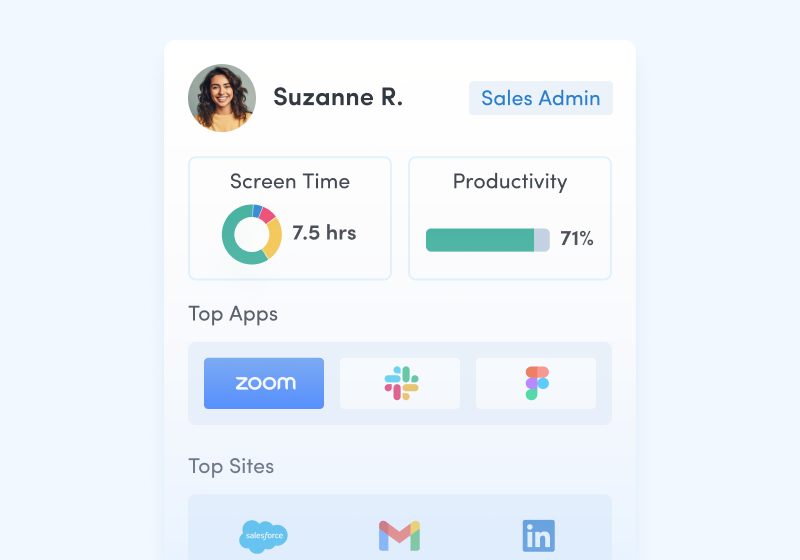
REAL-TIME VISIBILITY
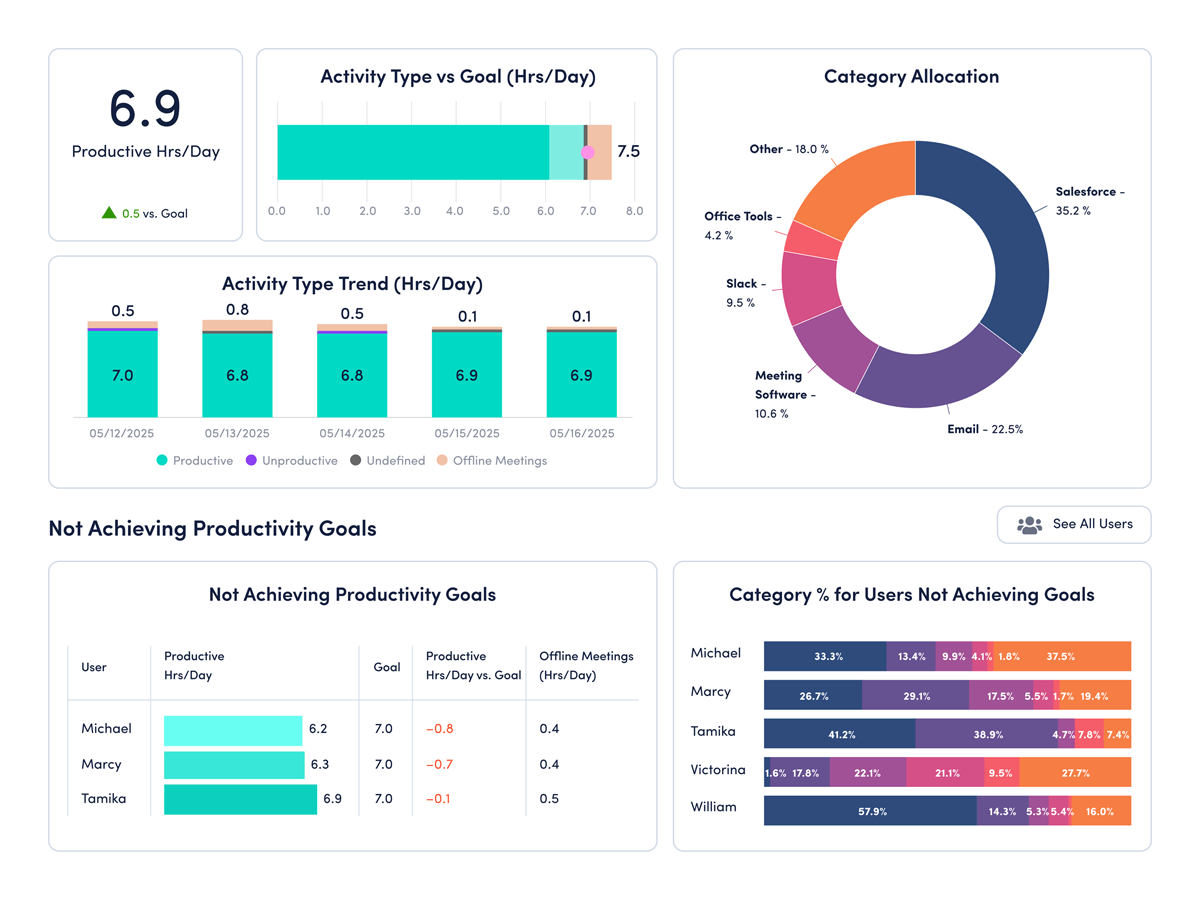
Track team availability and productivity with real-time insights
- See team members online any time throughout the day.
- Measure team progress towards daily productivity goals and compare historical goal trends.
- See team workload and productivity patterns over the past 30 days.
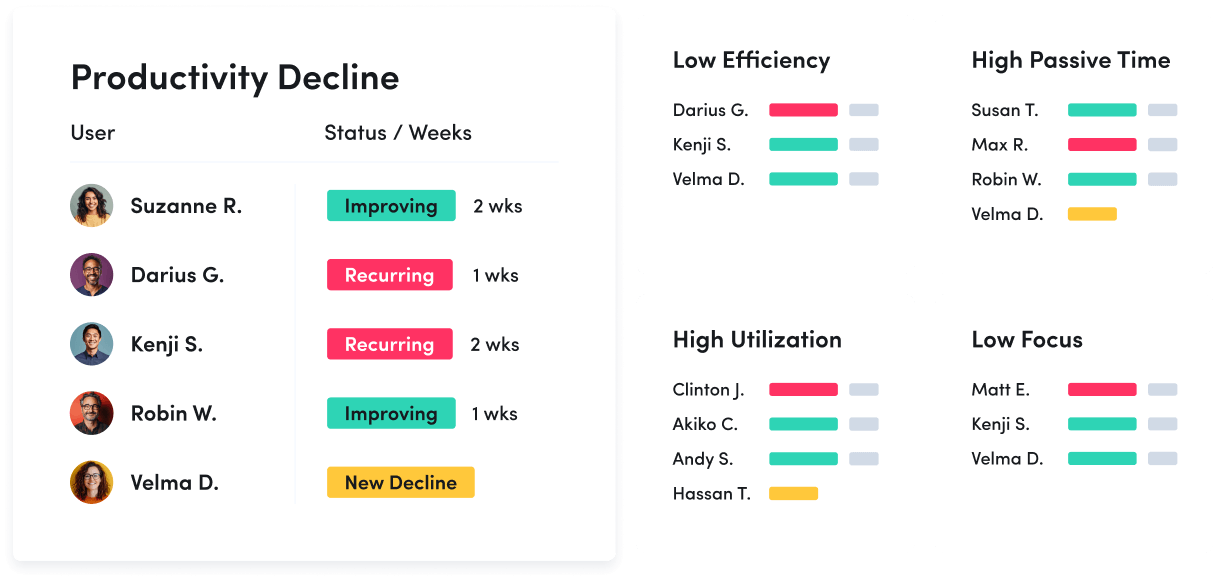
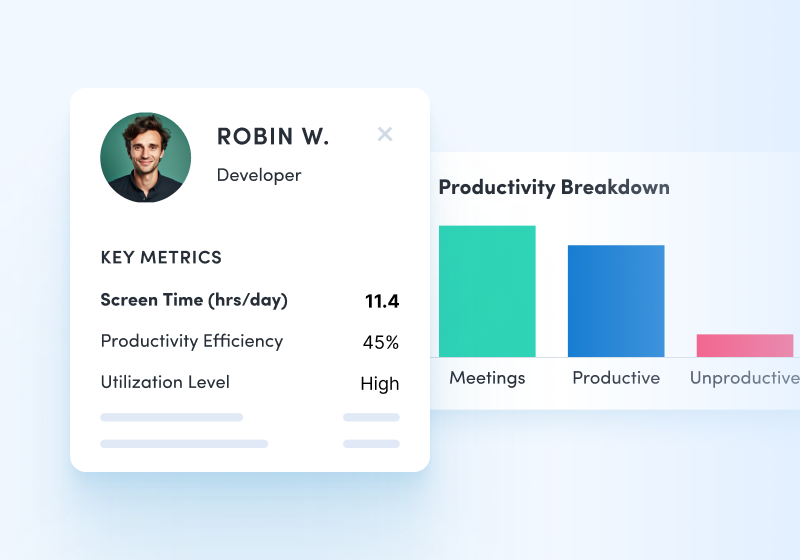
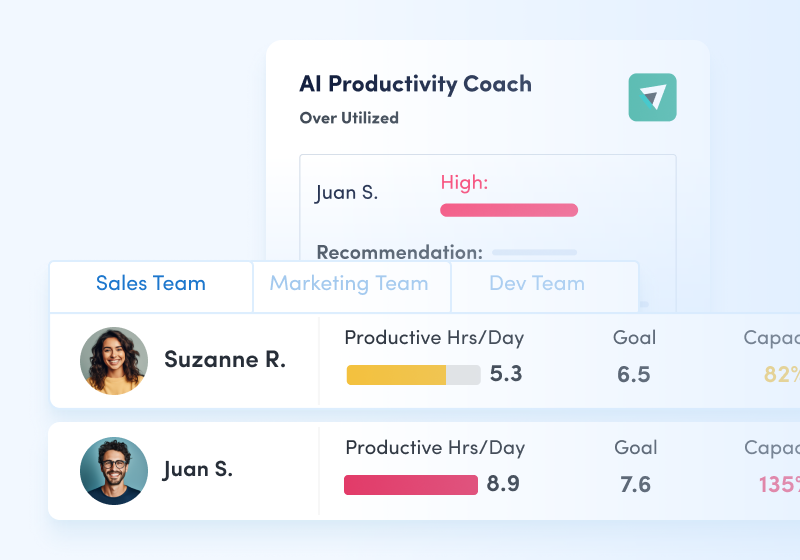
PRODUCTIVITY COACHING
Empower teams to do their best work and achieve big goals
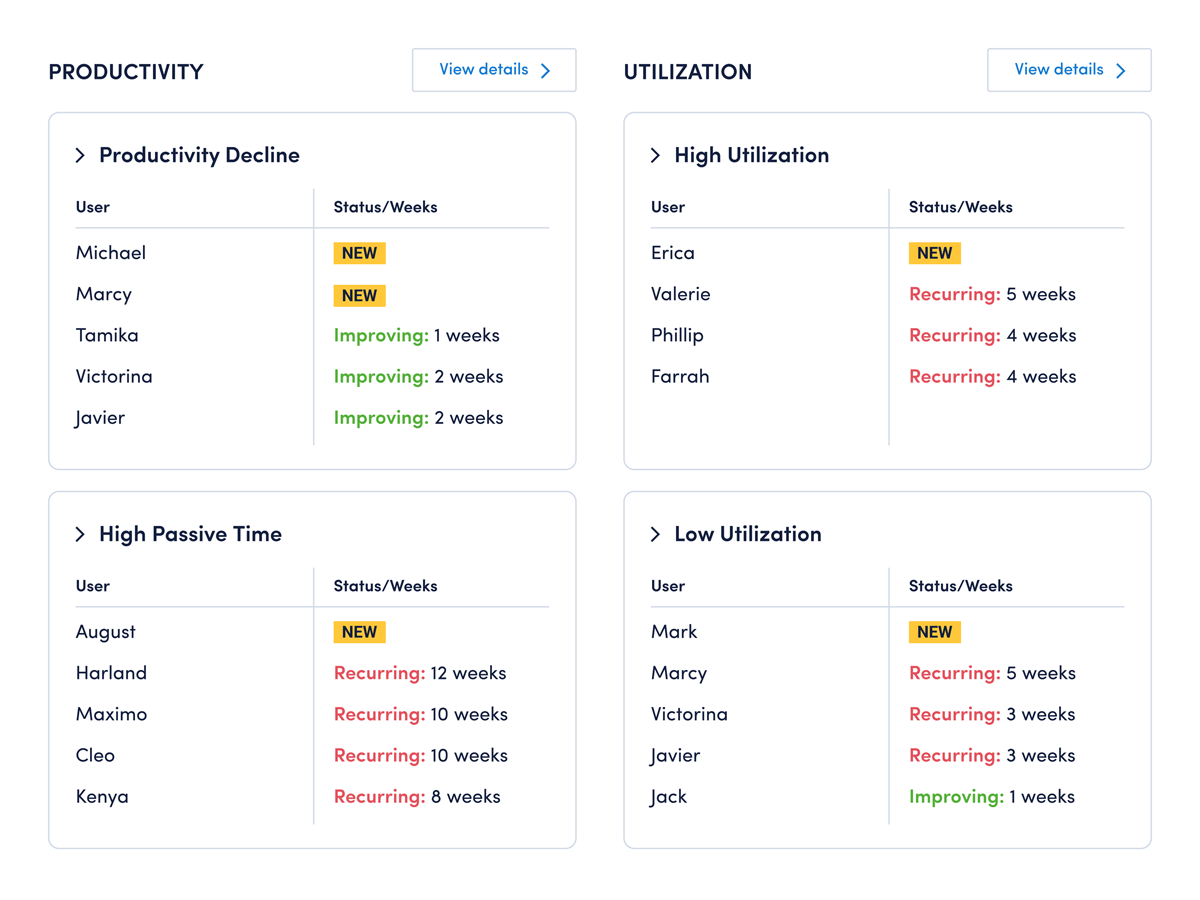
- Get personalized recommendations from our virtual coach to help fine-tune workload balance, productivity, efficiency, and focus across your team.
- Review coaching opportunities — updated weekly — to understand where team members can work wiser.
- Assess the impact of your coaching on team member work habits, with week-over-week trend reports that make it easy to gauge improvement and spot ongoing issues.
- Empower employees to take charge of their professional development. Personal Insights reports give team members visibility into their work habits and tips for improving productivity and work-life balance.
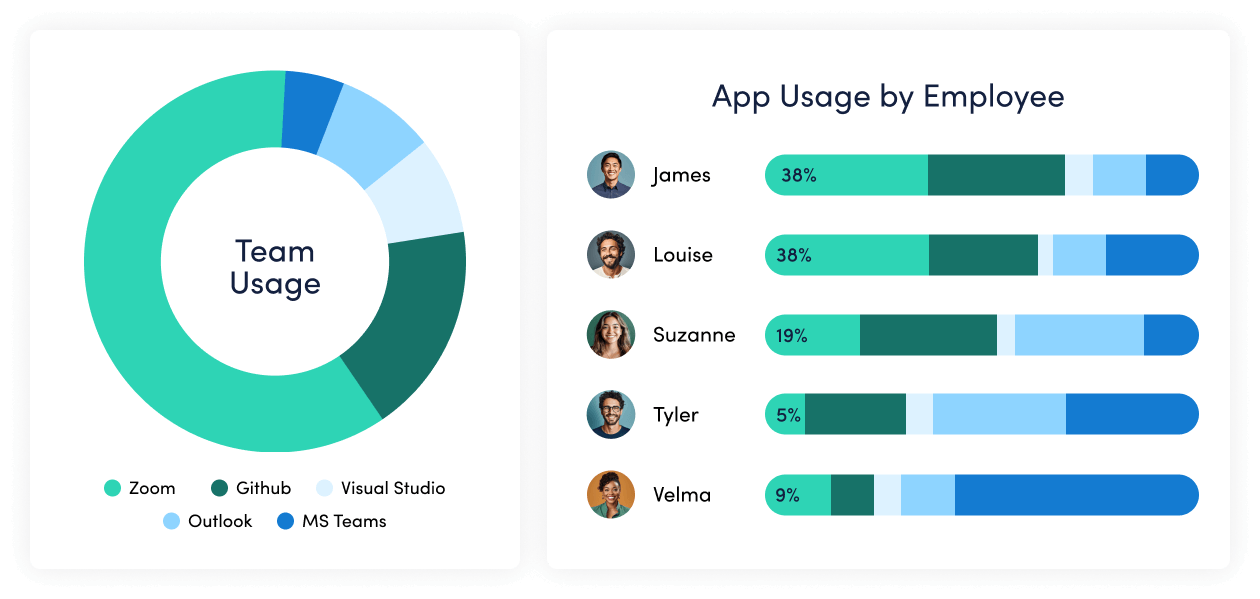
PRODUCTIVITY REPORTS
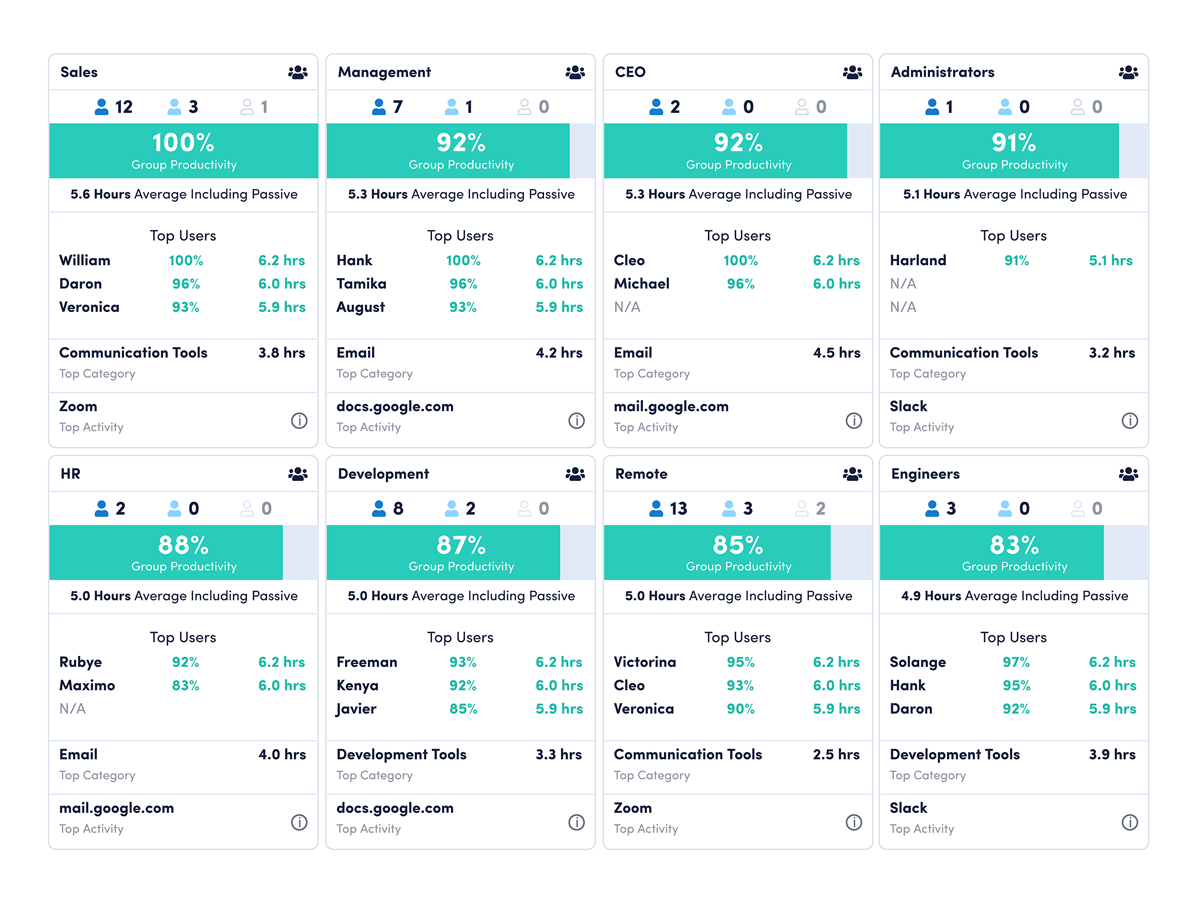
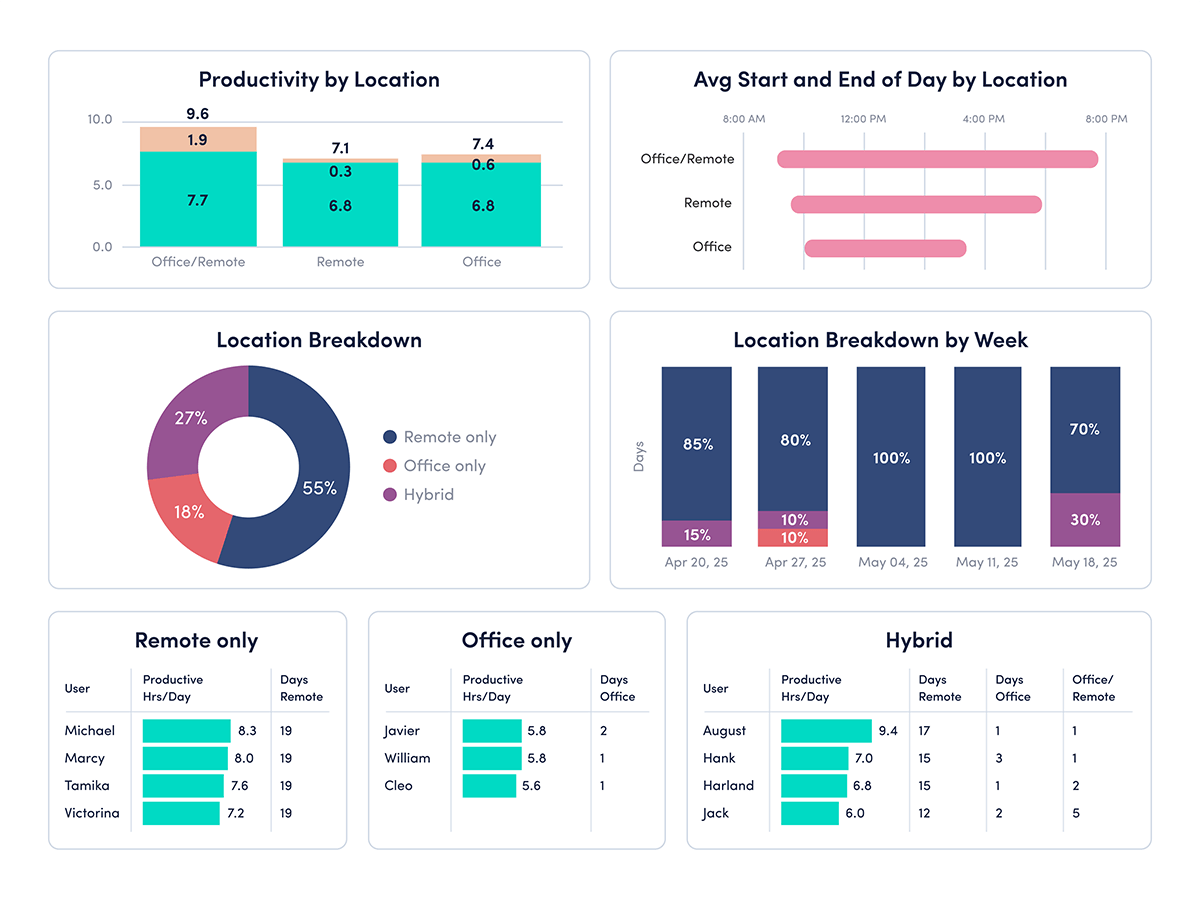
Understand how & where your teams work
- See team member productivity by location — office, remote and hybrid
- Understand how employee time is divided between focused work, collaboration and multitasking
- View team trends to assess how productivity and focus change over time
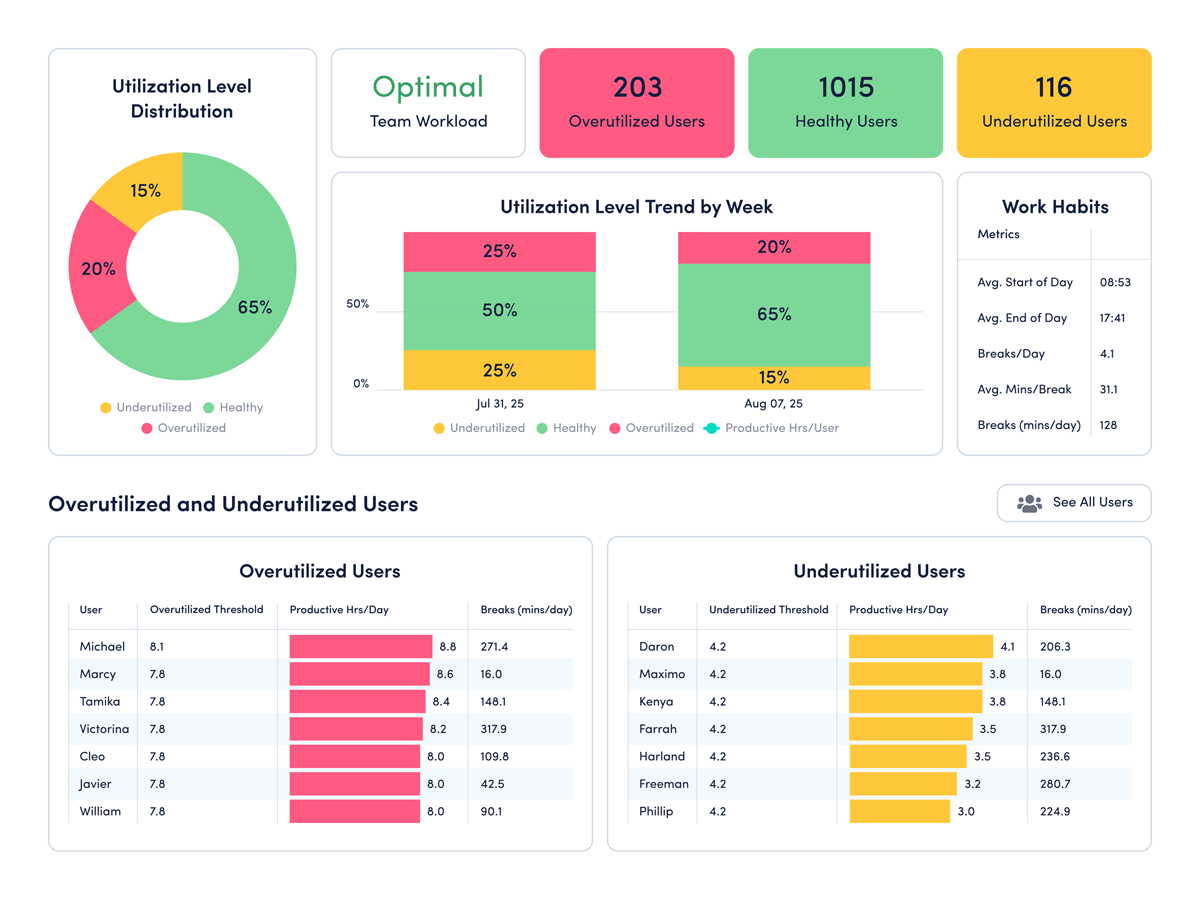
PRODUCTIVITY MONITORING & MANAGEMENT
Unlock your team’s potential and drive performance
- Uncover where roadblocks get in the way of work and remove them
- Identify workload imbalances and cross-functional collaboration issues
- Understand if your team’s behaviors are meeting and exceeding goals
ENGAGEMENT & BURNOUT
Engage everyone, everywhere
- Identify employees who are exhibiting high burnout risk so you can intervene proactively no matter where they work
- Gain insights to proactively deliver support in advance of performance challenges
- Share productivity results with individuals for collaboration and coaching opportunities
What you can do with ActivTrak
ActivTrak gives you the work intelligence to understand how work happens across people, tools and AI. Measure productivity, improve efficiency, and see how AI is changing workflows—so you can improve performance across your organization.
Executive Insights
Transform workforce data into boardroom-ready insights. See cross-team performance, identify hidden cost savings and make confident decisions that drive measurable business outcomes.
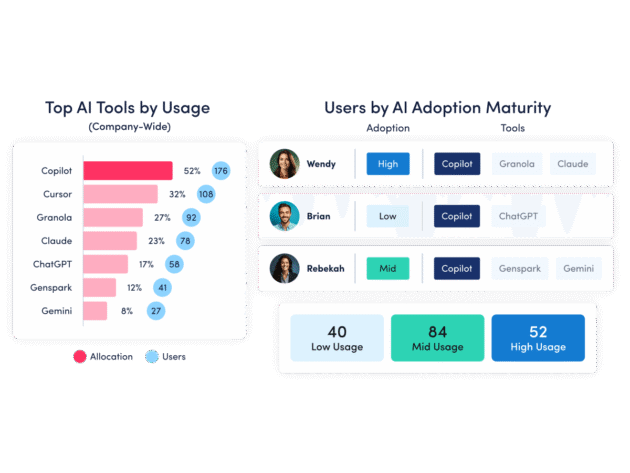
AI Insights
Understand how tools — and AI — are shaping work. See how applications and AI tools are used. Identify what’s driving value, where licenses are underused and how workflows are evolving.
Workforce Management
Understand how work happens across your organization. Analyze work patterns across teams, roles and tools to see where time goes, where friction exists and where performance can improve.
Productivity Optimization
Improve performance with data-driven insight. Quantify productivity, identify capacity and help teams work in more effective, sustainable ways.
Technology Usage & Compliance
Optimize technology investments and ensure compliance. Understand which applications and websites employees use to drive adoption or cut costs, and enforce policies aimed at mitigating risk.
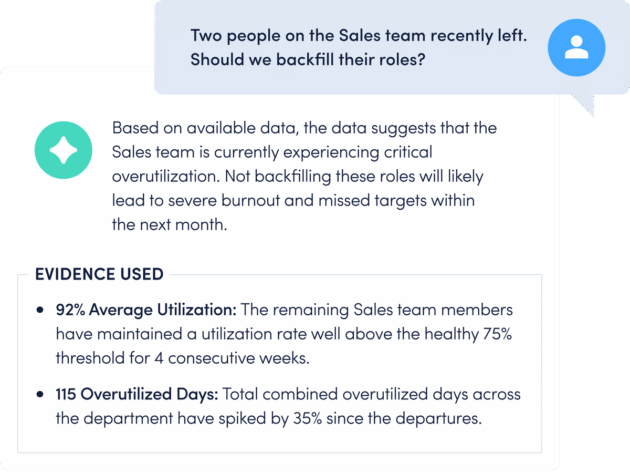
Work Advisor
Let ActivTrak’s conversational AI assistant pull directly from your data for evidenced-backed answers to pressing questions. Skip the manual analysis and get instant insights on work habits, staffing needs, attendance and more.
Connect work intelligence across your tech stack
Integrate existing tools to combine workforce activity, AI usage and business data for deeper, more actionable insights.
Workday
ADP

Microsoft Teams
Outlook

Google Calendar
ServiceNow
Zendesk
ChatGPT
Claude
Gemini
Microsoft Viva
Jira Software
Salesforce
Slack
How It Works
Capture behavioral activity
Capture behavioral activity including hours worked, schedule adherence, location policy compliance and app & website usage.
Analyze productivity trends
Analyze productivity trends on employee focus, engagement and utilization to make data-informed decisions on resource allocation.
Optimize team performance
Optimize team performance with benchmarks, goal-tracking and AI coaching recommendations to improve workforce productivity.
See what customers say about ActivTrak
Powered by![]()