Trusted by 9,500+ global brands and organizations
PRODUCTIVITY MONITORING
Visibility and analysis of workforce productivity
Optimizing productivity organization-wide starts with collecting the right data and understanding how that data relates across the business. With factors such as varying operating processes and different job roles, what may be productive to one team may not be for others. ActivTrak’s productivity monitoring software gives the visibility needed within context to monitor productivity, and customize productivity objectives to individuals, teams and departments.
Learn how ActivTrak can help you:
- Gain productivity insights organization-wide
- Discover employee productivity coaching opportunities
- Analyze workforce productivity trends over time
- Make productivity a team effort through transparency
ActivTrak’s productivity tracking software collects user activity data and insights in context so you can analyze from team to team what a productive team member looks like and optimize better business outcomes in the future.
Get started free
“When we look at staff utilization and realization rates we can now add the productivity report and gain a clearer picture as to what the employees are doing. It also allows management to see when most productivity drops off allowing us to create solutions, such as lunch breaks, relaxing time, and other cultural shifts that work to eliminate these periods.”
– Alessandro Cacciani, Firm Manager, Saranto Calamas CPA/PC
PRODUCTIVITY REPORTS
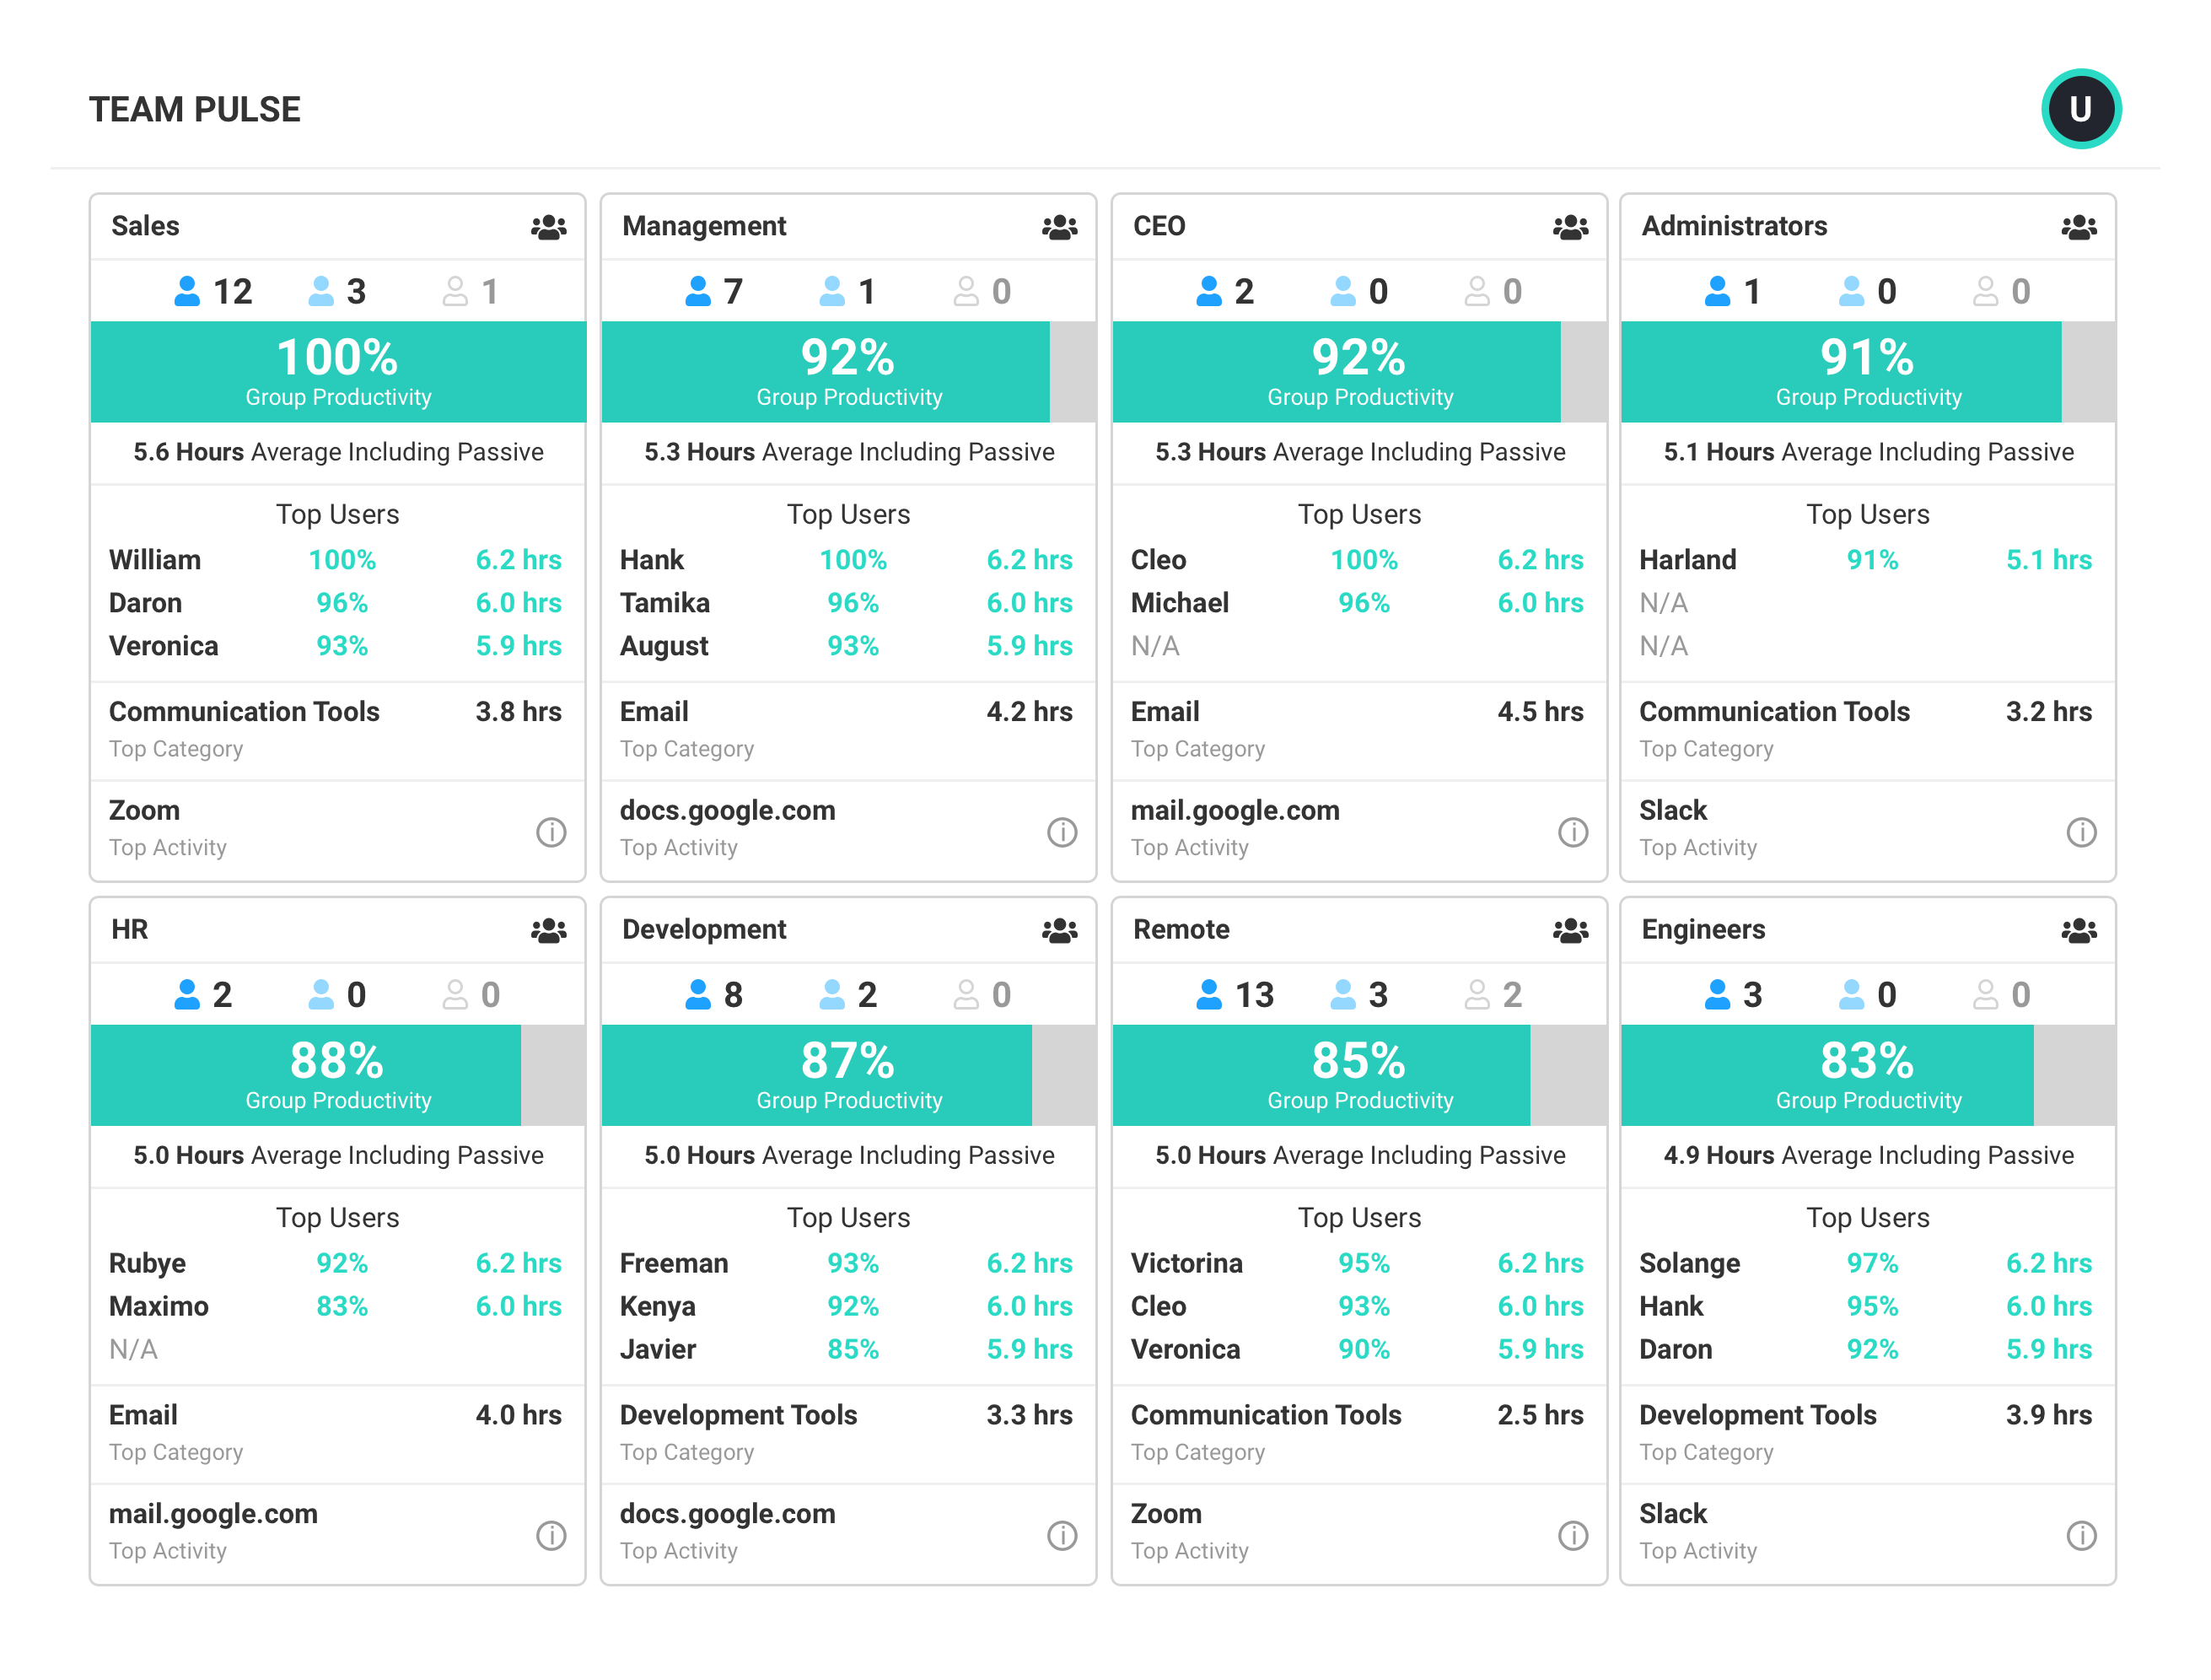
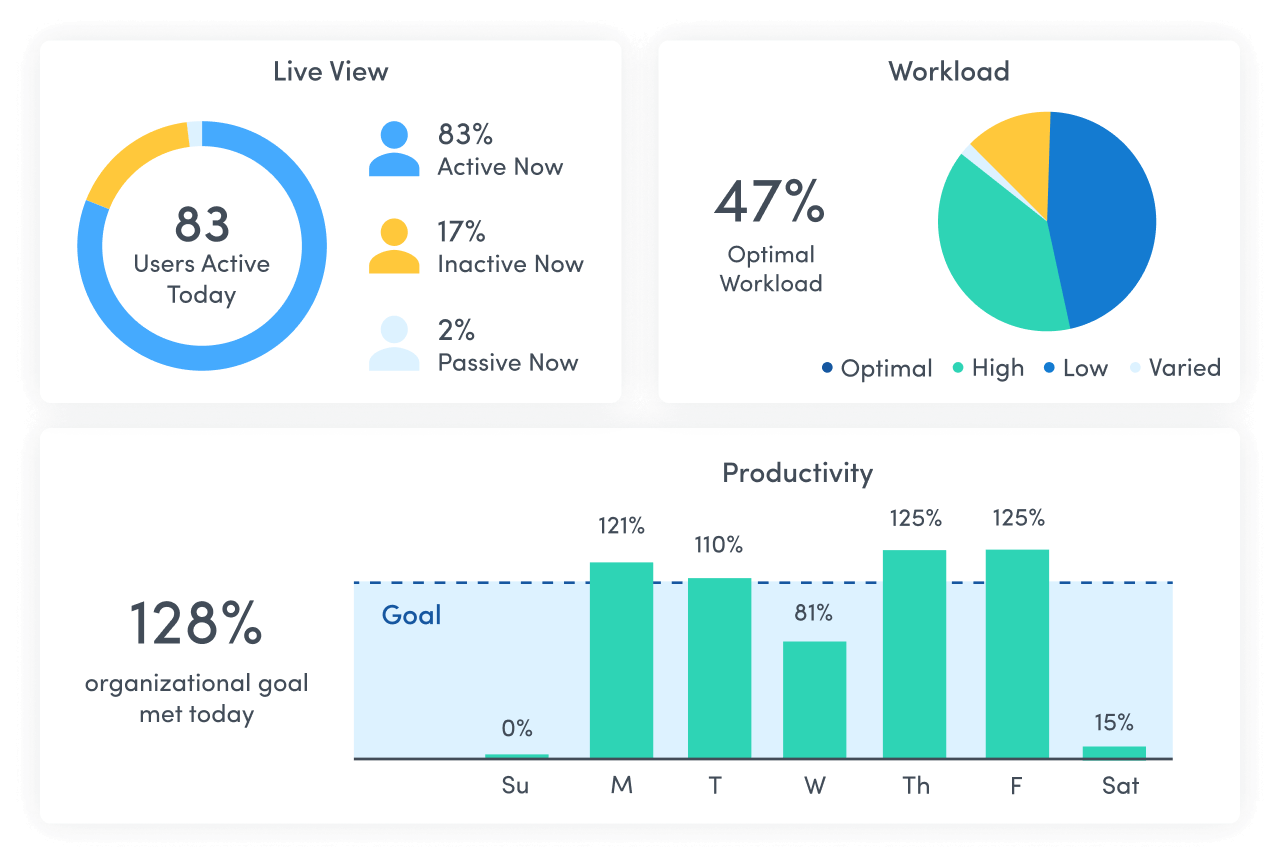
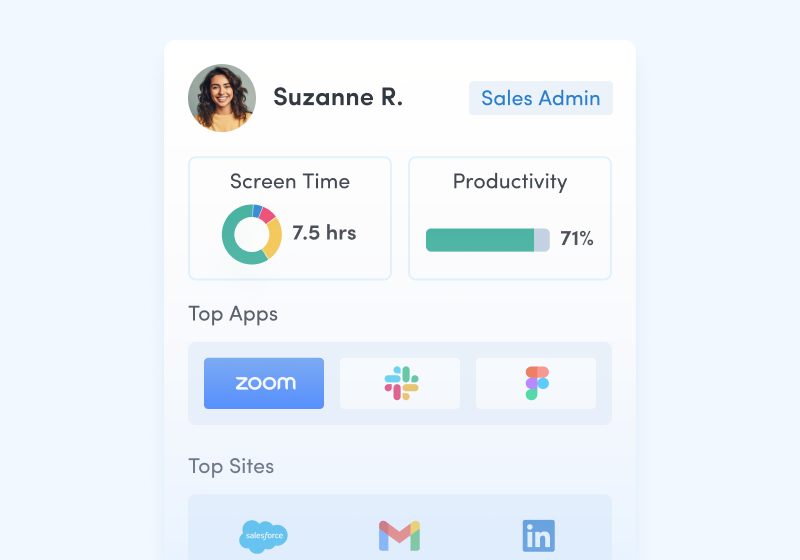
Gain productivity insights organization-wide
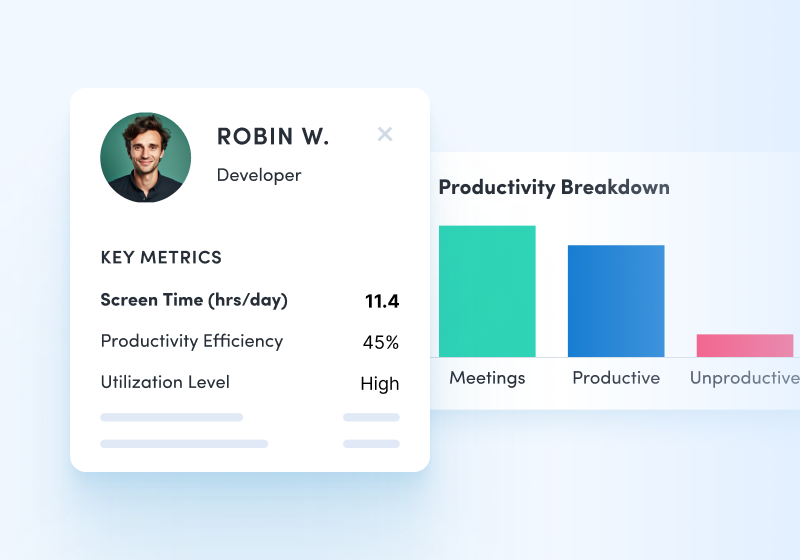
Productivity measurement begins with the collection and analysis of user activity data. With ActivTrak’s deep insights on that data, users can easily see where there are gains to be made and where productivity is already excelling.
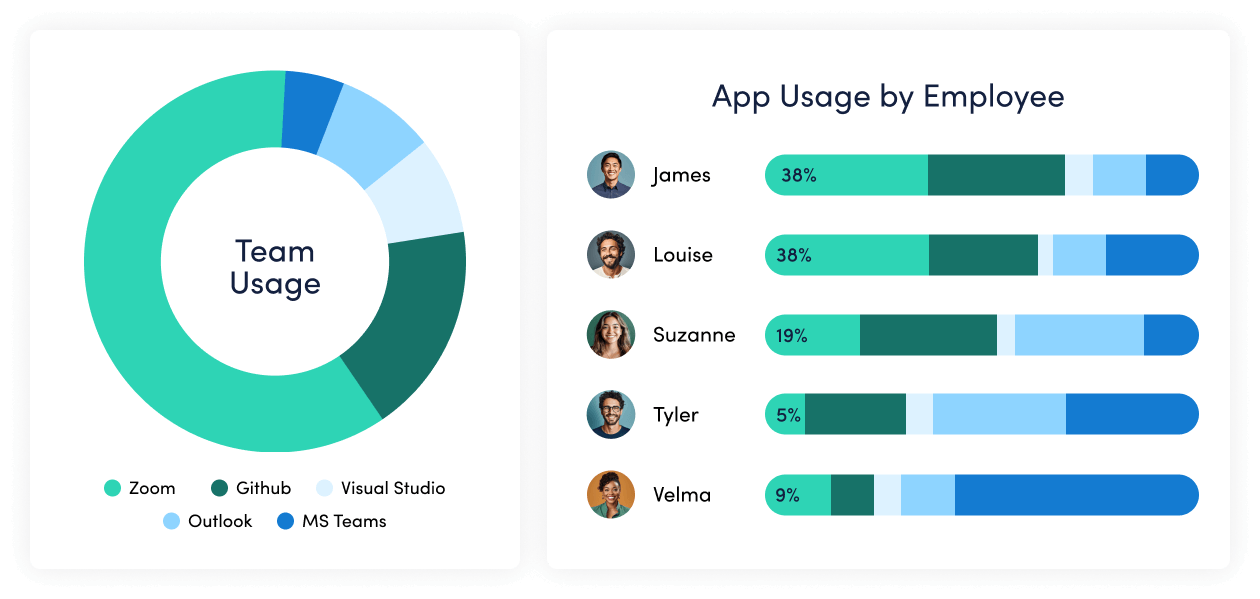
- View total and productive time by individual and team to understand what is typical and who stands out as a top performer.
- Identify collaboration tools employees use most by categories such as messaging, email, meetings, etc. to understand where your employees work.
- Drill-down into detailed reports for additional analysis on top users, categories, applications, and productivity.
- Analyze hours of peak productivity to see when your team is most focused.
ActivTrak’s productivity monitoring software gives you deep insights on the user activity data so you can answer critical questions about how your teams get their work done.
Learn more about productivity reports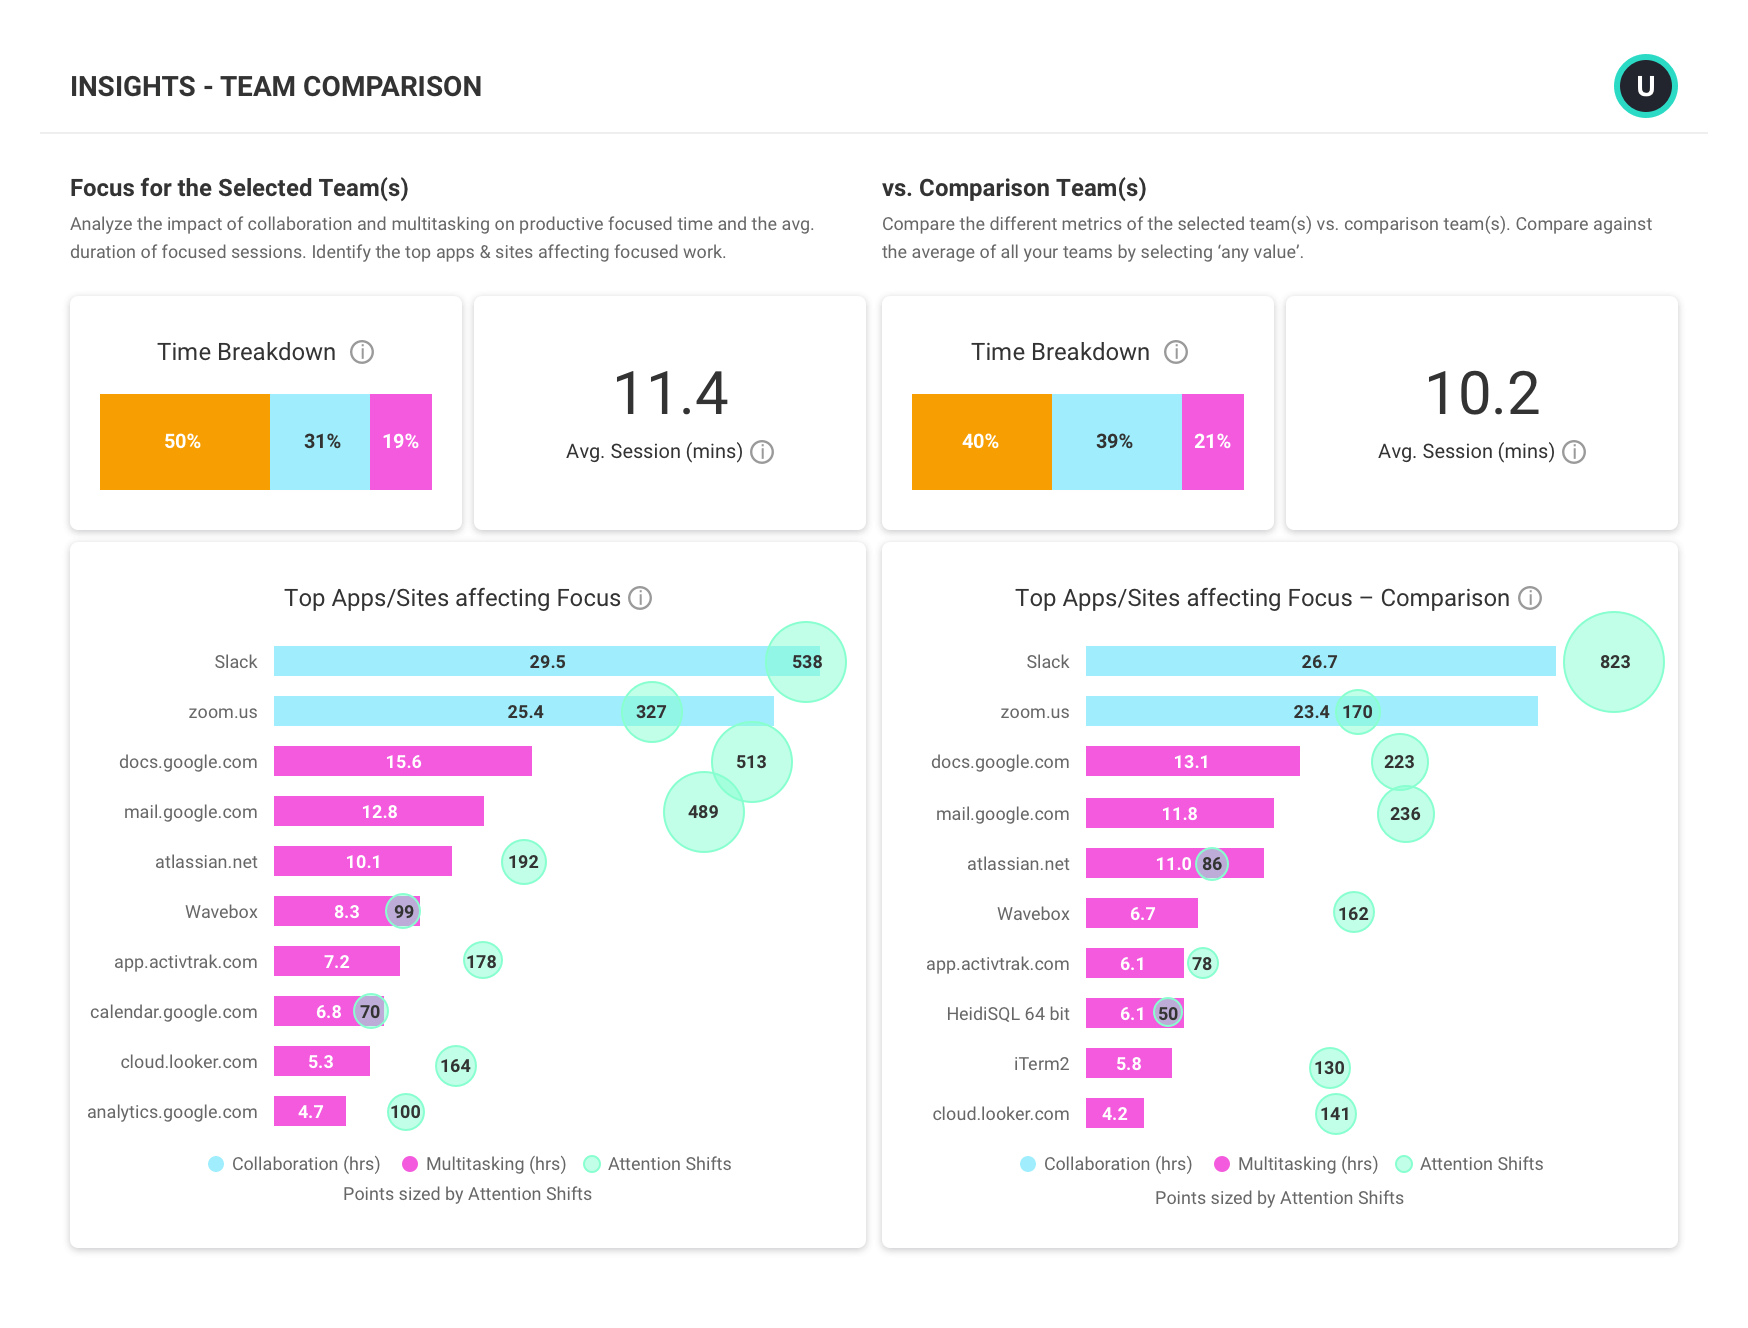
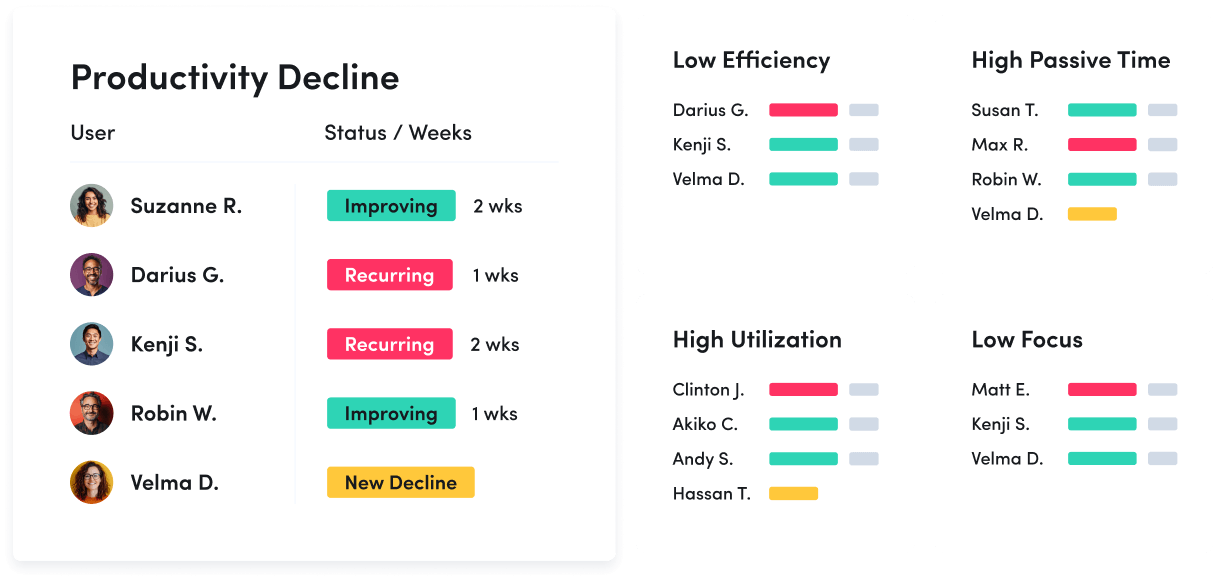
WORKLOAD BALANCE
Identify overloaded employees or unbalanced workloads
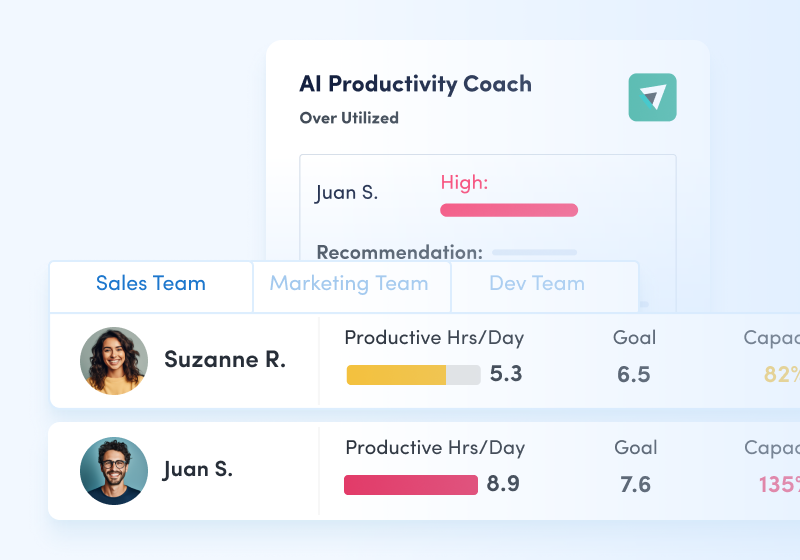
Get clear visibility into employee, team, and department groups’ total and productive working hours.
- View trends in productive and passive time to identify potentially overloaded employees so you can redistribute tasks and optimize workload.
- See a breakdown of individual and team work time by app or category to understand what activities are consuming the most time.
- Analyze activities daily, weekly, and monthly to plan and improve scheduling.
ActivTrak provides clear visibility into employee, team, and department groups’ total and productive working hours.
Learn more about workload balance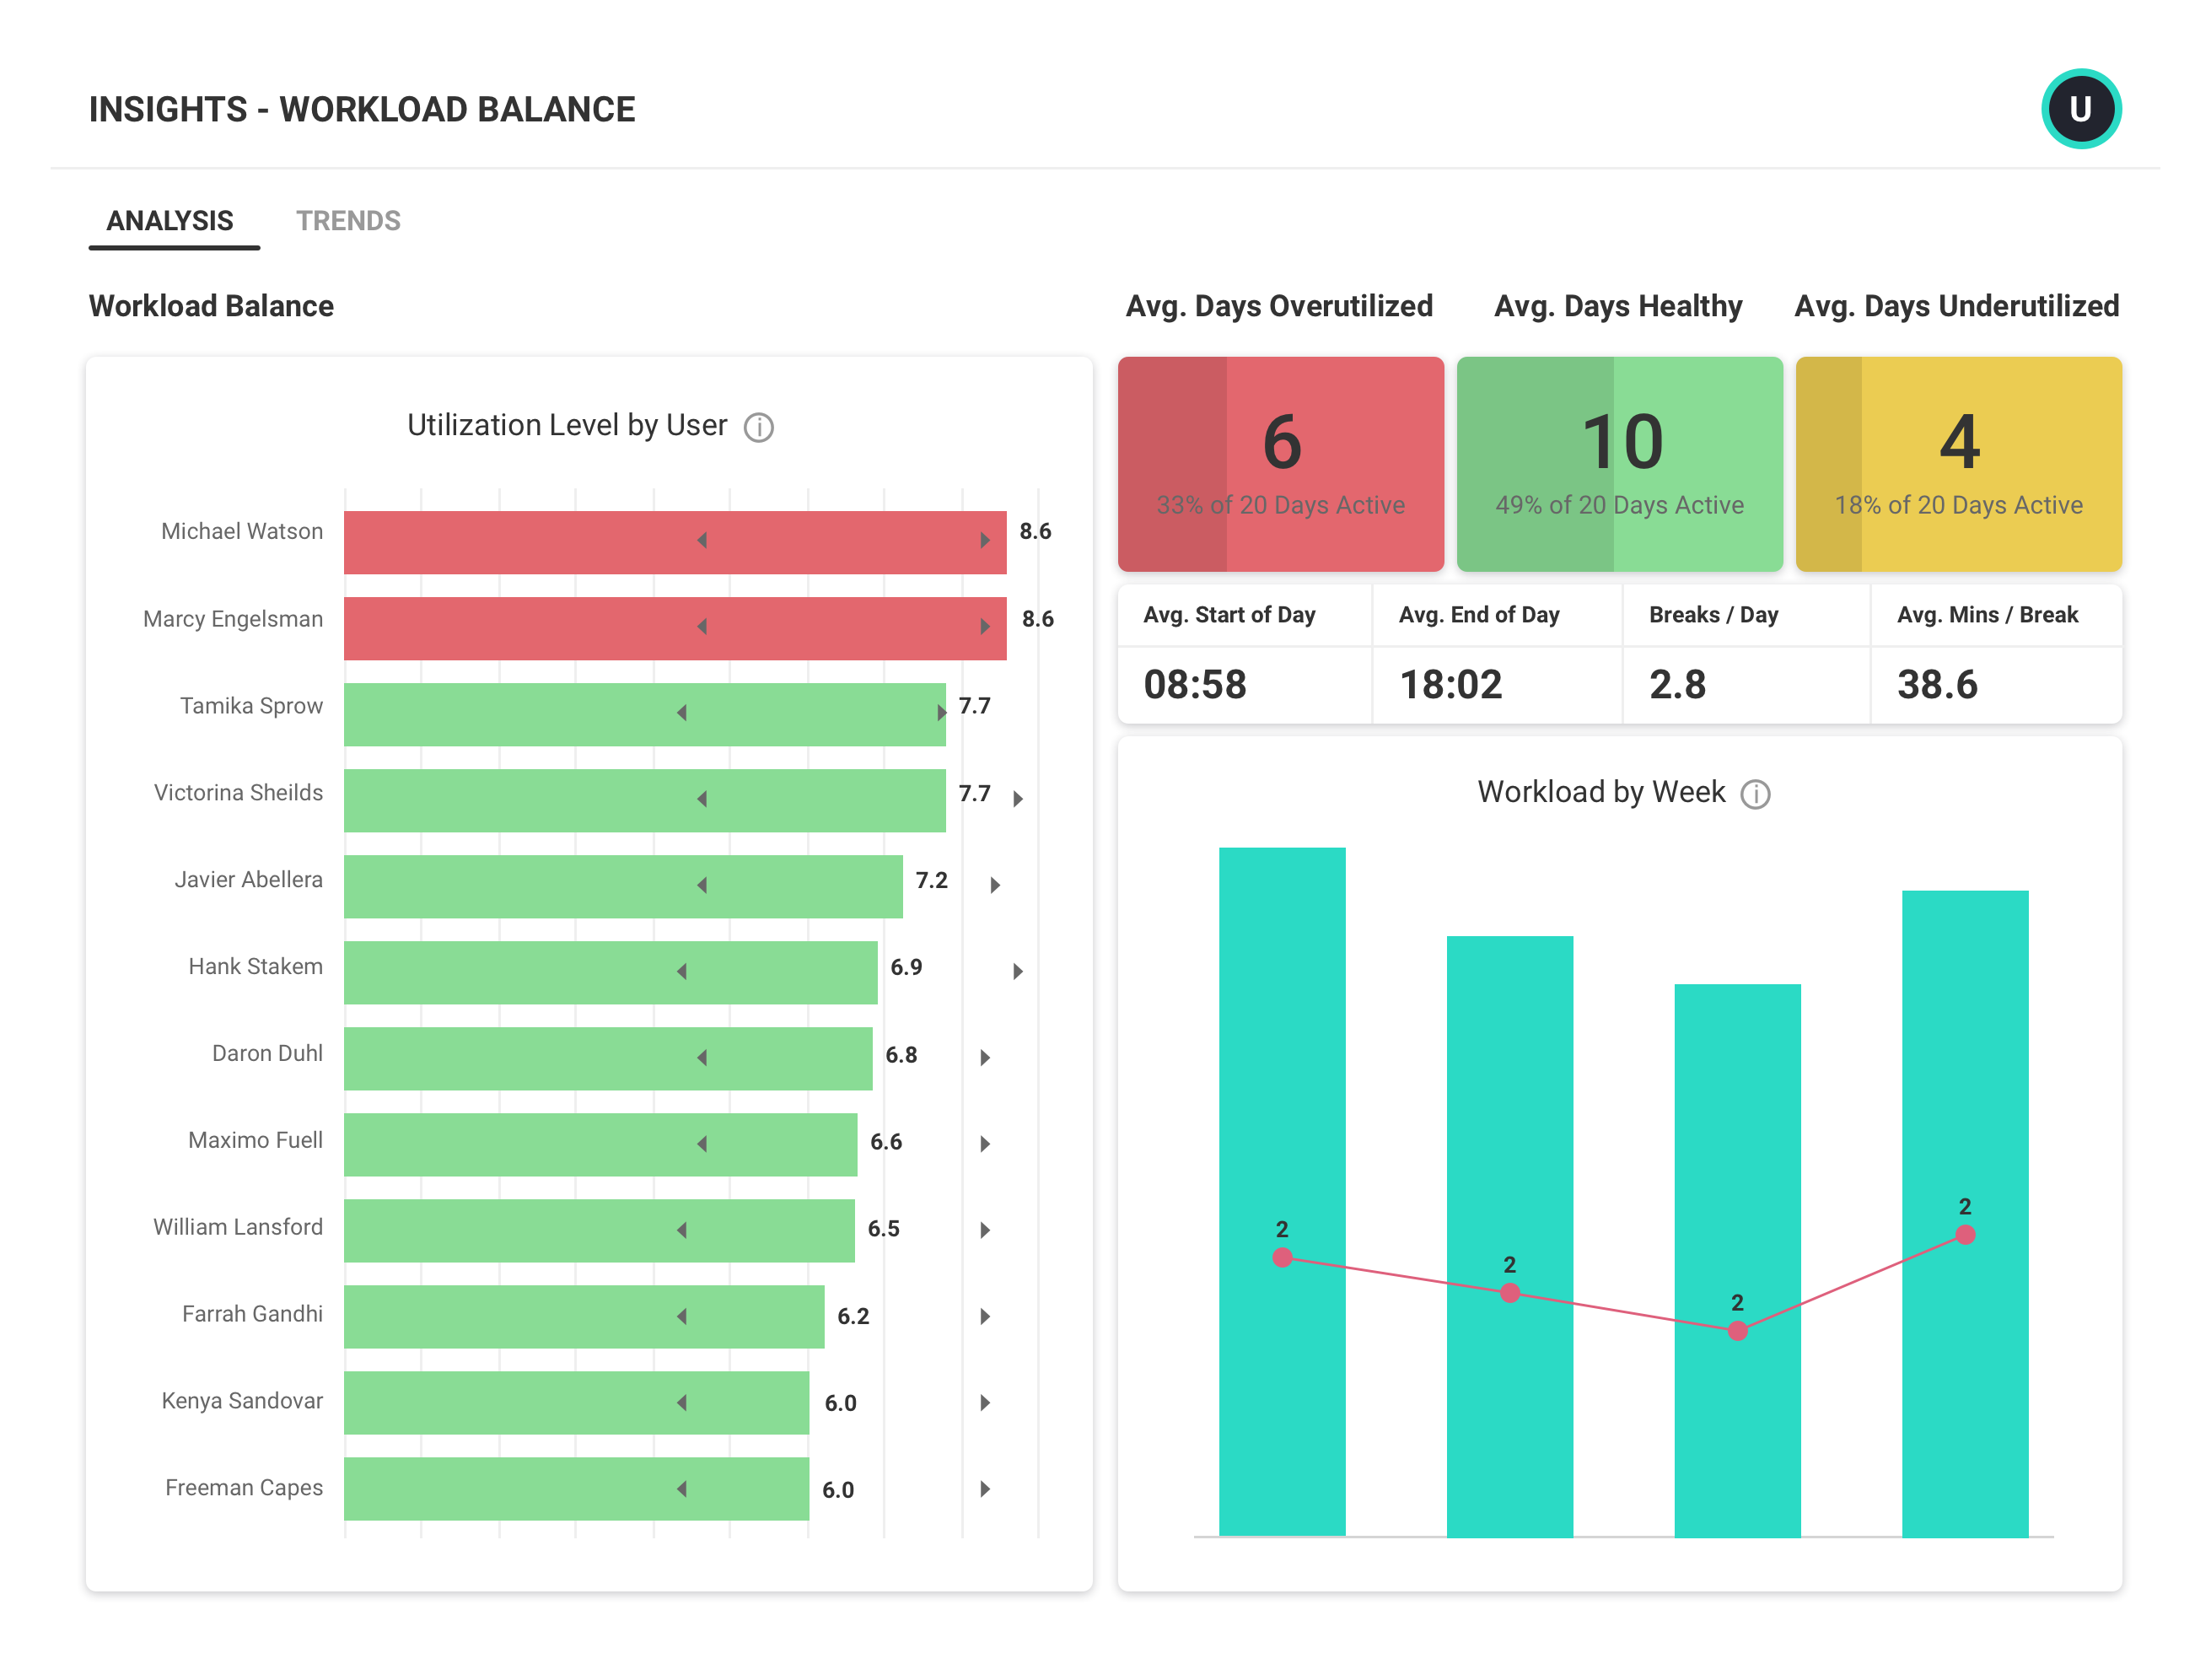
DATA INTEGRATIONS
Analyze workforce productivity trends over time
Track, measure, and analyze productivity trends over time across teams and roles in order to understand organization-wide behavior. With ActivTrak’s ActivConnect, you can integrate workforce productivity activities with other external sources for deeper analytics.
- Get direct data access via SQL for export and querying.
- Query and integrate user activity data with BI data visualization tools for personalized reporting.
- Leverage built-in starter templates for BI data visualization tools like Tableau, PowerBI, and Google Data Studio to jumpstart and extend your analysis.
- Correlate ActivTrak data with other data sources such as CRM, HRM, EPM, etc. for deeper insights.
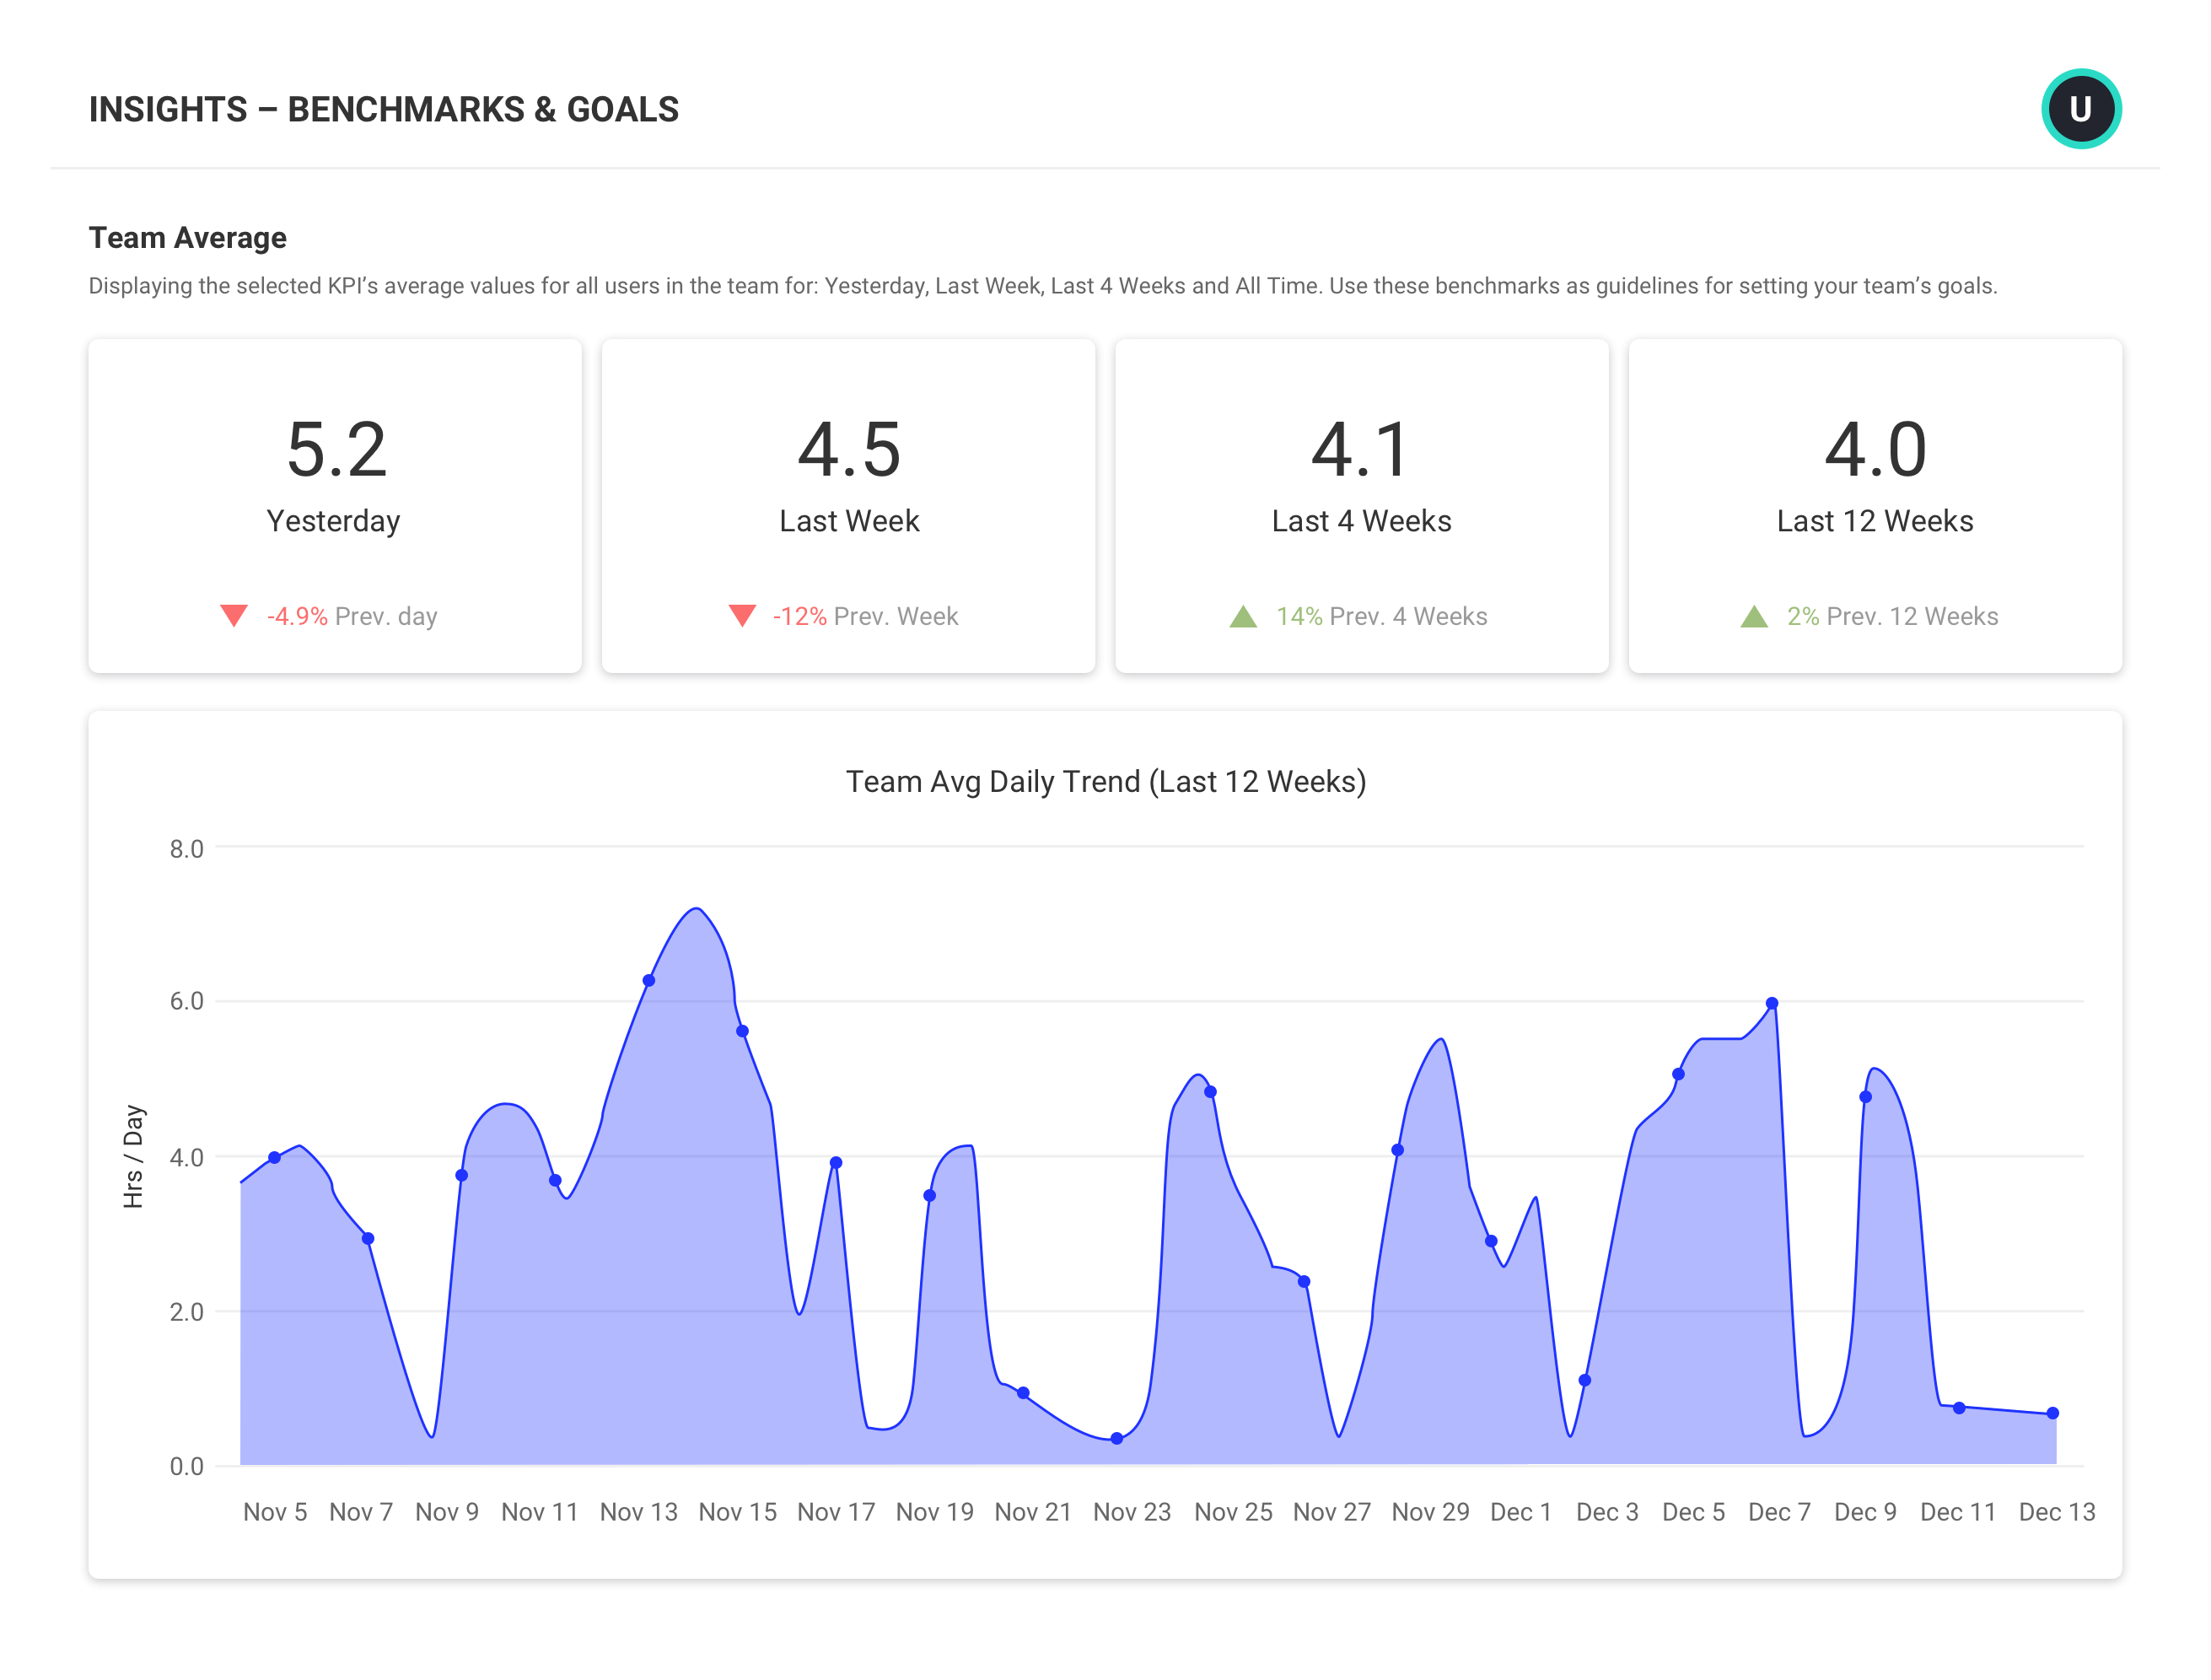
Productivity monitoring software shouldn’t be used in the shadows. With transparency you get with ActivTrak, you can invite team members to the conversation and remind them that the business’ success is their success.
Learn more about benchmarks and goals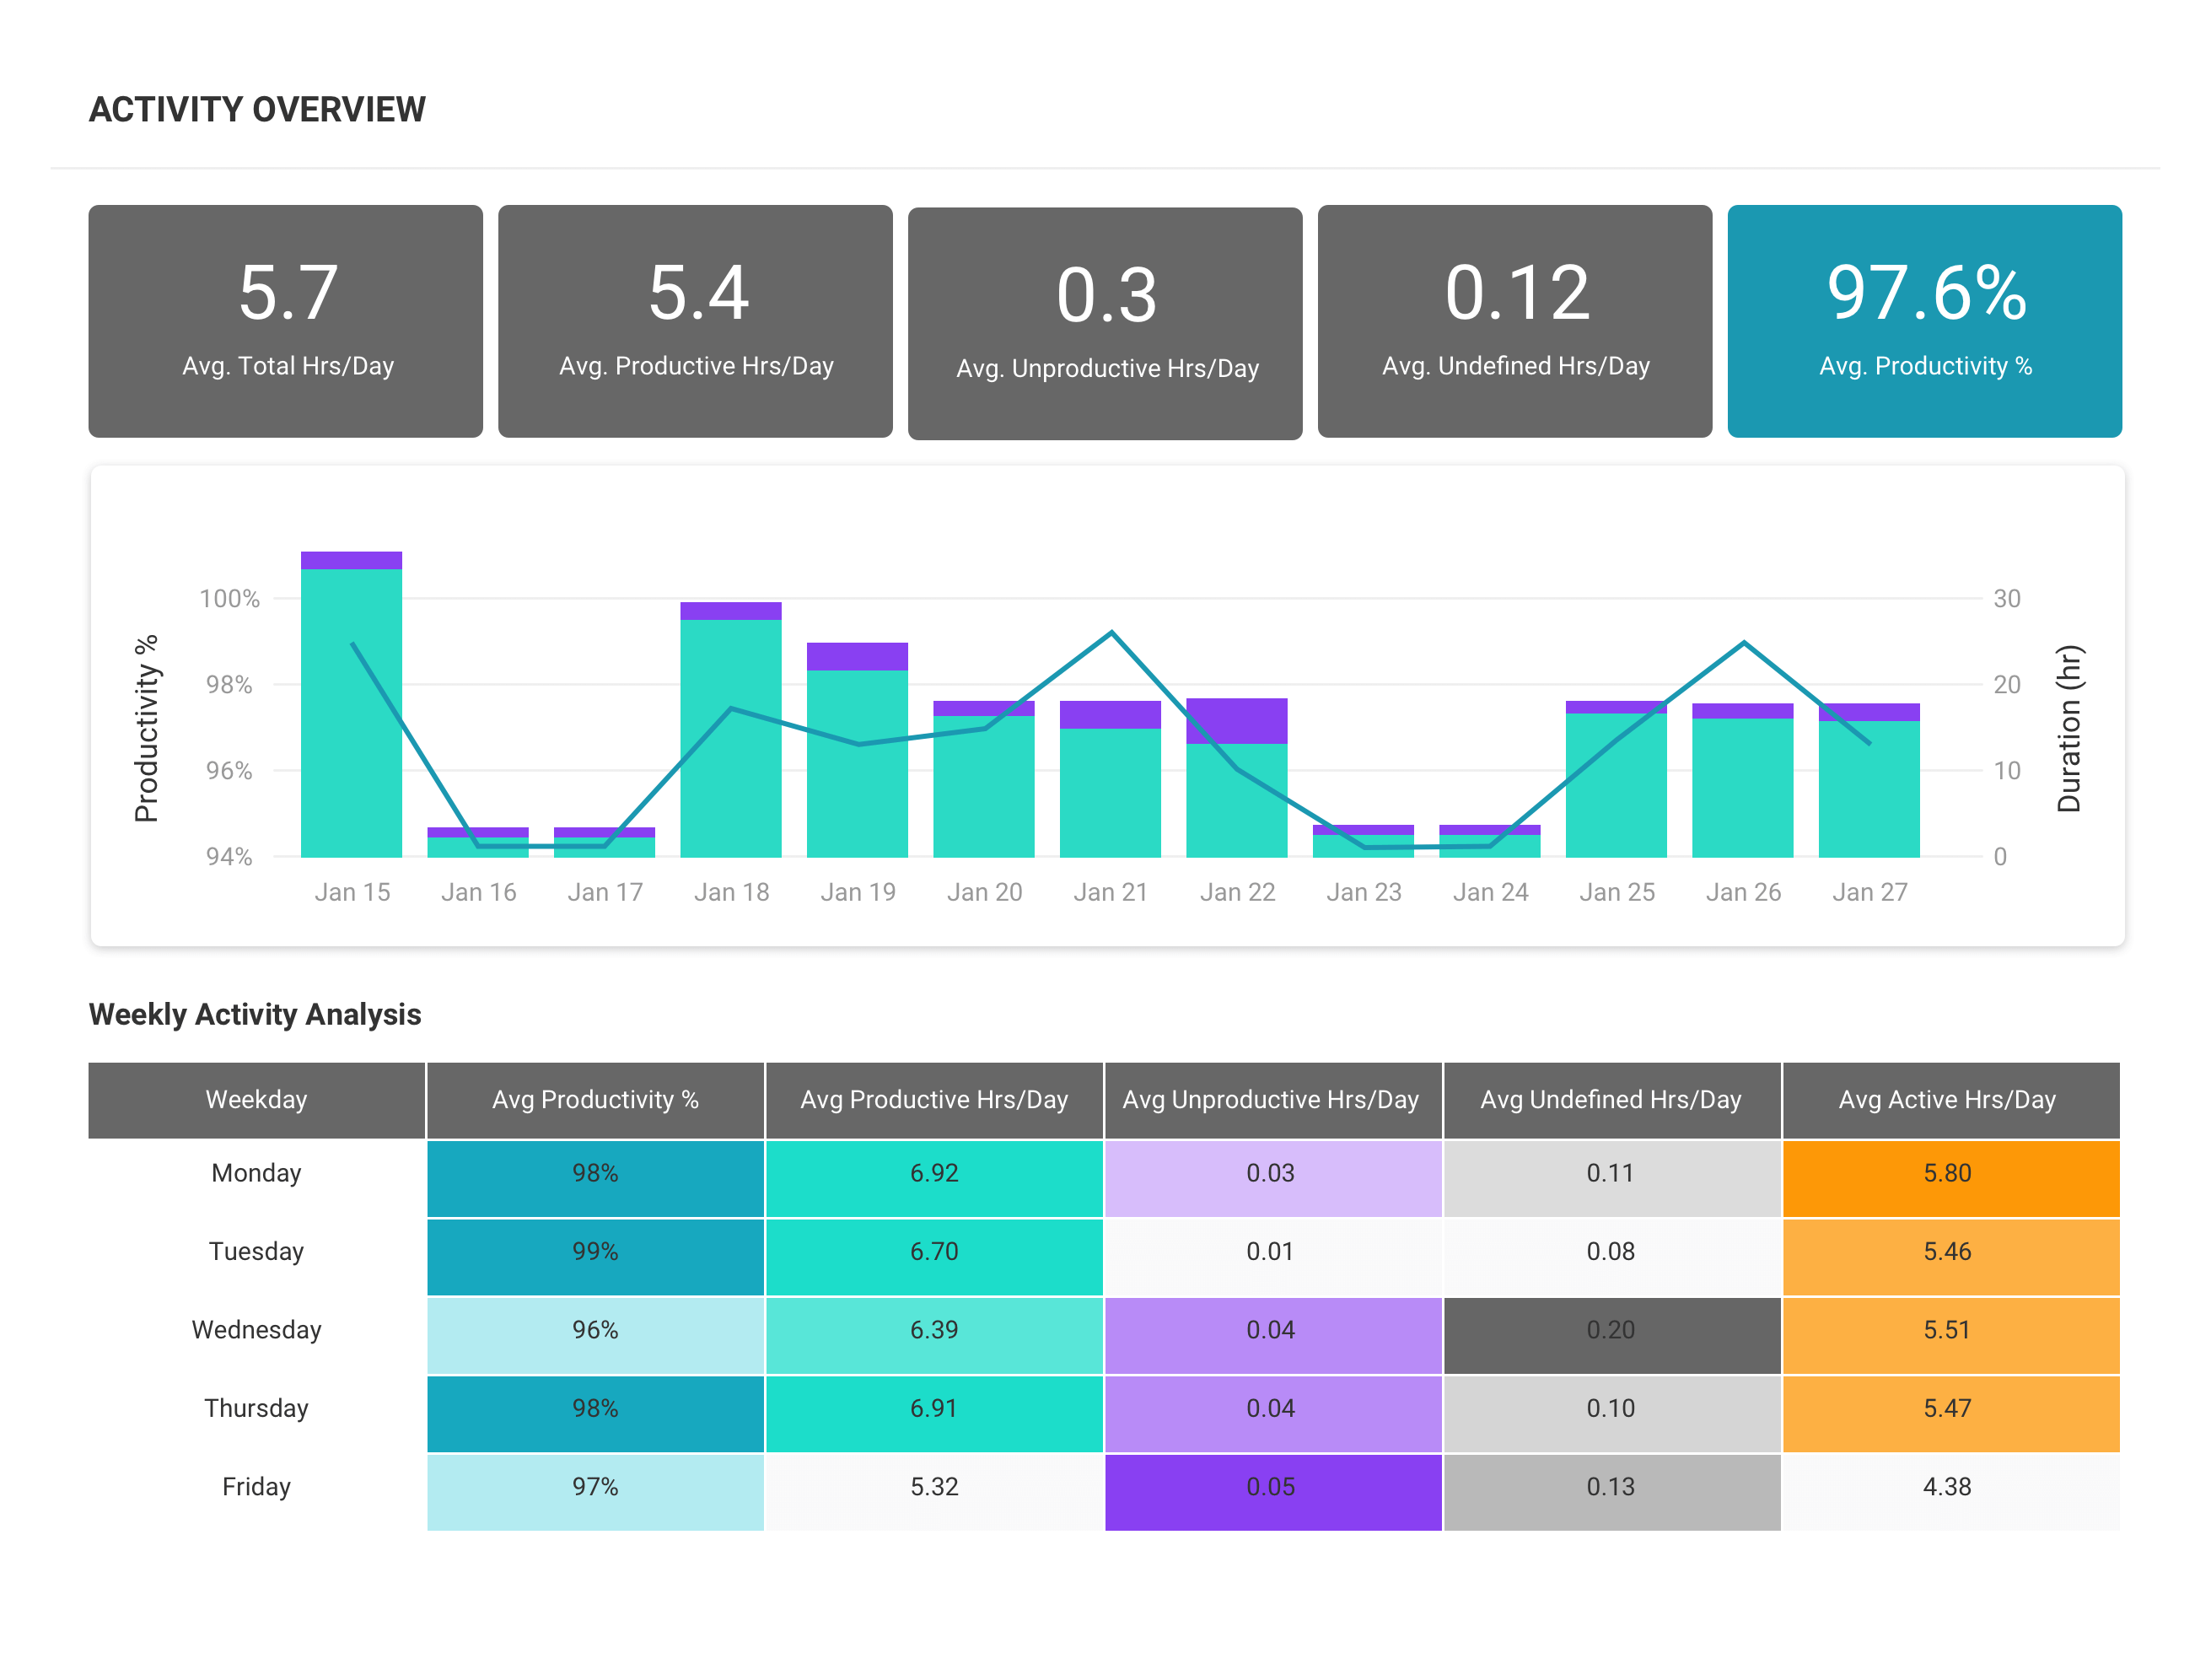
Benchmarks and goals
Make productivity a team effort through transparency
Productivity monitoring software shouldn’t be used in the shadows. With transparency, you can invite team members to the conversation and remind them that the business’ success is their success.
- Data insights and reports can be leveraged as coaching tools to increase both employee engagement and overall job satisfaction.
- Role-based access allows managers to grant employees access to their own data, encouraging transparency and collaboration.
- Schedule to share individual insights with each team member to empower constructive conversations.
- Leverage productivity reports to find the right workload balance for each team member.
What you can do with ActivTrak
ActivTrak gives you the work intelligence to understand how work happens across people, tools and AI. Measure productivity, improve efficiency, and see how AI is changing workflows—so you can improve performance across your organization.
Executive Insights
Transform workforce data into boardroom-ready insights. See cross-team performance, identify hidden cost savings and make confident decisions that drive measurable business outcomes.
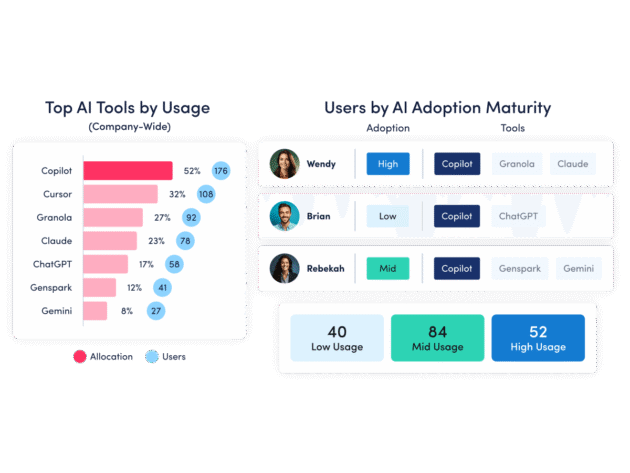
AI Insights
Understand how tools — and AI — are shaping work. See how applications and AI tools are used. Identify what’s driving value, where licenses are underused and how workflows are evolving.
Workforce Management
Understand how work happens across your organization. Analyze work patterns across teams, roles and tools to see where time goes, where friction exists and where performance can improve.
Productivity Optimization
Improve performance with data-driven insight. Quantify productivity, identify capacity and help teams work in more effective, sustainable ways.
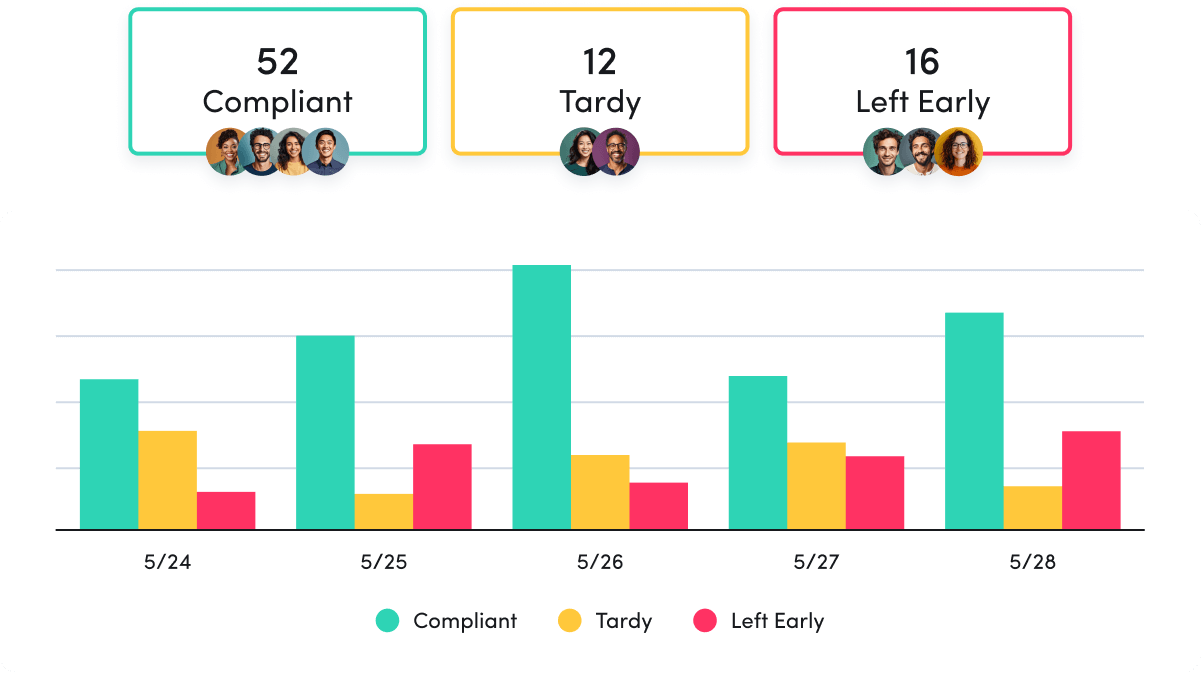
Technology Usage & Compliance
Optimize technology investments and ensure compliance. Understand which applications and websites employees use to drive adoption or cut costs, and enforce policies aimed at mitigating risk.
Connect work intelligence across your tech stack
Integrate existing tools to combine workforce activity, AI usage and business data for deeper, more actionable insights.
Workday
ADP

Microsoft Teams
Outlook
Google Calendar
ServiceNow
Zendesk
ChatGPT
Claude
Gemini
Microsoft Viva
Jira Software
Salesforce
Slack
How It Works
Capture behavioral activity
Capture behavioral activity including hours worked, schedule adherence, location policy compliance and app & website usage.
Analyze productivity trends
Analyze productivity trends on employee focus, engagement and utilization to make data-informed decisions on resource allocation.
Optimize team performance
Optimize team performance with benchmarks, goal-tracking and AI coaching recommendations to improve workforce productivity.
See what customers say about ActivTrak
Powered by![]()
Getting started is easy. Be up and running in minutes.
FAQs about productivity monitoring:
How do you monitor productivity?
Monitoring productivity starts with understanding what productivity means for your organization. Once that is established, you gather relevant user activity data to understand what employee activities help or hinder productivity. Productivity monitoring software, like ActivTrak, can make this process easy, insightful, and ethical.
There is no one size fits all definition for productivity. Each business has unique aspects for productivity success. A critical analysis of your business success markers will help you understand which key metrics point to successful productivity. They could include revenue goals, a production quota, or service ticket objectives. Keep in mind that quantity of time spent working does not always equate to quality.
Once you have those productivity guideposts, it’s important to discover what employee activities feed productivity and set appropriate goals and policies based on those insights.
How does productivity tracking software work?
Productivity tracking software collects data on user activity, usually via an agent on the individual user’s computer. Employee behavior and activities are displayed in views to understand how productive employees are during working hours. Businesses use that data to discover trends in productivity and can answer questions like ‘Do my employees have the technology they need to do their jobs?’, ‘What habits do my employees display that serve or hinder productivity?’, and ‘How are my employees managing their time?’ With actionable insights, business leaders can make informed decisions and collaborate to improve productivity organization-wide.
Can companies track productivity and performance effectively?
With the right data and insights – yes. Employee productivity software can help analyze employee behavior and give organizations the visibility they need to make informed decisions. If using employee productivity software to track the productivity of your employees, one can often see negative trends before they impact goals and head issues off at the pass or elevate insights to influence company policy to influence positive change. Over time, those performance metrics could change as work conditions change or company goals shift. Using employee productivity software can help validate changes and give decision makers the data they need to verify decisions.
What is ActivTrak’s approach to productivity monitoring and employee monitoring?
Improving productivity organization-wide requires creating a baseline with which to measure from. Creating that baseline necessitates the collection and monitoring of employee activity data. We know employee monitoring and activity analysis have a mixed history and association with surveillance and heavy oversight. ActivTrak intends to change that by focusing on the real output of employee monitoring: improved productivity.
We designed ActivTrak from an ethical stance: with the foundational principles of transparency, collaboration and informed insight. We’ve willfully developed a powerful platform that focuses on the collection of contextual data, avoiding intrusive employee monitoring technologies like video surveillance and continuous screenshots. We challenge users of our product to join us on our journey to move employee monitoring from the time of oversight and into the results and data-driven space that is productivity insights and optimization of work.