Workforce planning isn’t new. But in 2026, it’s more urgent than ever. From turnover to talent management to skills gaps, business leaders across industries face tremendous pressure to do more with less.
Without a plan, even well-funded teams risk wasted budgets and missed opportunities.
Our workforce planning software helps more than 9,500 organizations turn complex workforce data into clear, strategic decisions.
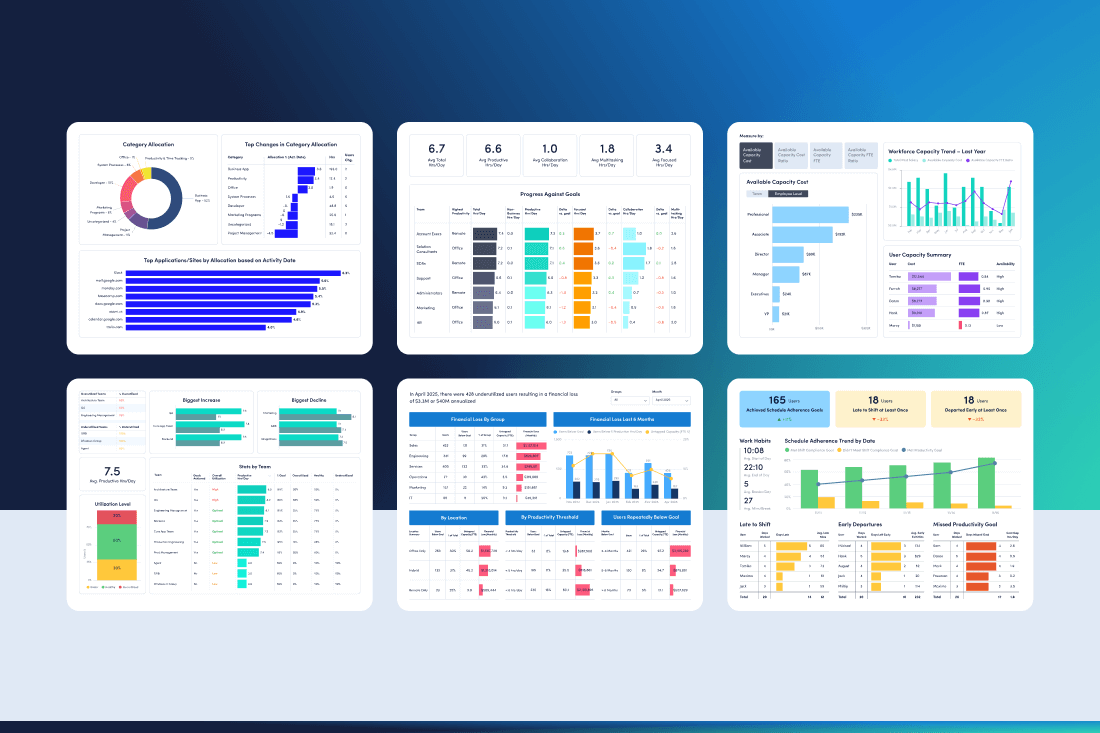
For this guide, we pulled together the most important reports leaders need right now. Think of it as your 2026 strategic workforce planning toolkit.
Ready to get started? Let’s dive right in.
Why do you need a workforce planning toolkit?
The best business leaders guide decisions with data. Yet 86% say the current onslaught of information makes those decisions more complicated than ever, and 72% claim it keeps them from making choices at all. The result? Budget blind spots, missed opportunities and thinly stretched teams.
In other words…
Simply having data isn’t enough. You need simple, reliable reports that make it easy to understand what’s happening with your workforce — and where to take action. These reports go beyond spreadsheets and raw numbers to help you:
- Pinpoint productivity gaps to show where teams lose time and help you redirect efforts to higher-value work.
- Validate contractor invoices by matching billed hours against actual activity to optimize external spend.
- Optimize headcount with real utilization trends that make it easy to align staffing with business needs.
- Track technology adoption to confirm if your tool investments deliver measurable ROI.
- Control costs by spotting underutilized capacity and resource imbalances across your workforce.
3 important reports for effective workforce planning
Most leaders struggle to measure the ROI of workforce investments. The solution? Clear visibility in three critical areas:
- Workforce Utilization (Financial Loss Analysis)
- Schedule Performance
- Technology Usage & Impact Analysis
Let’s review each in more detail.
1. Workforce Utilization (Financial Loss Analysis)
Every organization has hidden productivity gaps — time lost to hidden inefficiencies, misaligned resources, underutilized talent and more. Left unchecked, those gaps translate directly into lost dollars.
ActivTrak’s Workforce Utilization/Financial Loss Analysis report quantifies potential savings by showing where untapped capacity exists across teams. It highlights exactly how much money organizations lose each month to underutilization and helps you understand if it’s time to add headcount — or simply redistribute work.
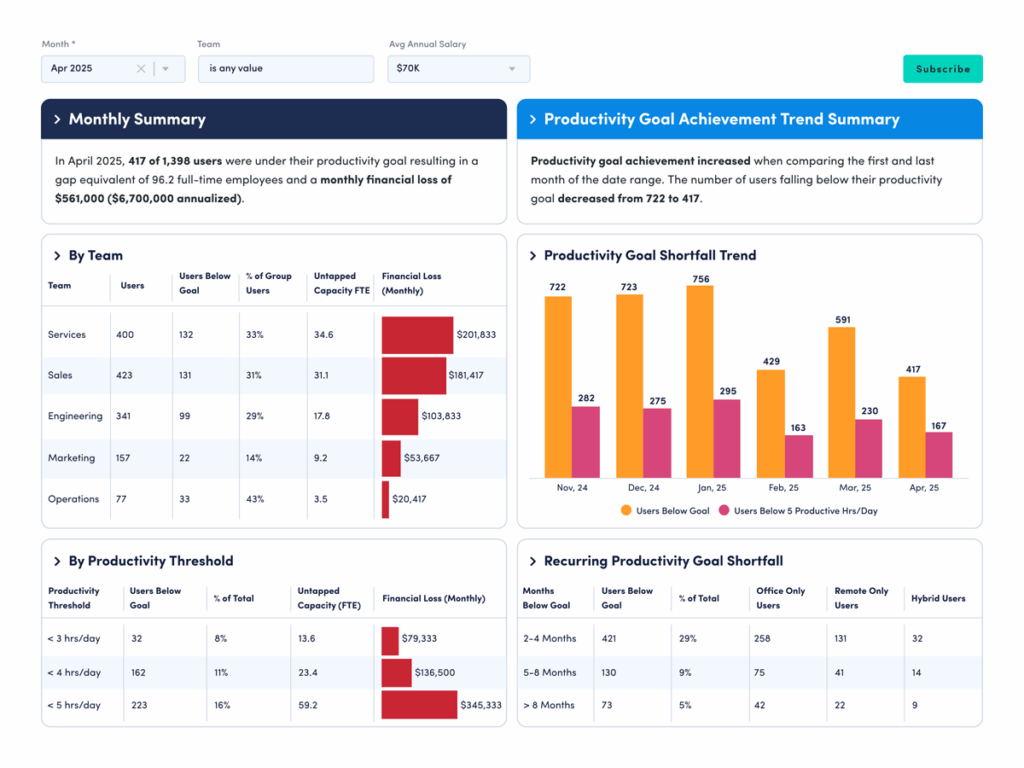
Use this report to:
- Establish a baseline of current productivity losses.
- Identify departments with the greatest untapped capacity to prioritize interventions.
- Monitor improvements quarterly and calculate dollar impact to prove ROI.
2. Schedule Adherence
Even high-performing teams struggle with inconsistent schedule coverage. The result? Missed collaboration windows, uneven workloads and compliance gaps that quietly drain efficiency.
ActivTrak’s Schedule Adherence report monitors how well employees follow assigned schedules and policies. It shows if teams are present during business-critical windows and whether gaps in coverage create downstream impact.
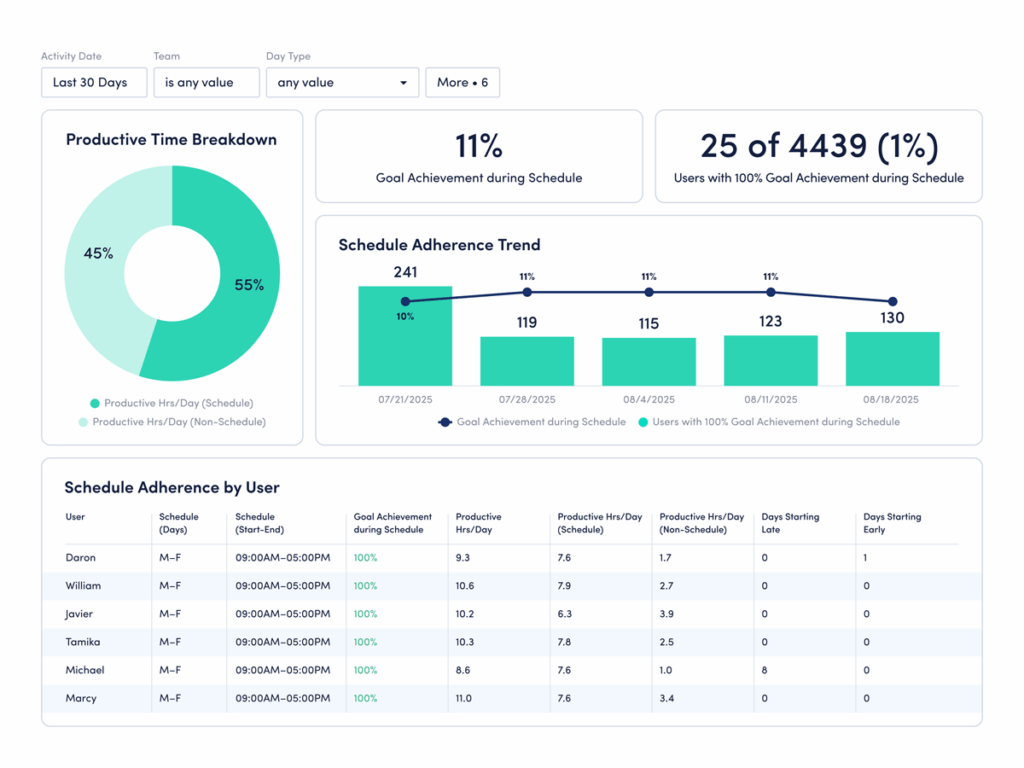
Use this report to:
- Validate whether current policies are realistic and if workloads are equitable across teams.
- Share insights with HR and operations leaders to adjust scheduling and align policies with actual work behavior.
- Plan ahead by modeling different coverage scenarios and adjusting resources proactively.
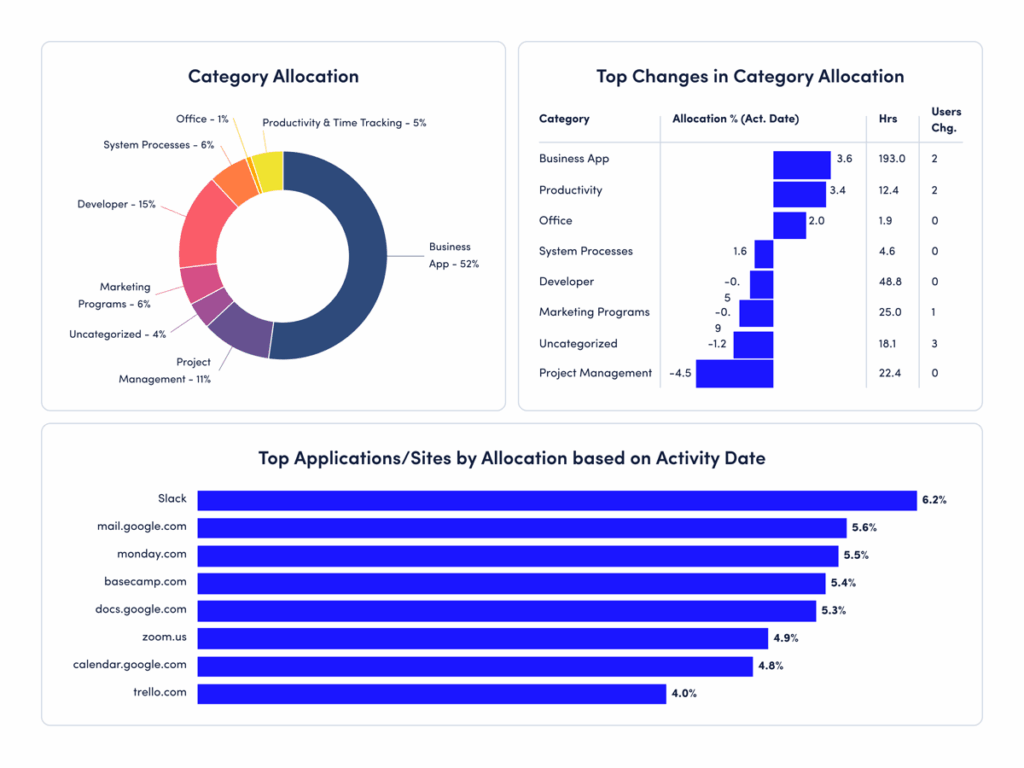
3. Technology Usage & Impact Analysis
Technology spend is one of the fastest-growing budget items for most organizations, but many licenses go unused. Meanwhile, companies rush to adopt AI with no clear way to measure ROI.
ActivTrak brings clarity to both areas. Technology Utilization reports track application adoption and time allocation, uncovering underused or redundant licenses.
Meanwhile, Impact Analysis reports compare productivity before and after tool rollouts, helping leaders prove the ROI of AI investments. Together, these reports make it easy to determine where to expand or reduce investments.
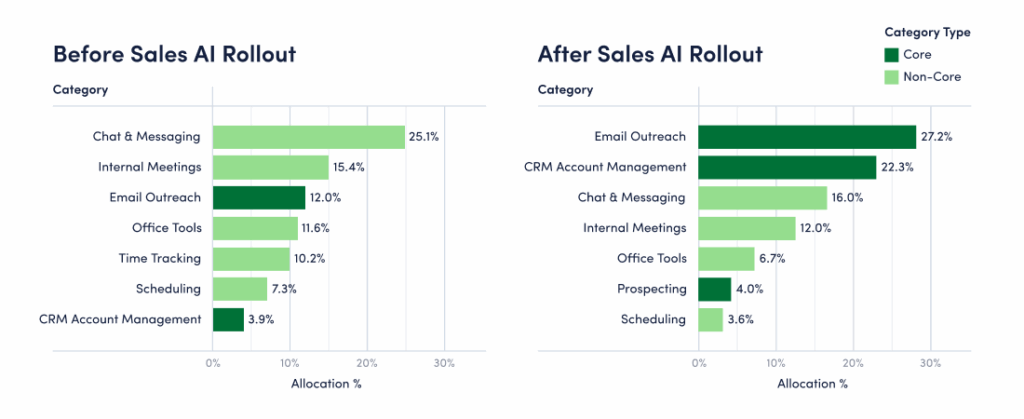
Use these reports to:
- Audit current technology spend by reviewing usage patterns.
- Eliminate waste by retiring underused tools or consolidating overlapping platforms.
- Measure whether AI adoption improves outcomes and adjust future investments accordingly.
How to put your workforce planning reports to work
Reports alone don’t drive change — the way you use them does. While the reports above provide the essential foundation for successful workforce planning, it’s equally important to follow several best practices.
- Start with a baseline: Capture your current state across financial losses, schedules and technology adoption.
- Target high-impact areas: Focus on departments with the most untapped capacity or licenses with the highest waste.
- Track progress continuously: Review quarterly improvements to ensure interventions stick.
- Measure ROI in dollars: Translate improvements into savings, reclaimed FTE equivalents or avoided hiring costs.
- Share results: Present findings in simple, goal-oriented summaries highlighting wins and next steps.
The most successful leaders treat workforce planning as an ongoing process. Embedding these reports into your quarterly review cycle ensures data-driven, future-focused decision-making.
Start your journey to smarter workforce planning
Making the most of your workforce investments involves a lot more than managing headcount. It’s a way to build resilience and prepare your teams for whatever comes next. The right reports turn workforce data into a strategic advantage — helping you optimize what you have and plan effectively for what you need.
Want to learn more? Download the full 2026 toolkit for the complete set of reports and templates.
Not using ActivTrak yet? Sign up for your free account to get started today, and request a demo for a personalized look at how organizations like yours rely on ActivTrak for accurate, real-time insights.