Performance Management & Coaching
Trusted by 9,500+ global brands and organizations
Performance Management & Coaching
Measure and optimize productivity across your organization
Turn workforce data into performance insights. ActivTrak shows how engagement, focus and location affect outcomes so managers can coach more effectively.
- Connect activity patterns to performance outcomes
- Empower managers with proactive coaching support
- Understand how location impacts productivity
- Set goals and track progress toward improvement

Vice-President in IT
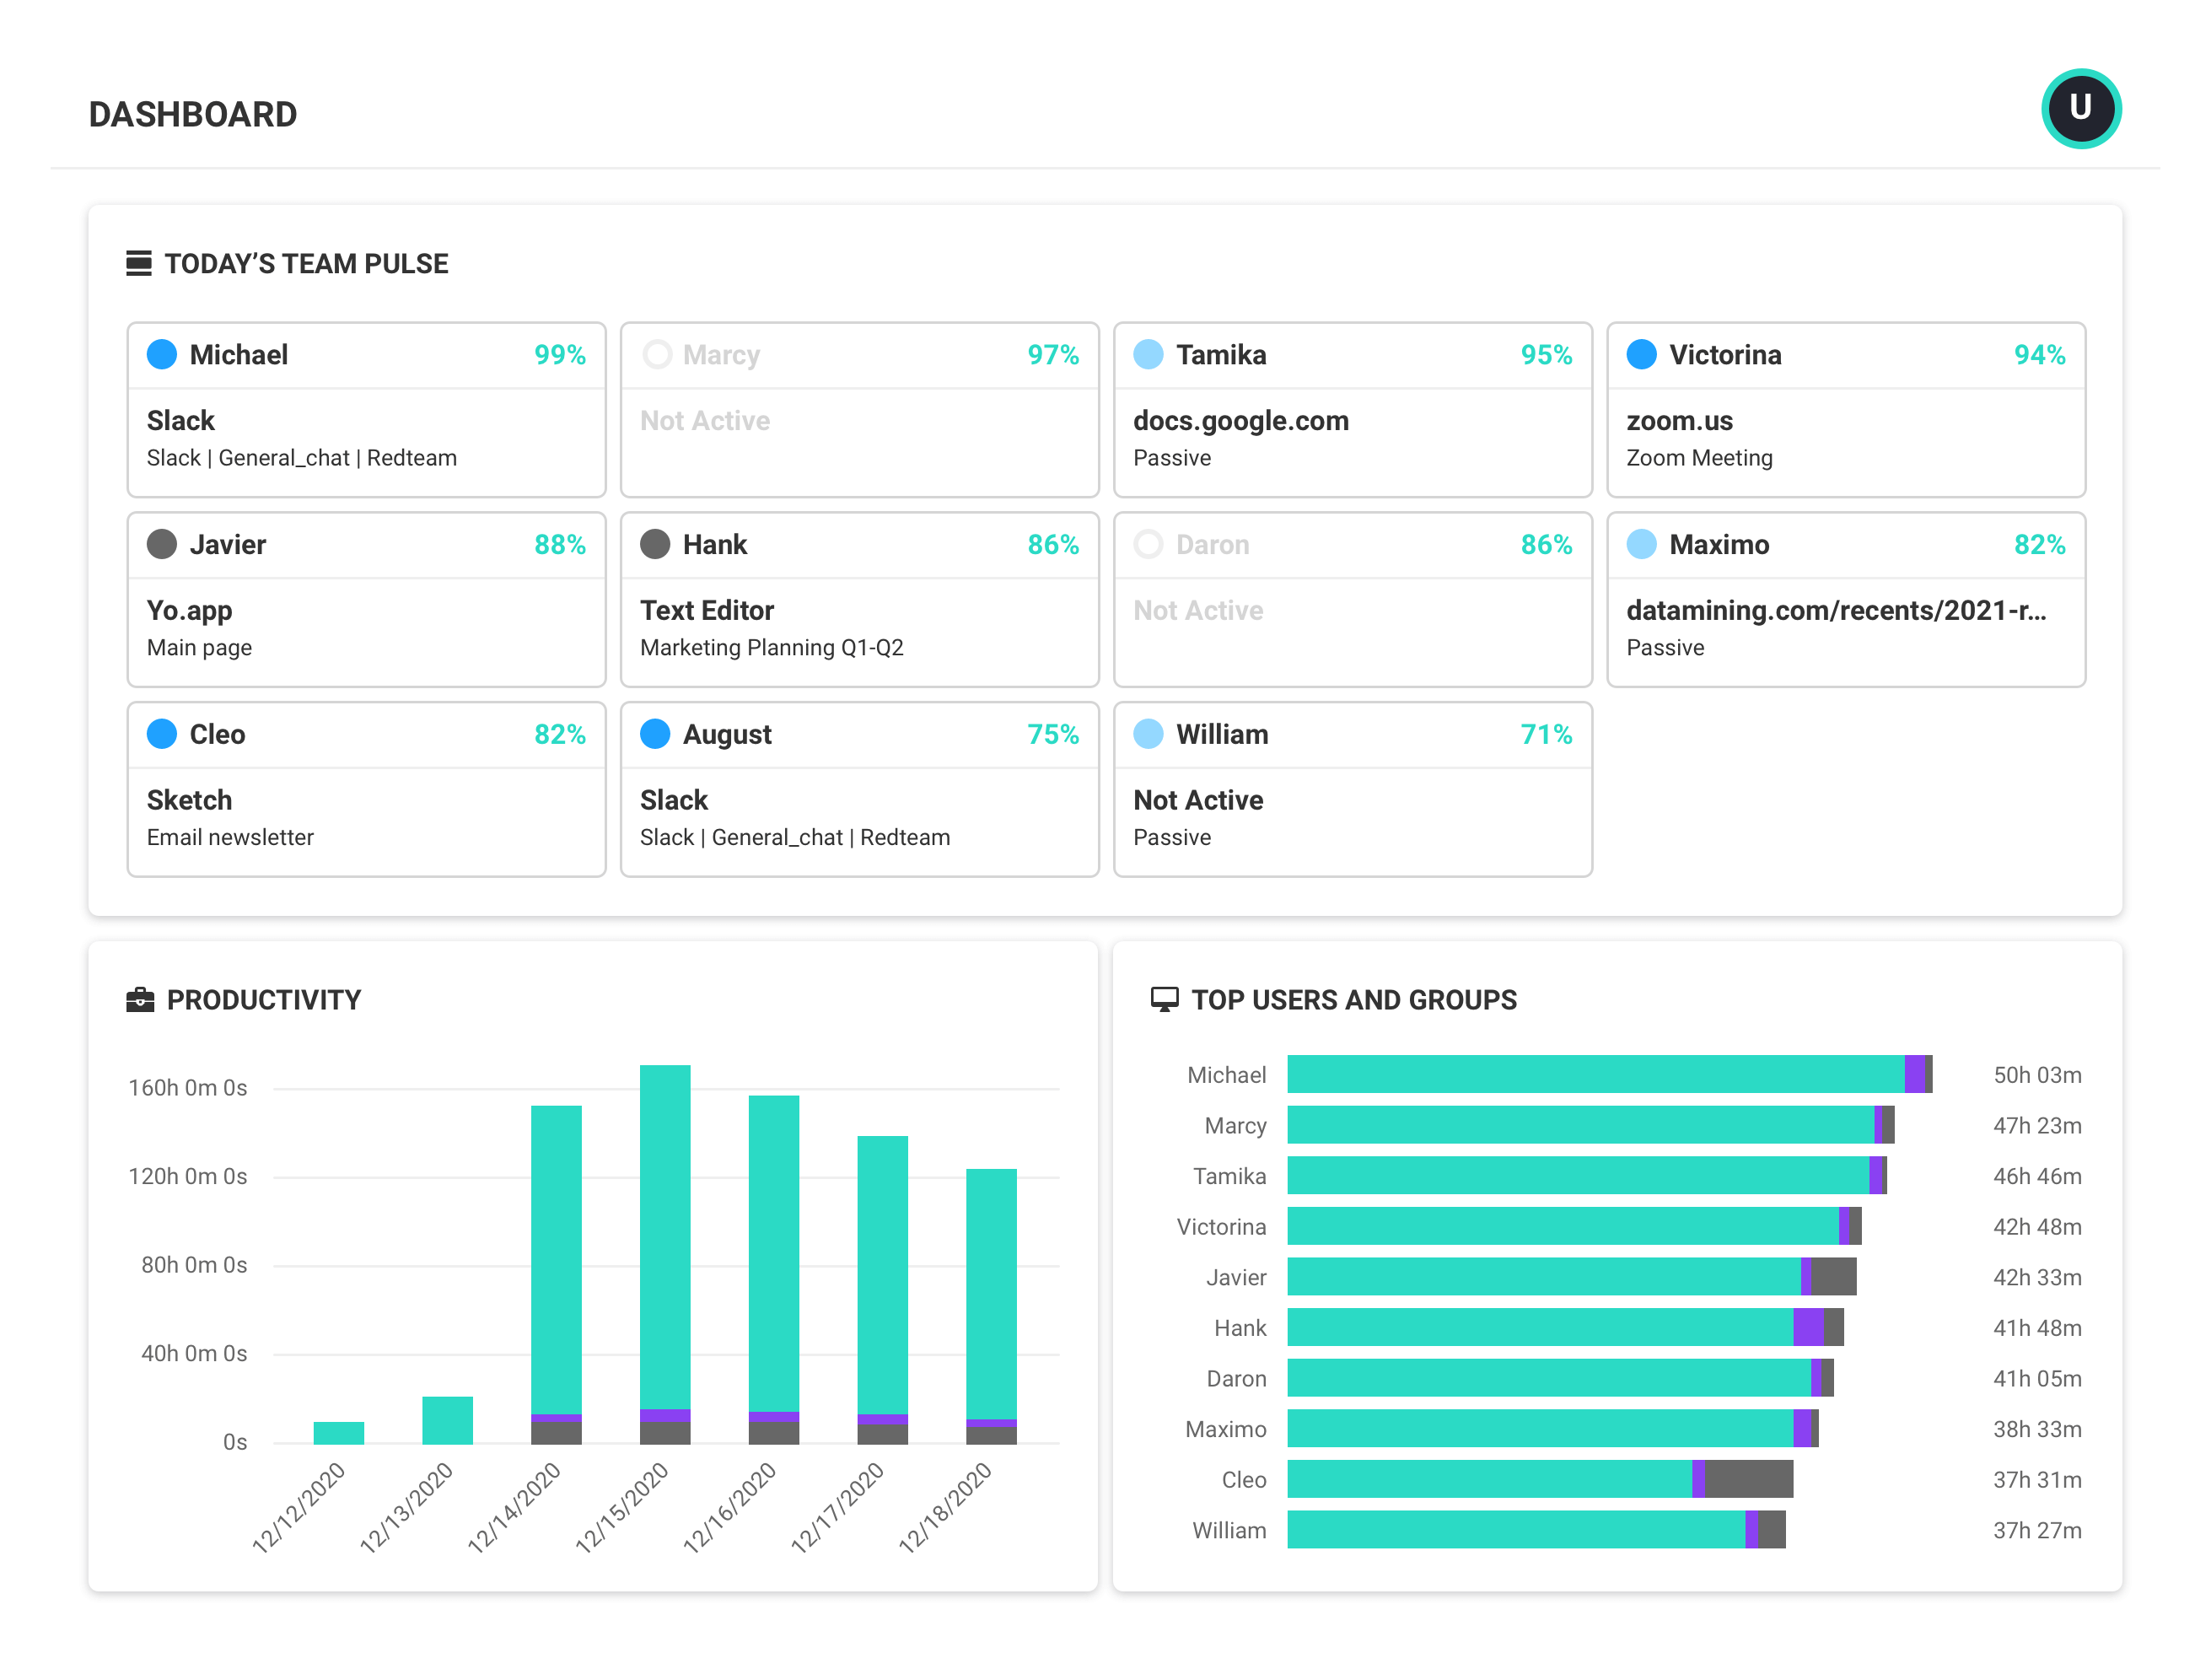
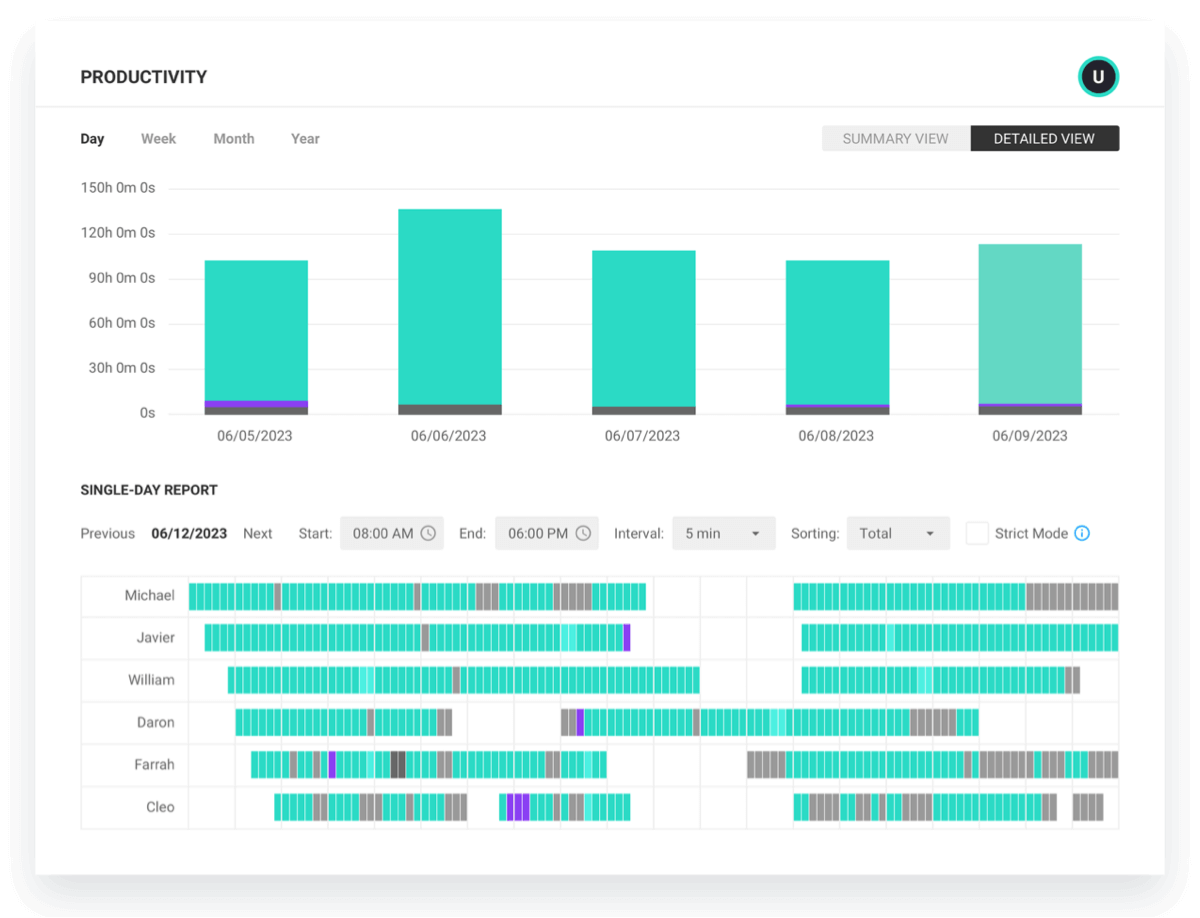
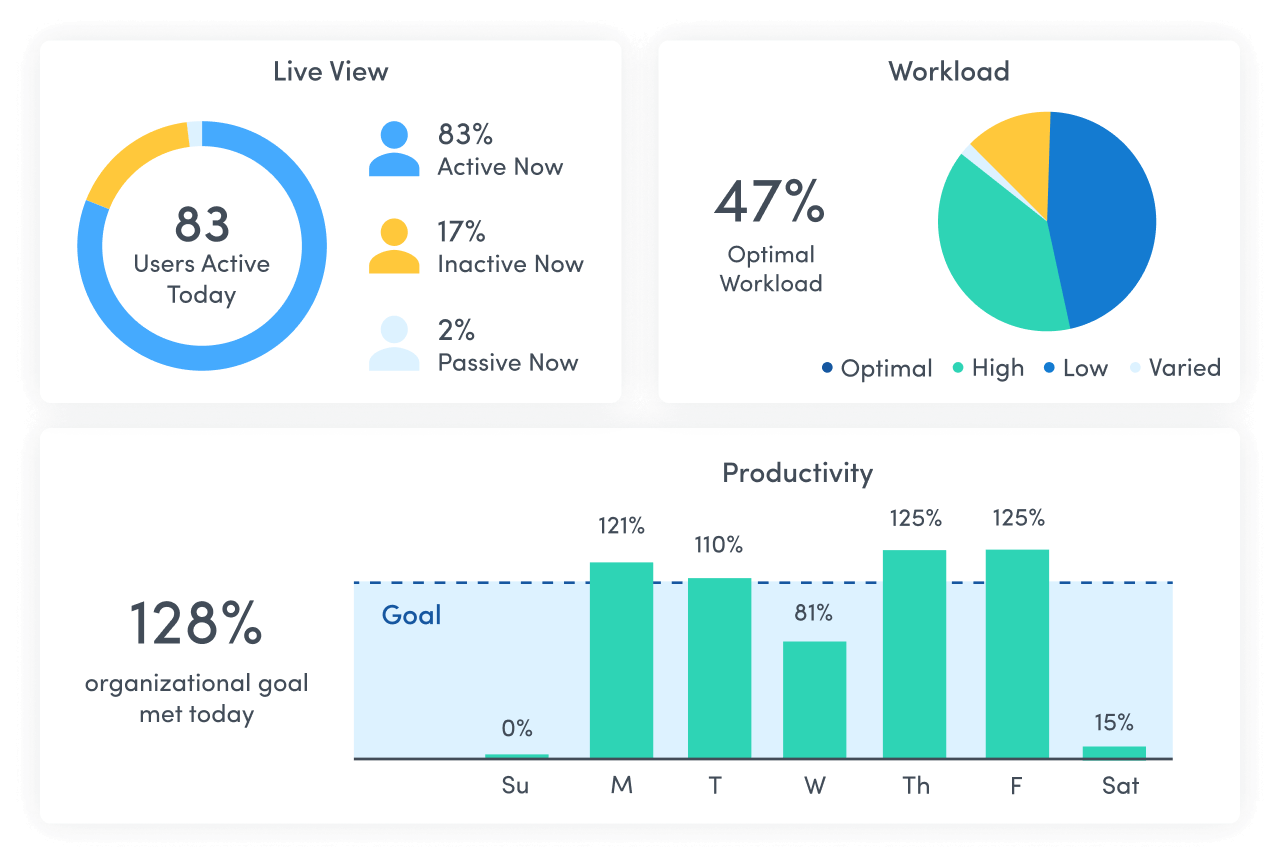
PRODUCTIVITY INSIGHTS
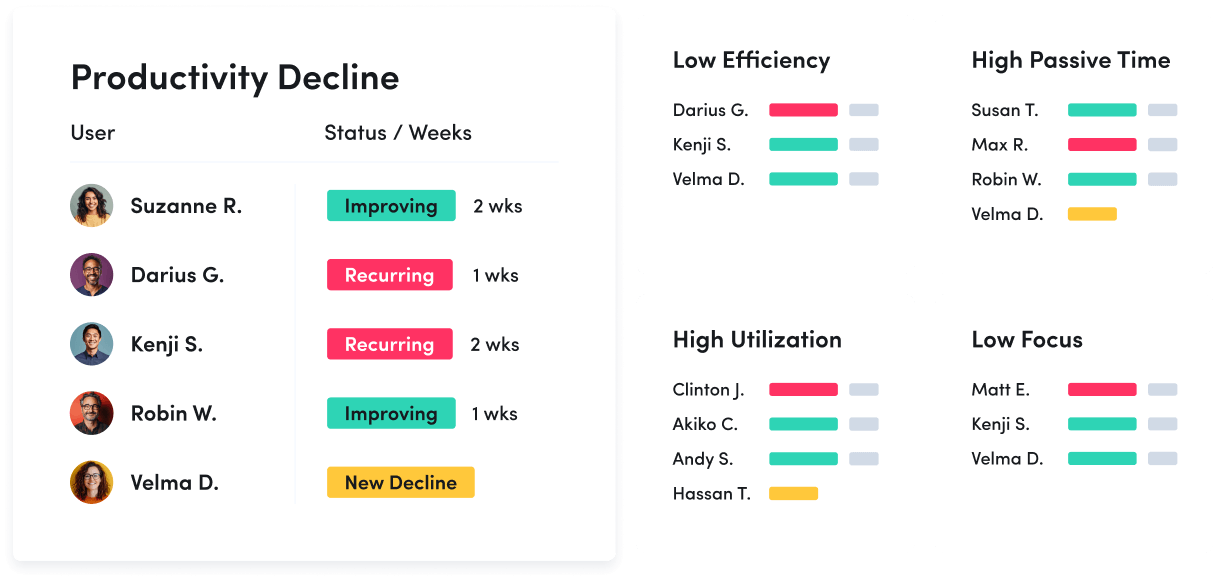
Connect activity patterns to performance outcomes
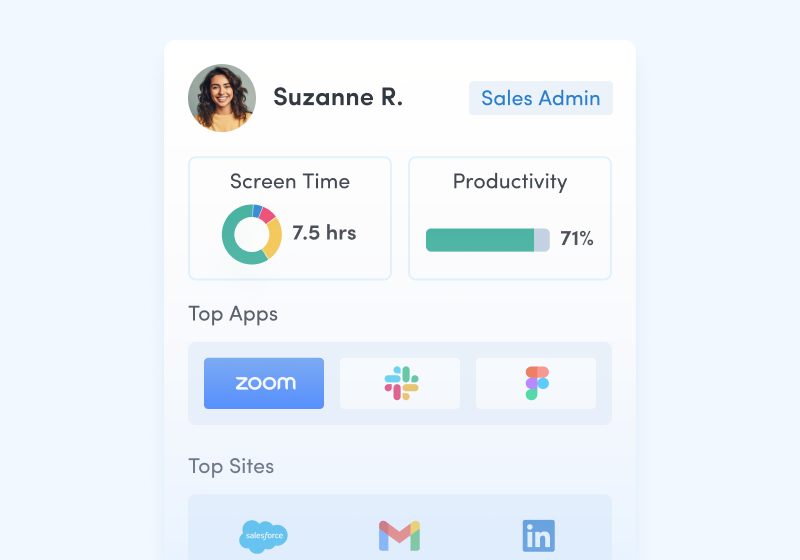
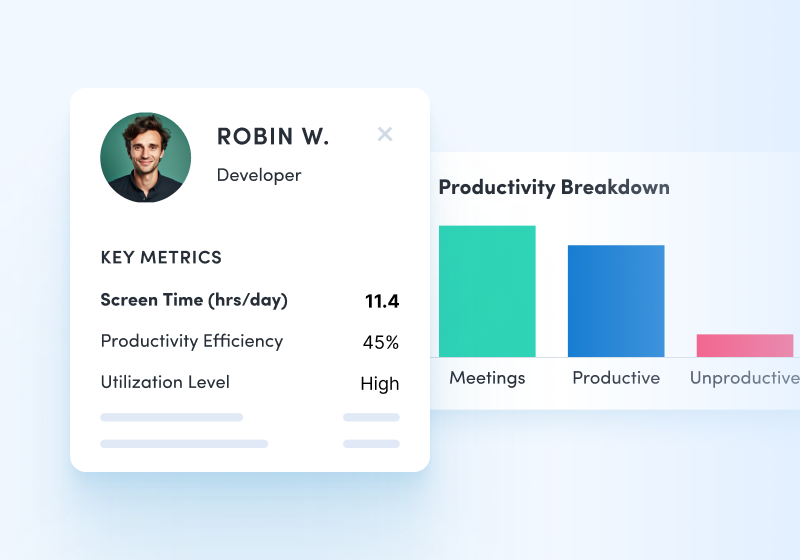
- Understand work habits with in-depth productivity metrics
- Analyze how employees spend time to find areas for improvement
- See how technology helps or hinders operational efficiency
- Detect quiet quitting to ensure engagement, utilization and workload balance
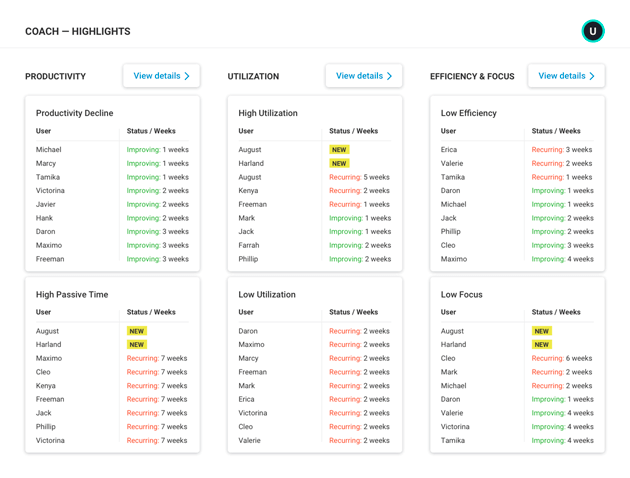
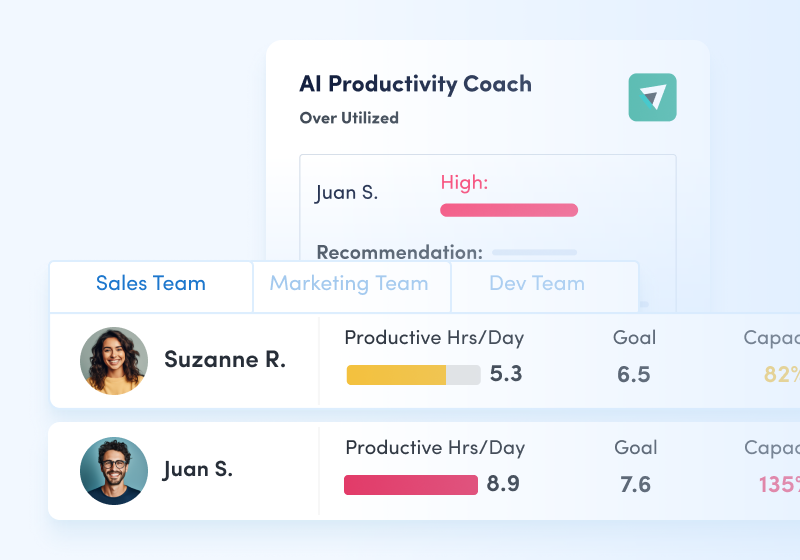
AI-POWERED COACHING
Empower managers with proactive coaching support
- Identify when productivity or engagement drops
- Recommend improvements with AI-powered insights
- Give employees access to personal work habit insights
- Keep tabs on team progress with automated email reports
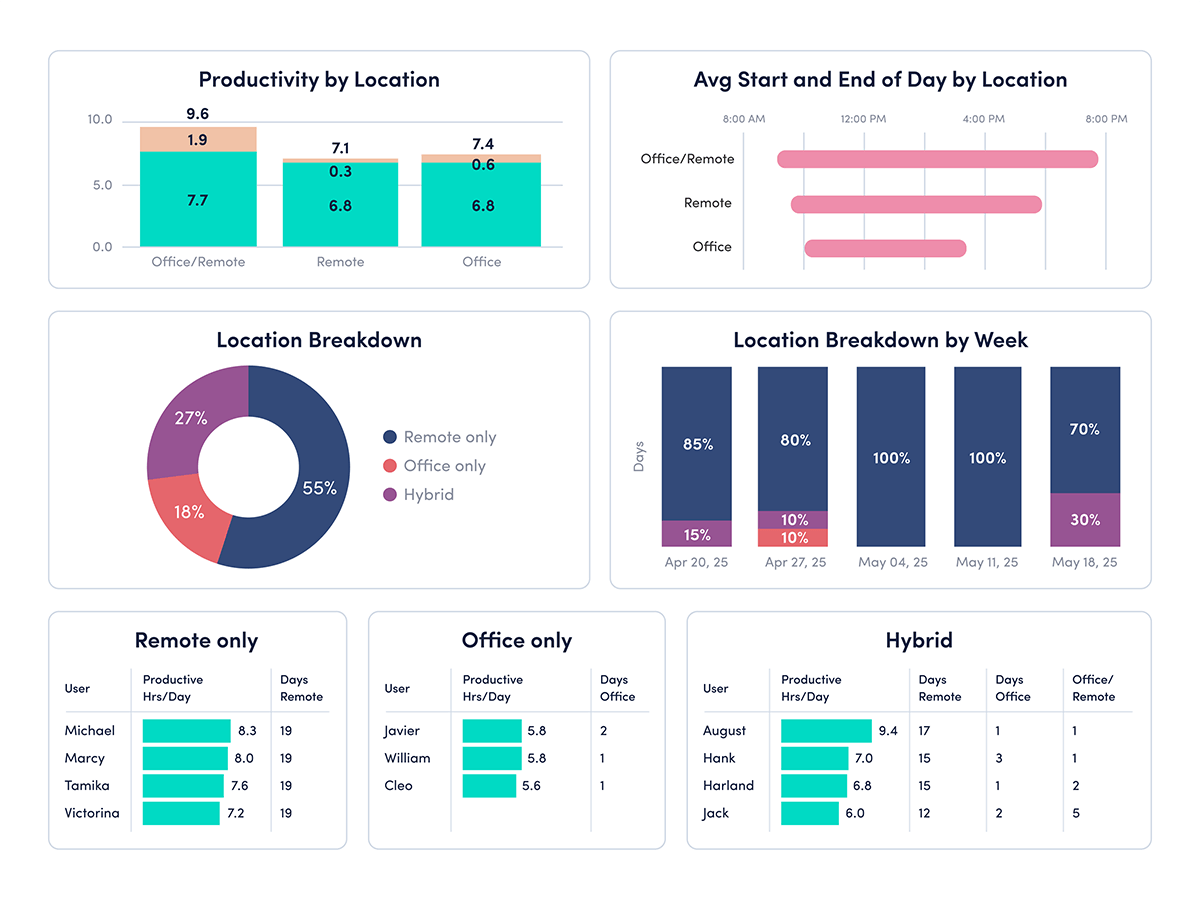
PRODUCTIVITY BY LOCATION
Understand how location impacts productivity
- Auto-detect remote vs. in-office work with AI
- Compare productivity by location to inform policy decisions
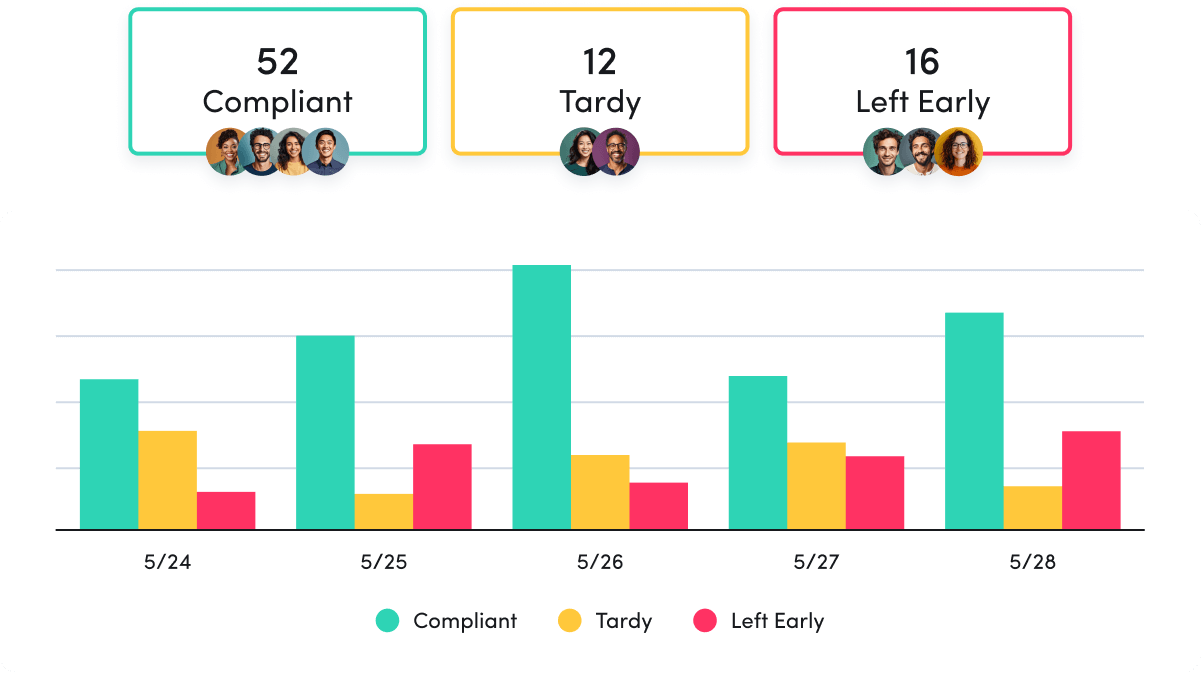
- Verify compliance and the impact of policy changes
- Right-size office space with data-based decisions
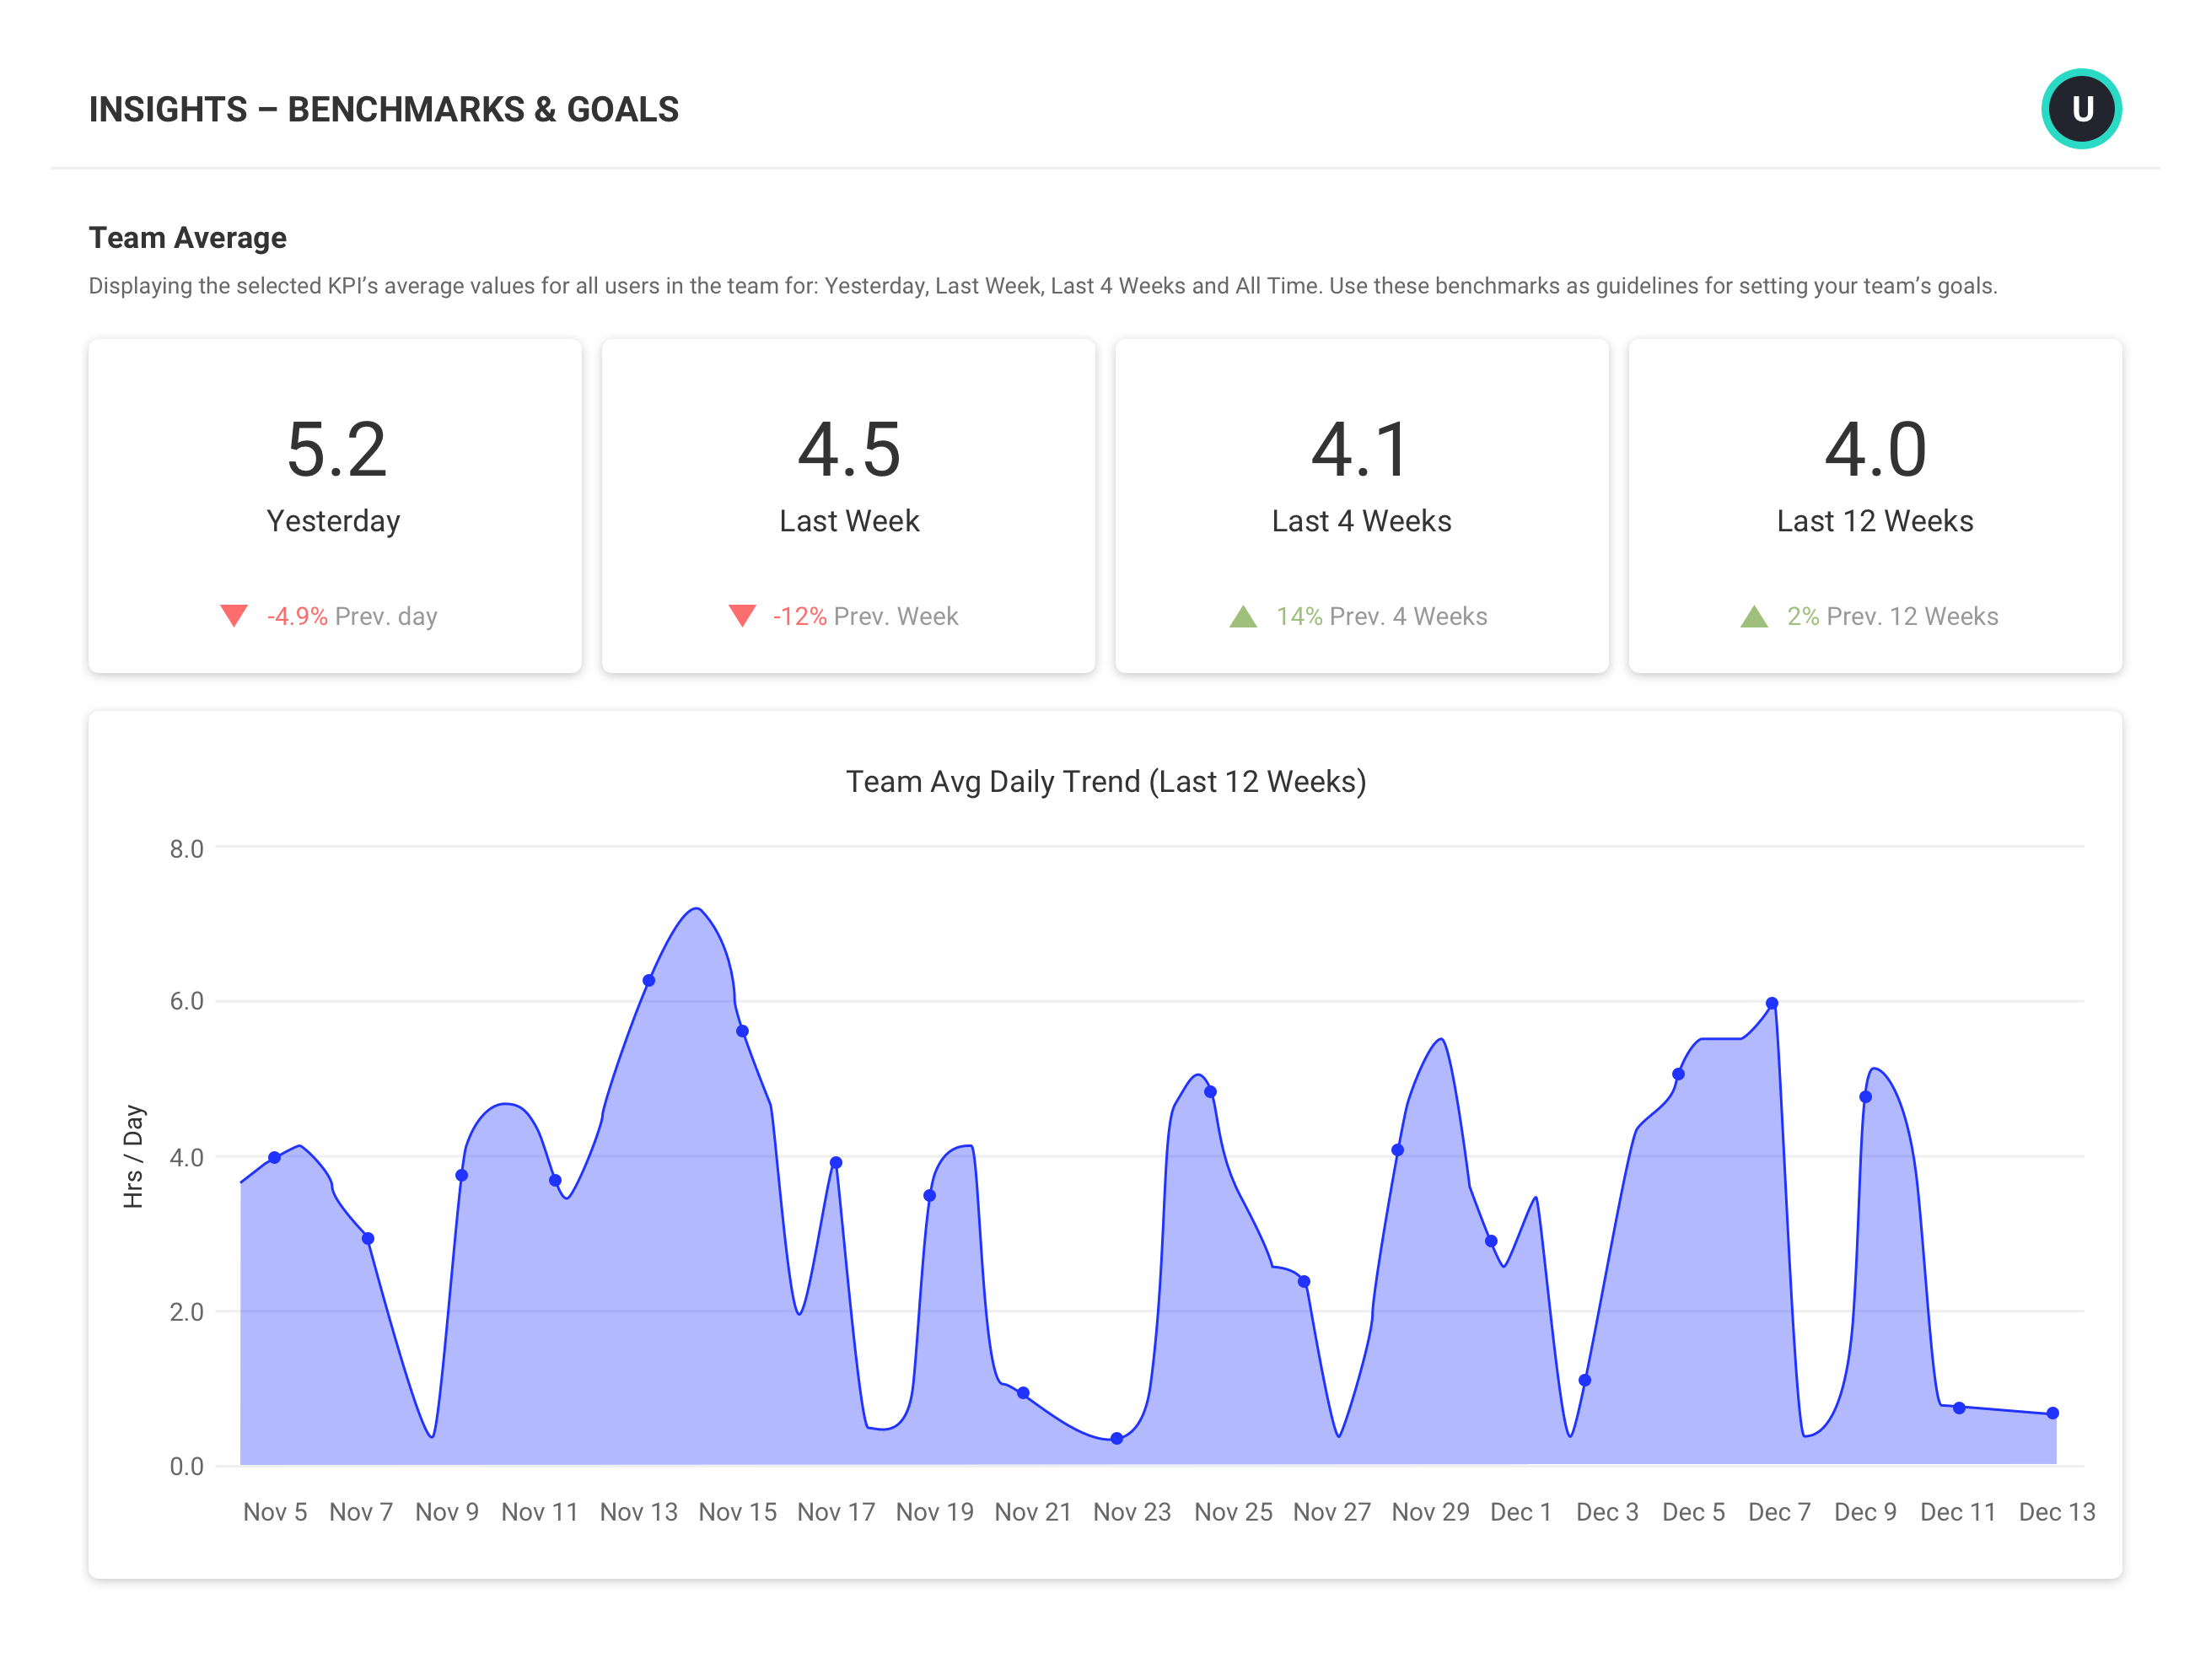
BENCHMARKS & GOALS
Set goals and track progress toward improvement
- Benchmark performance to identify gaps and improvement opportunities
- Align roles and responsibilities with data-based goals
- Track changes in employee productivity, focus and collaboration
- Monitor trends to measure progress over time
What you can do with ActivTrak
ActivTrak gives you the work intelligence to understand how work happens across people, tools and AI. Measure productivity, improve efficiency, and see how AI is changing workflows—so you can improve performance across your organization.
Executive Insights
Transform workforce data into boardroom-ready insights. See cross-team performance, identify hidden cost savings and make confident decisions that drive measurable business outcomes.
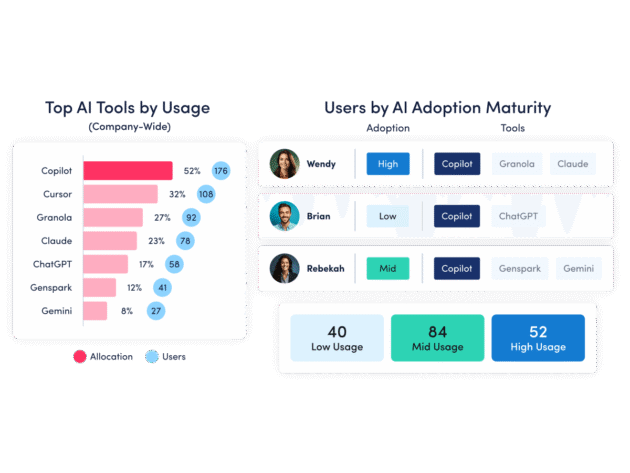
AI Insights
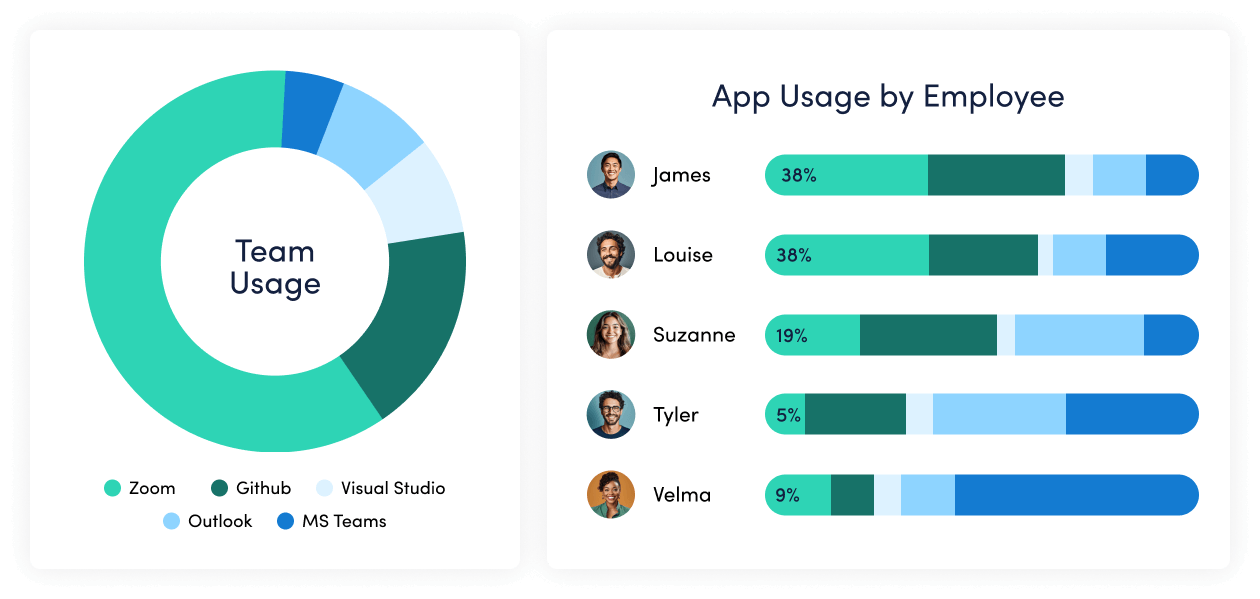
Understand how tools — and AI — are shaping work. See how applications and AI tools are used. Identify what’s driving value, where licenses are underused and how workflows are evolving.
Workforce Management
Understand how work happens across your organization. Analyze work patterns across teams, roles and tools to see where time goes, where friction exists and where performance can improve.
Productivity Optimization
Improve performance with data-driven insight. Quantify productivity, identify capacity and help teams work in more effective, sustainable ways.
Technology Usage & Compliance
Optimize technology investments and ensure compliance. Understand which applications and websites employees use to drive adoption or cut costs, and enforce policies aimed at mitigating risk.
Connect work intelligence across your tech stack
Integrate existing tools to combine workforce activity, AI usage and business data for deeper, more actionable insights.
Workday
ADP

Microsoft Teams
Outlook

Google Calendar
ServiceNow
Zendesk
ChatGPT
Claude
Gemini
Microsoft Viva
Jira Software
Salesforce
Slack
How It Works
Capture behavioral activity
Capture behavioral activity including hours worked, schedule adherence, location policy compliance and app & website usage.
Analyze productivity trends
Analyze productivity trends on employee focus, engagement and utilization to make data-informed decisions on resource allocation.
Optimize team performance
Optimize team performance with benchmarks, goal-tracking and AI coaching recommendations to improve workforce productivity.
See what customers say about ActivTrak
Powered by![]()