Trusted by 9,500+ global brands and organizations
Gain clear insights into SaaS application usage across the organization
Recent data shows that on average, enterprises have 280+ different SaaS apps across their business – that is up 30% year over year and continuing to grow.
ActivTrak delivers the visibility IT professionals need to:
- Execute key admin functions and improve data visibility
- Understand application & website usage – SaaS or otherwise
- Shore up security gaps
- Implement compliance safeguards

“The data and insight provided by the built-in dashboards is everything we wanted and more, and our employees enjoy having access to their data to monitor their own performance and productivity.”
– Director Of Business Development, Services Industry
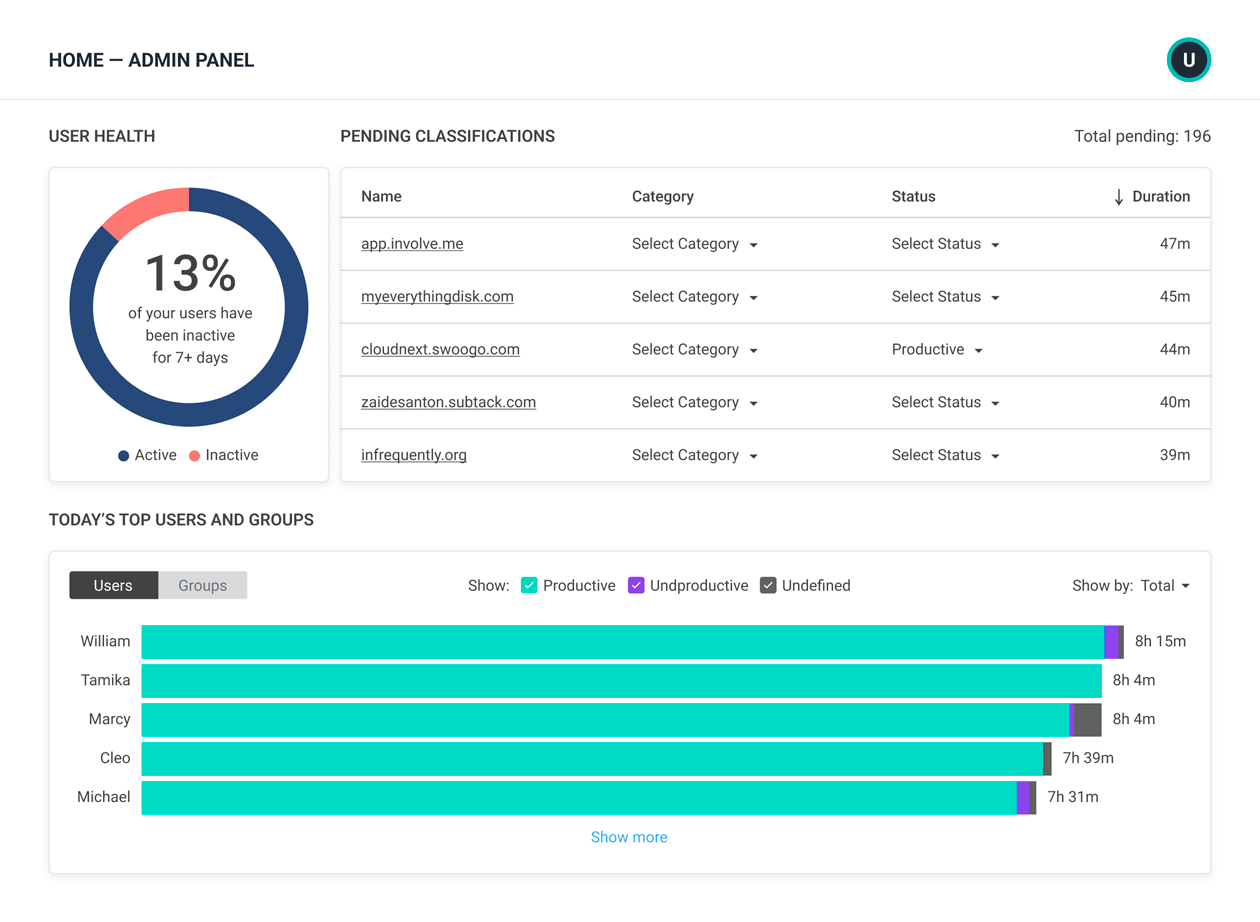
ADMIN PANEL
Execute key admin functions and improve data visibility
- See all reporting ActivTrak agents instantly
- Add team members to the account or create a group — with a single click
- Connect the most used unclassified activities to their productivity status with just a few clicks
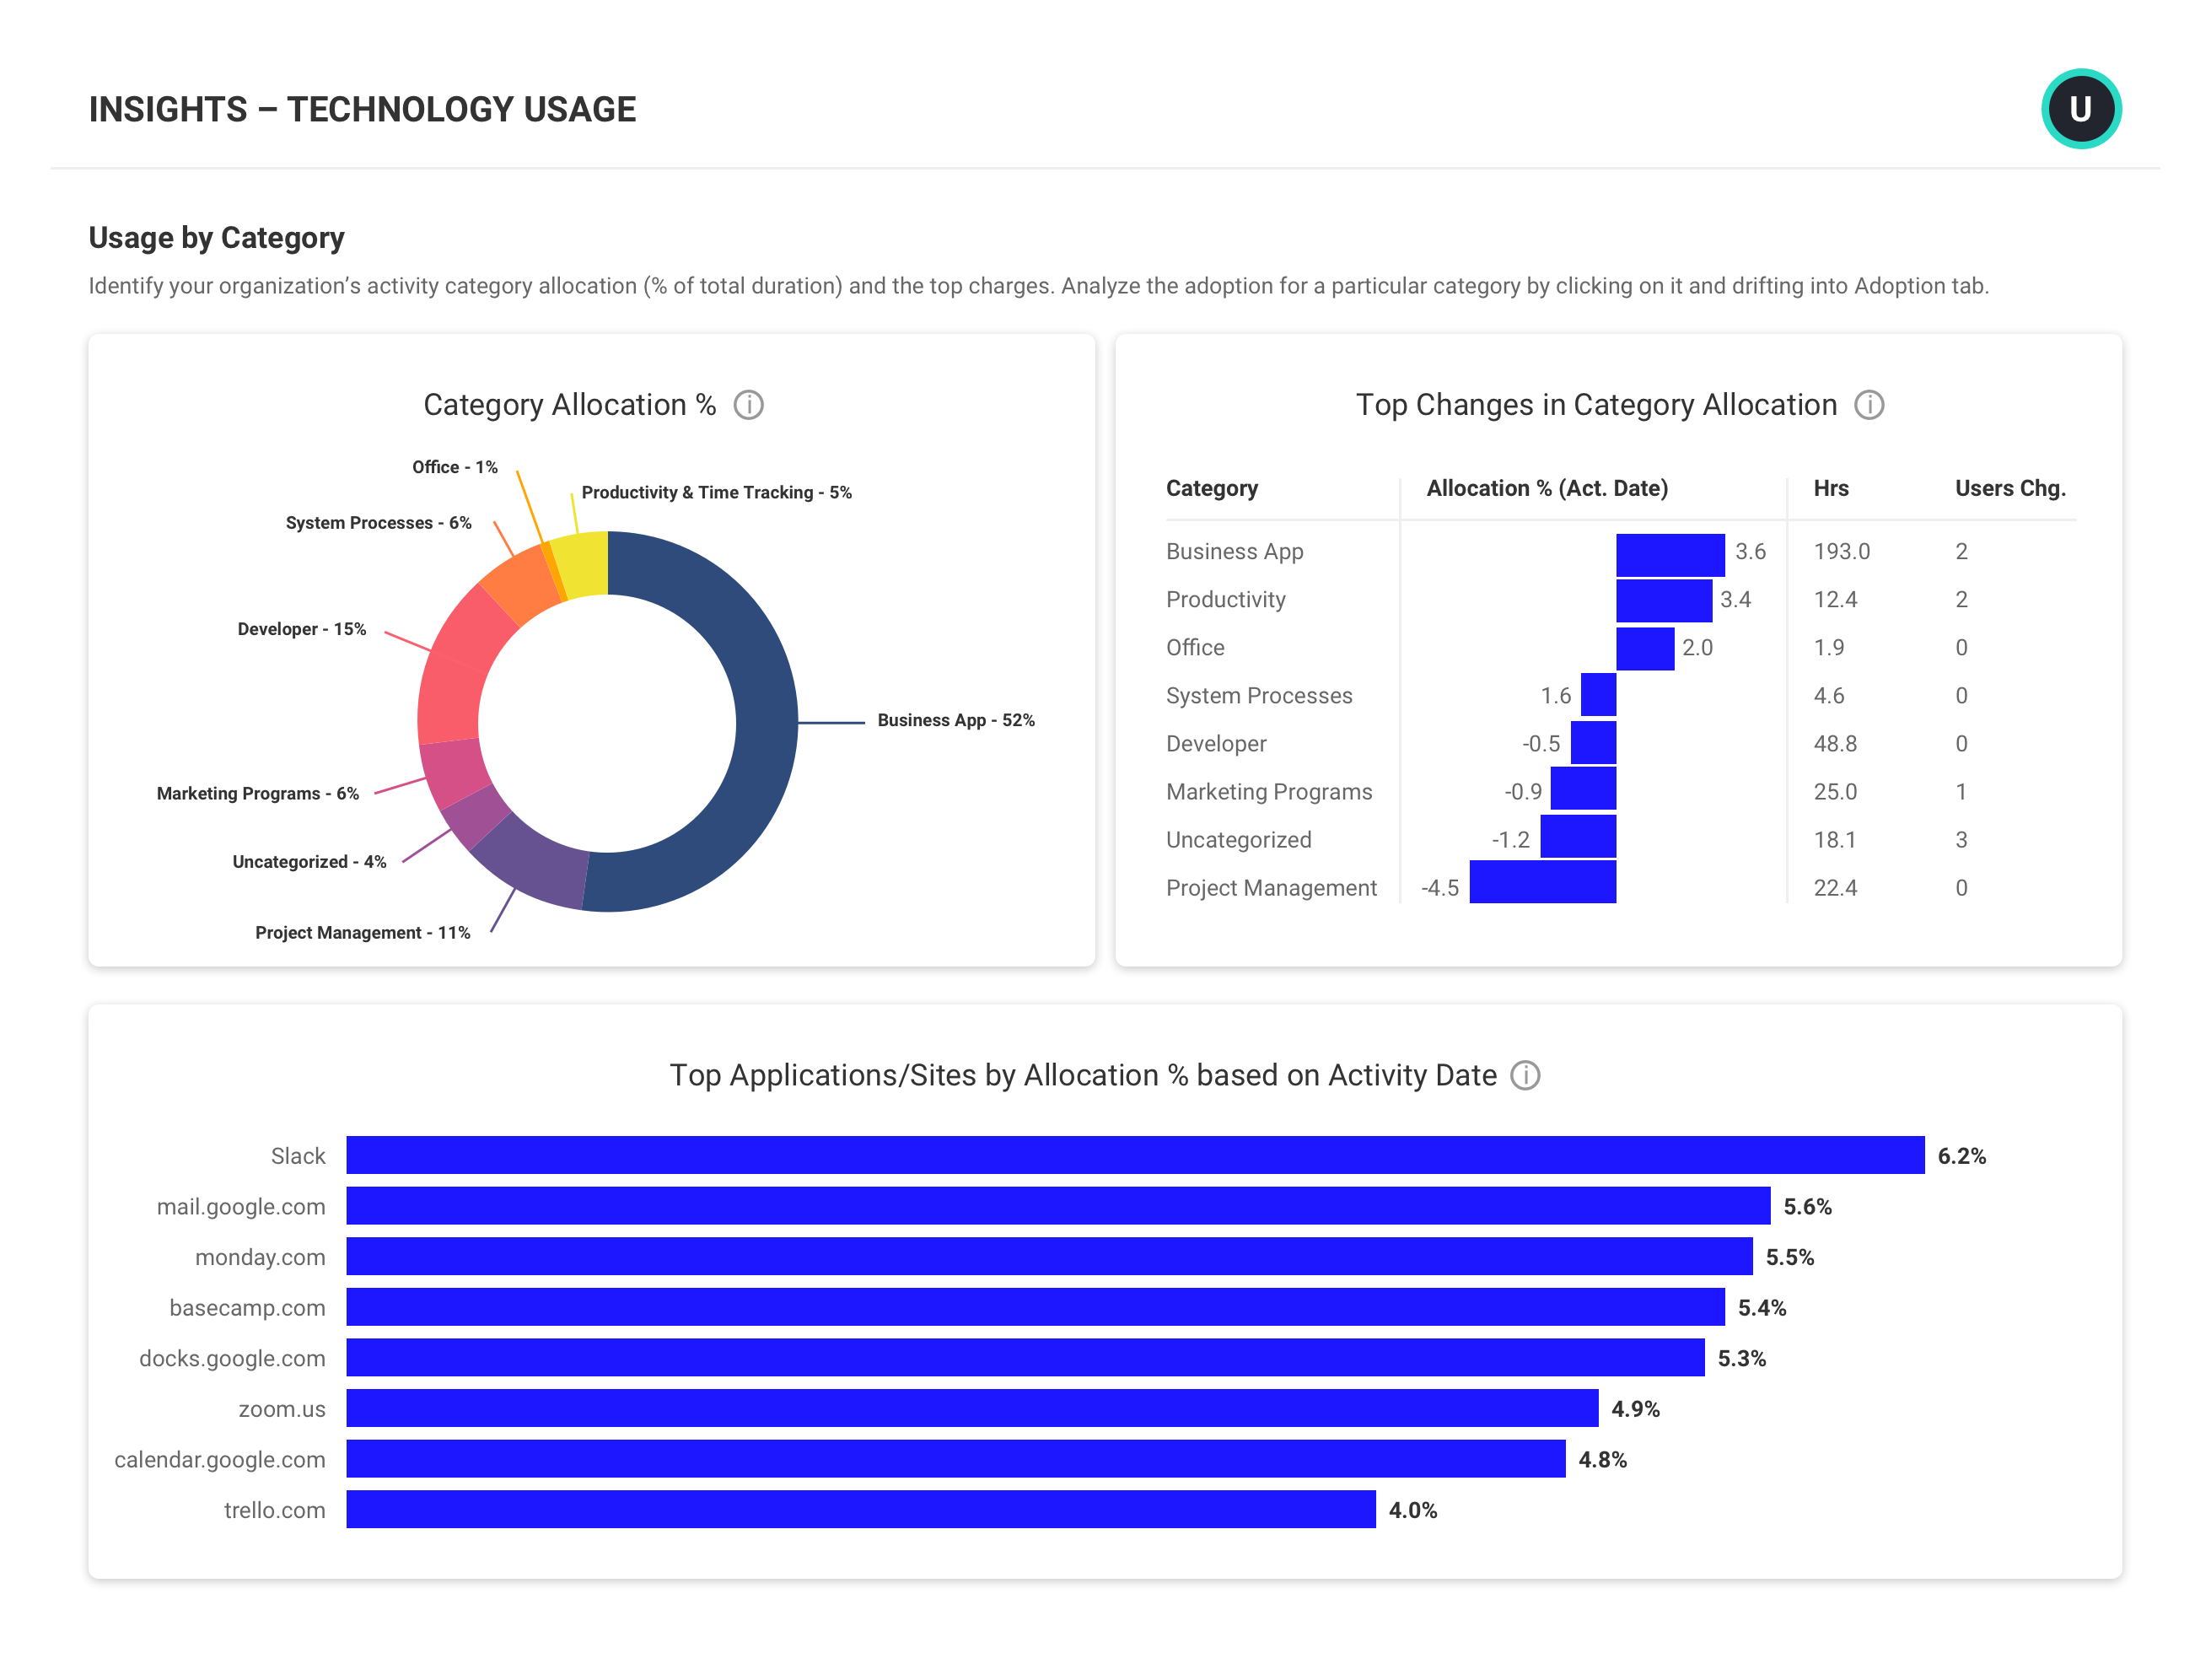
APPLICATION & WEBSITE USAGE
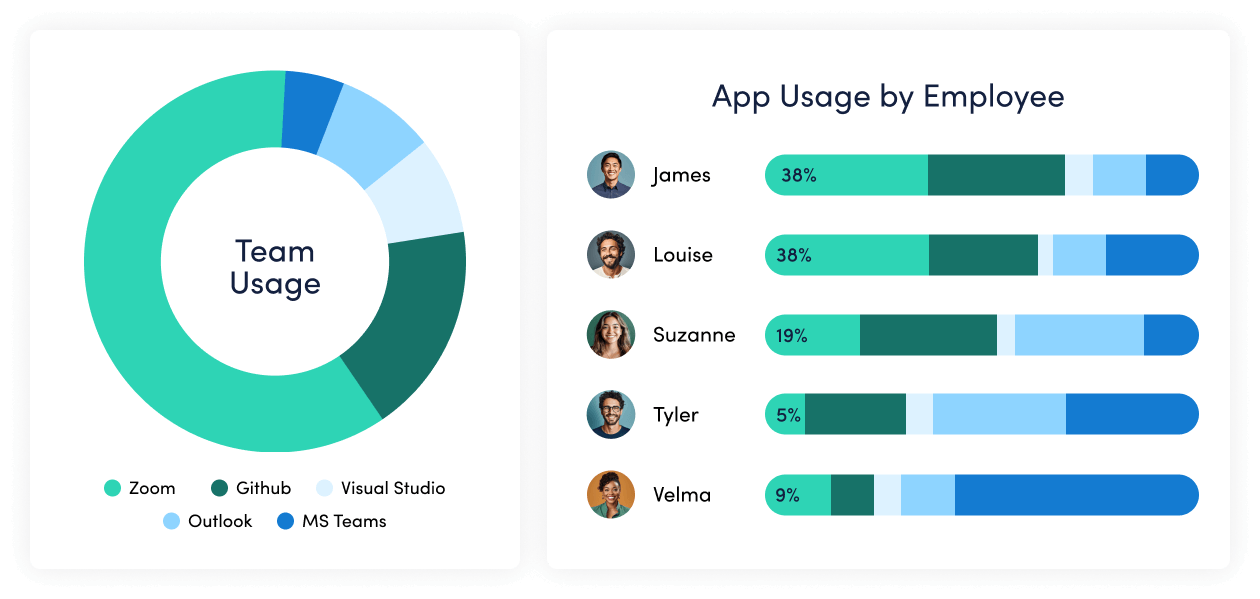
Understand application & website usage
- Discover what applications facilitate productivity to inform decision makers
- Identify frequently used unproductive applications or websites to set usage limits
- Uncover unused or unnecessary software licenses to recoup costs
PRIVACY & SECURITY
Shore up security gaps
- Get immediate alerts on external device use and suspicious web visits and automatically block.
- Gain visibility into how sensitive data is being handled
- Automatically block or terminate applications you identify as potential malware.
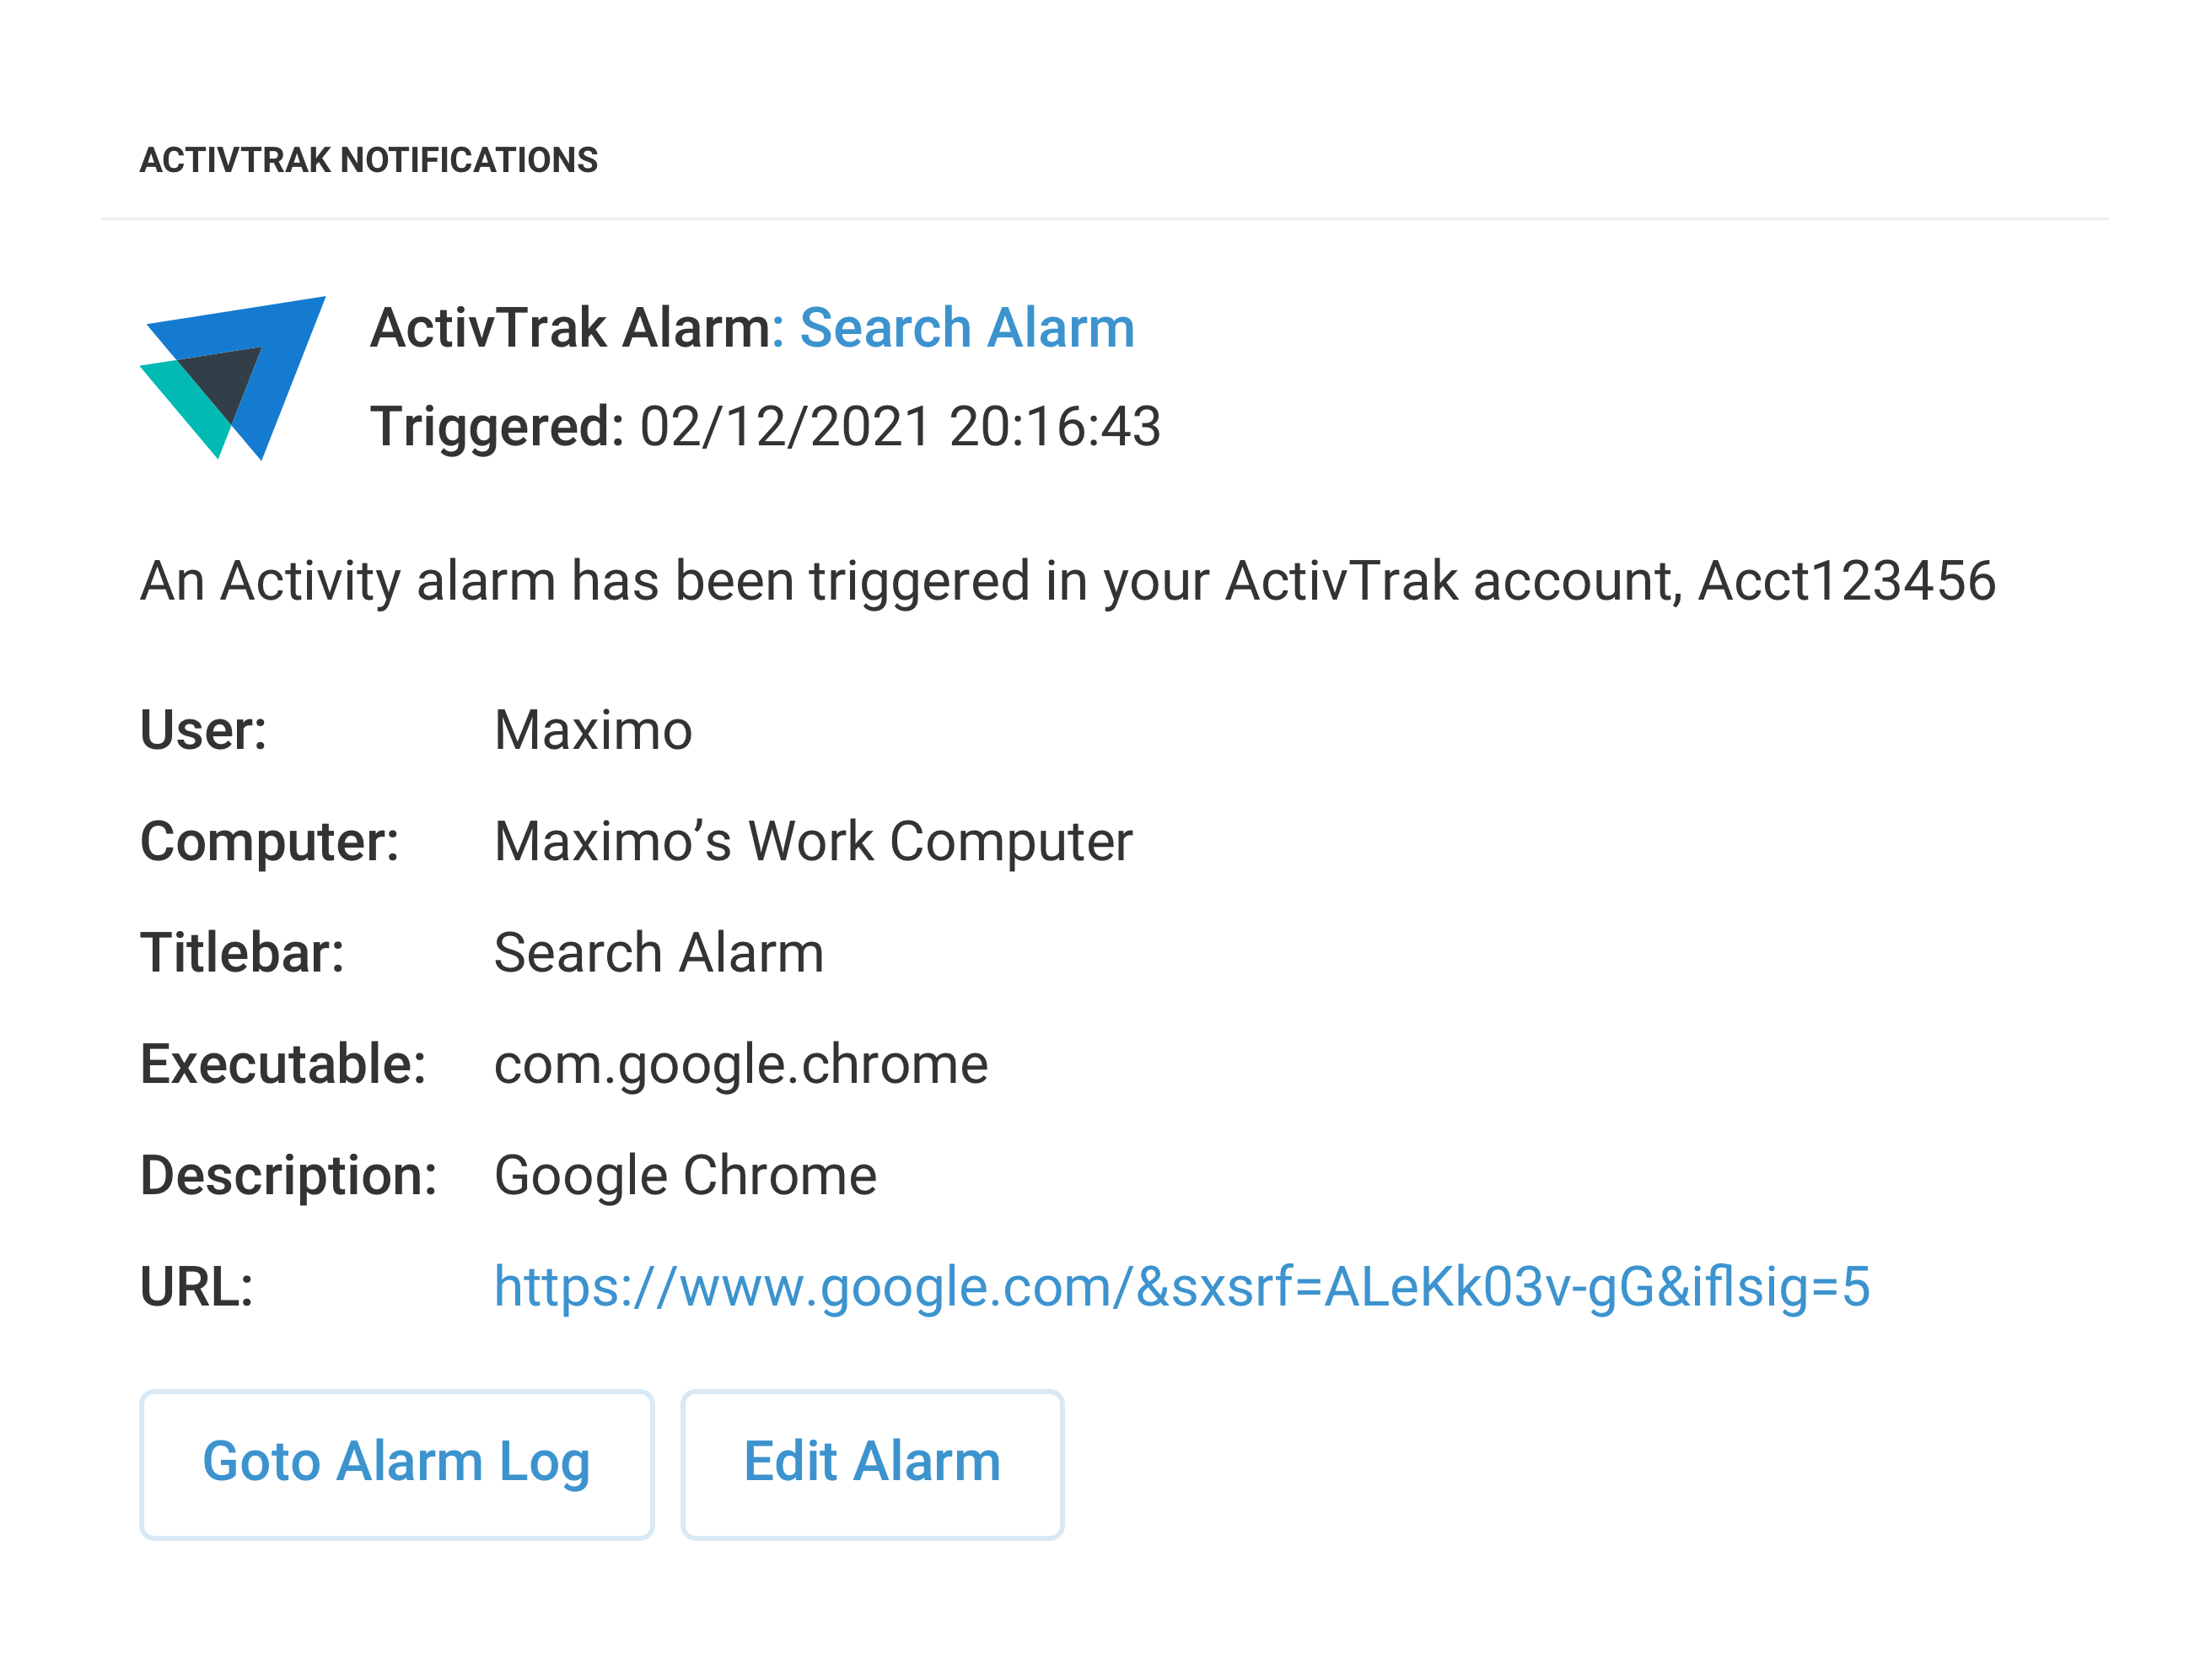
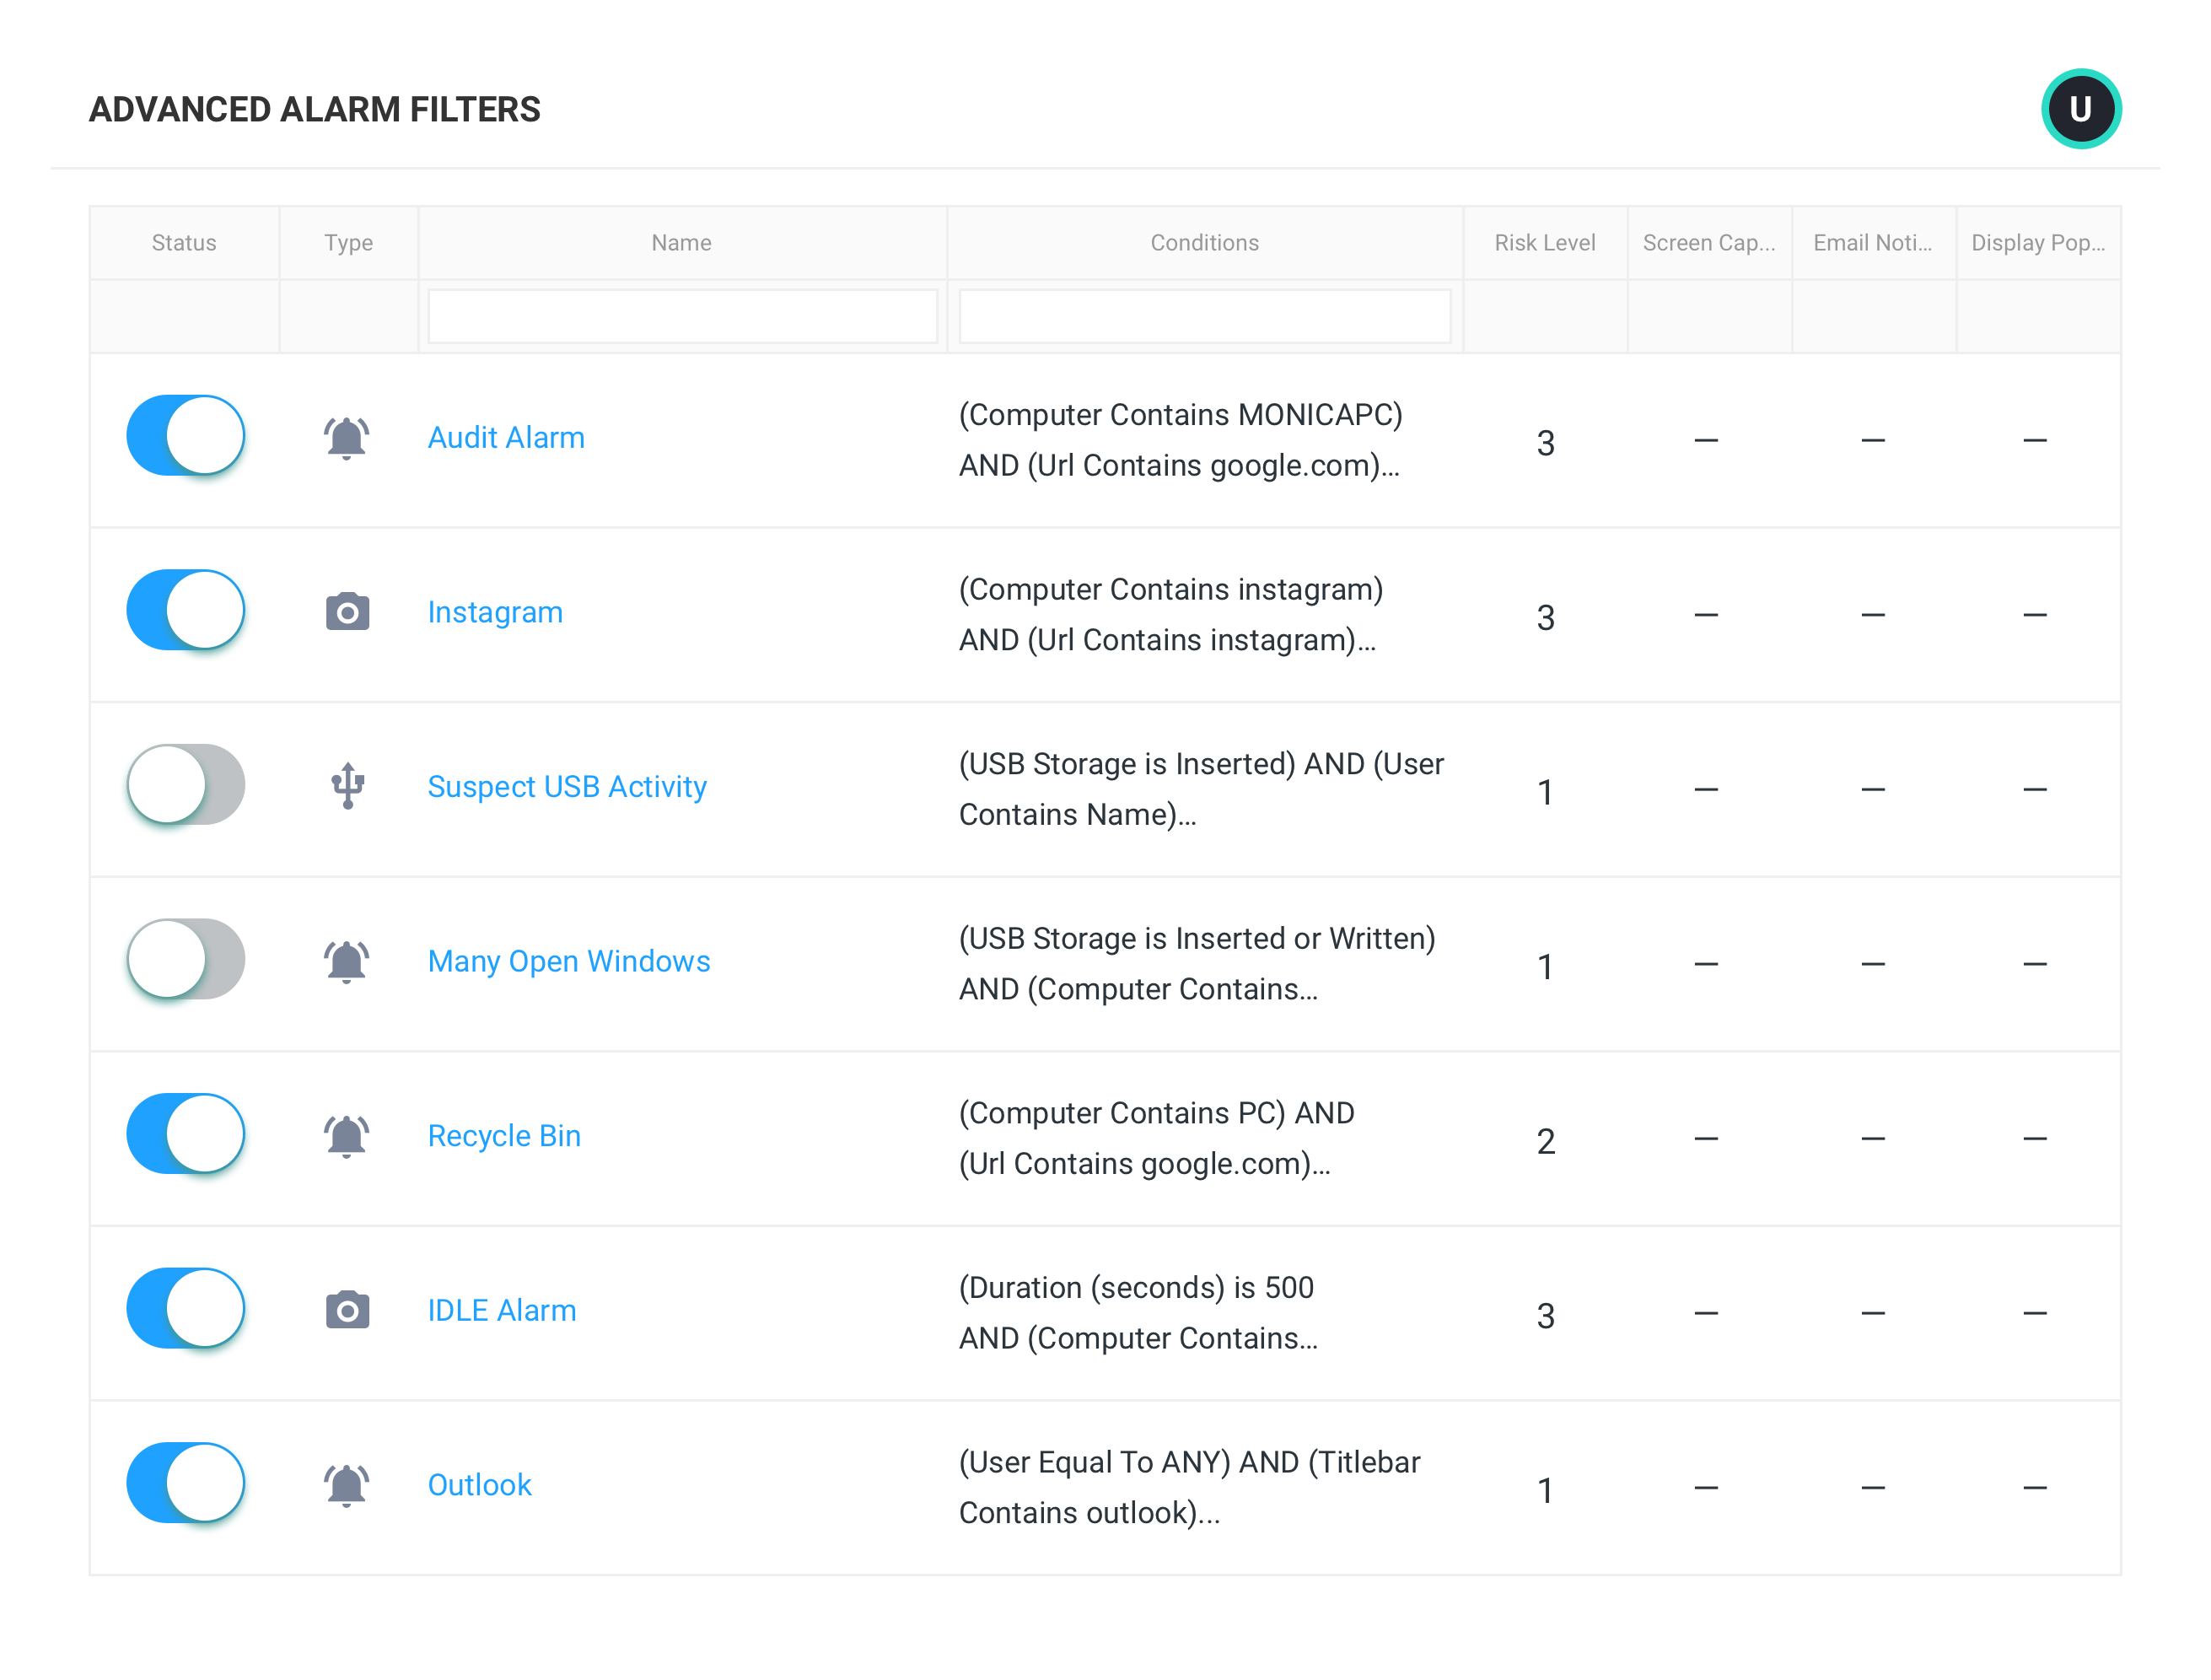
POLICY & COMPLIANCE
Implement compliance safeguards
- Enable pre-built alarms and/or custom create your own to suit your compliance needs
- Analyze user risk scores to head off issues before they become compliance concerns
- Consult detailed activity logs to illuminate potential risks, set effective policies, and/or facilitate forensic analysis
Explore user activity alarms
What you can do with ActivTrak
ActivTrak gives you the work intelligence to understand how work happens across people, tools and AI. Measure productivity, improve efficiency, and see how AI is changing workflows—so you can improve performance across your organization.
Executive Insights
Transform workforce data into boardroom-ready insights. See cross-team performance, identify hidden cost savings and make confident decisions that drive measurable business outcomes.
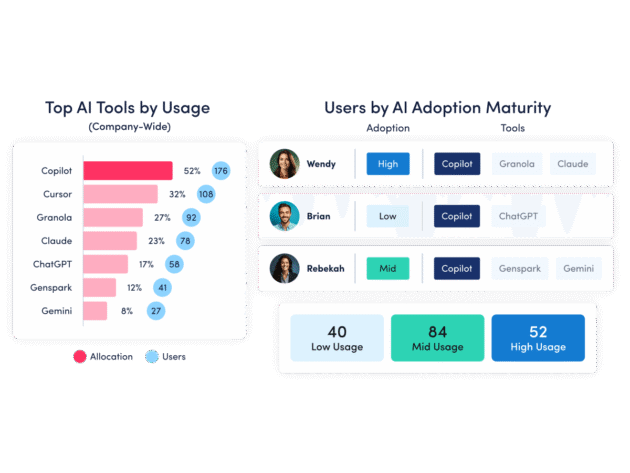
AI Insights
Understand how tools — and AI — are shaping work. See how applications and AI tools are used. Identify what’s driving value, where licenses are underused and how workflows are evolving.
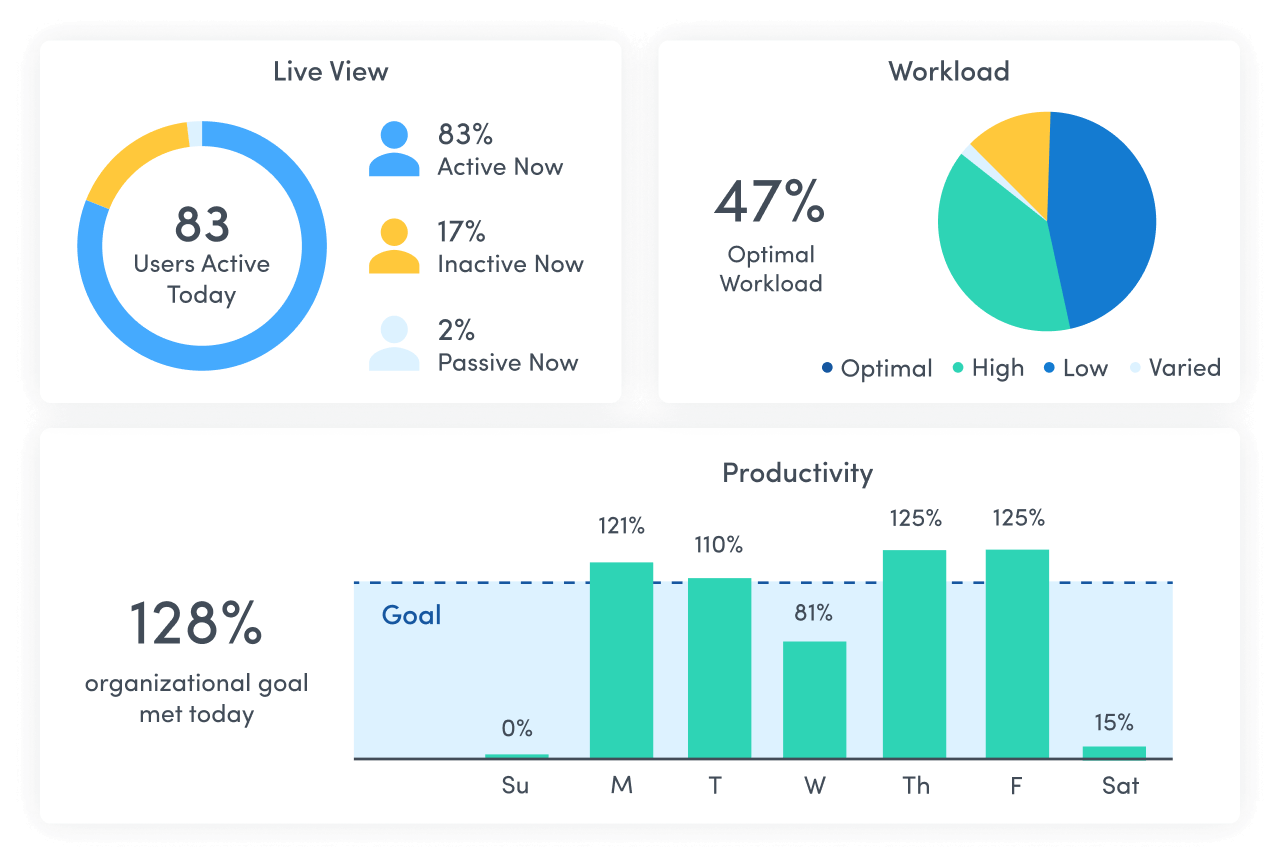
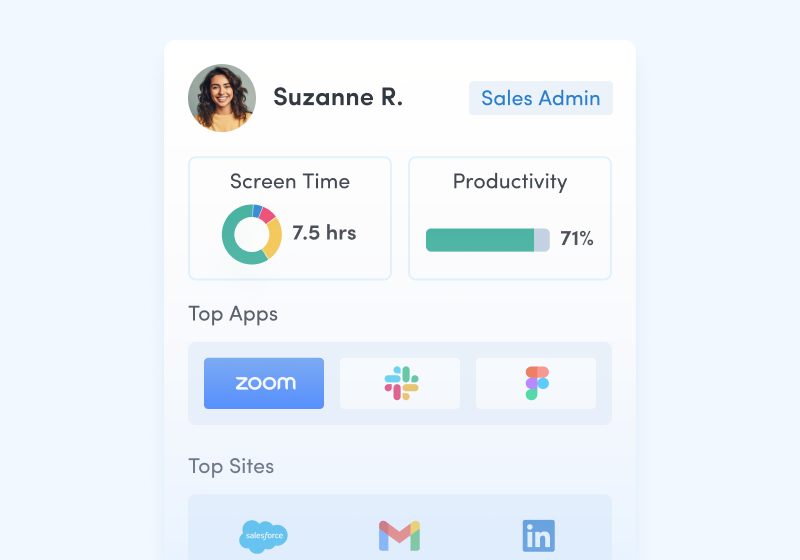
Workforce Management
Understand how work happens across your organization. Analyze work patterns across teams, roles and tools to see where time goes, where friction exists and where performance can improve.
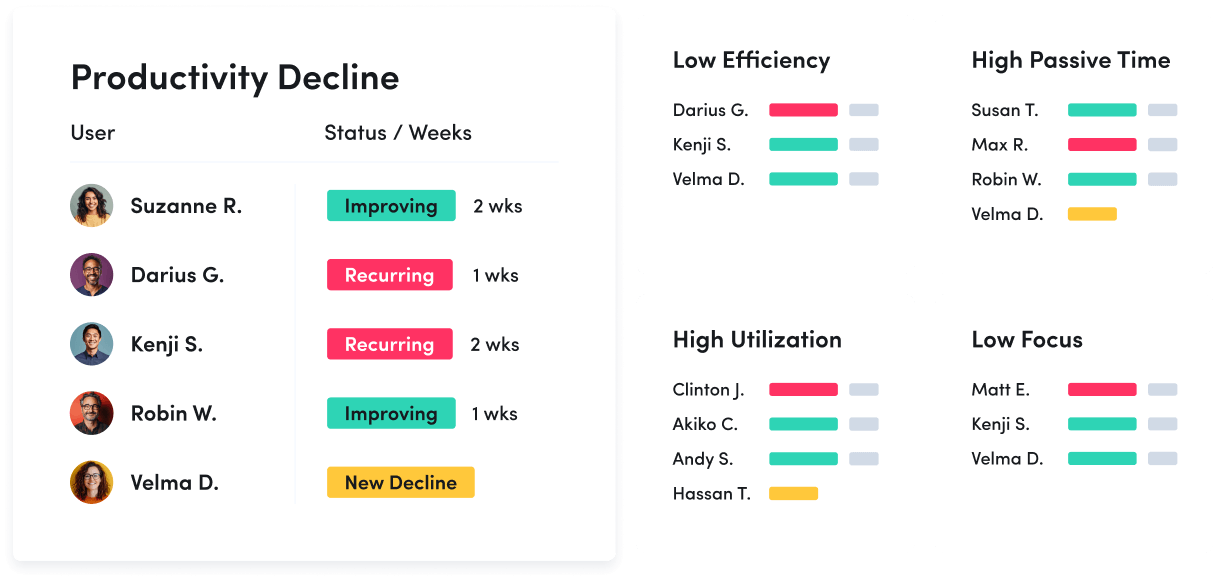
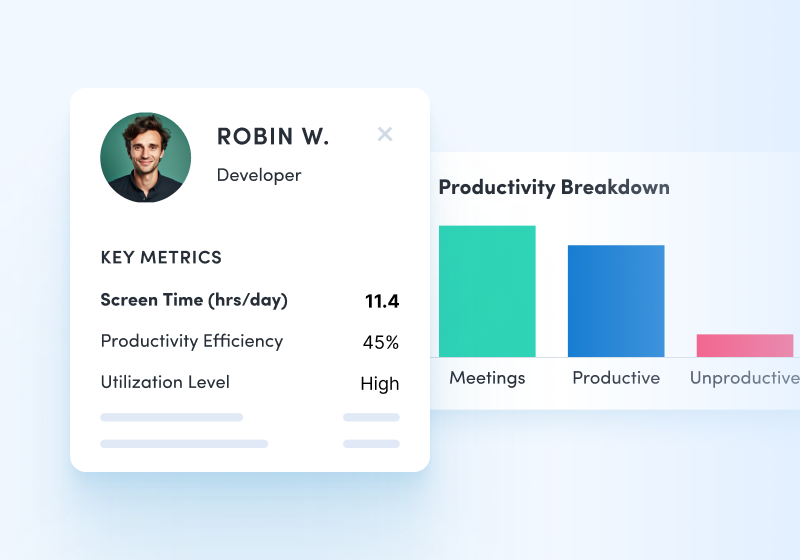
Productivity Optimization
Improve performance with data-driven insight. Quantify productivity, identify capacity and help teams work in more effective, sustainable ways.
Technology Usage & Compliance
Optimize technology investments and ensure compliance. Understand which applications and websites employees use to drive adoption or cut costs, and enforce policies aimed at mitigating risk.
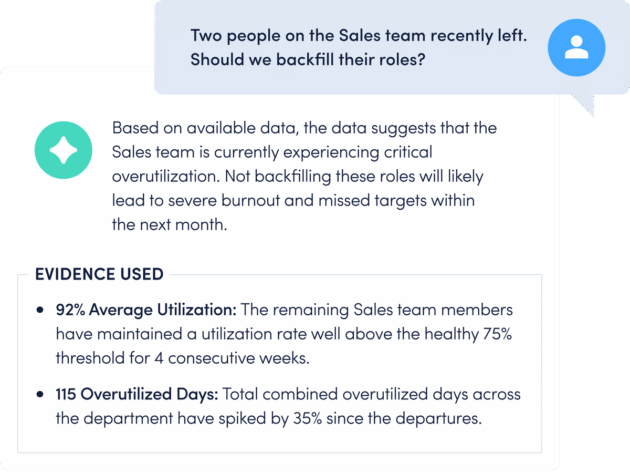
Work Advisor
Let ActivTrak’s conversational AI assistant pull directly from your data for evidenced-backed answers to pressing questions. Skip the manual analysis and get instant insights on work habits, staffing needs, attendance and more.
Connect work intelligence across your tech stack
Integrate existing tools to combine workforce activity, AI usage and business data for deeper, more actionable insights.
Workday
ADP

Microsoft Teams
Outlook

Google Calendar
ServiceNow
Zendesk
ChatGPT
Claude
Gemini
Microsoft Viva
Jira Software
Salesforce
Slack
How It Works
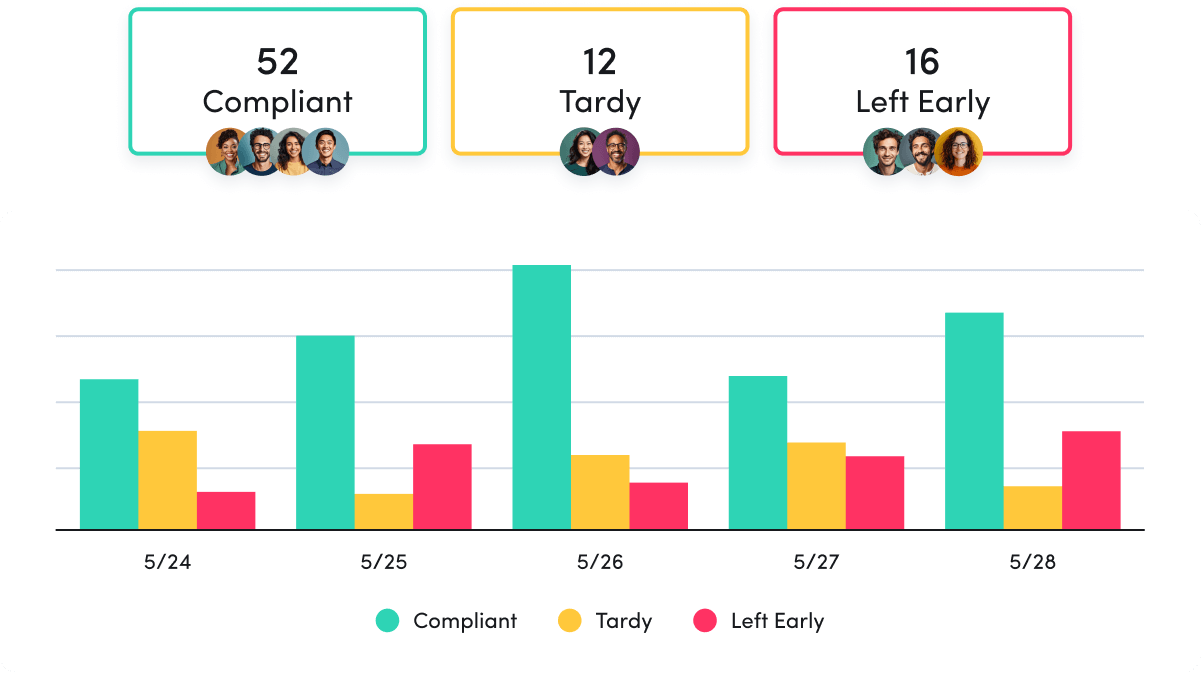
Capture behavioral activity
Capture behavioral activity including hours worked, schedule adherence, location policy compliance and app & website usage.
Analyze productivity trends
Analyze productivity trends on employee focus, engagement and utilization to make data-informed decisions on resource allocation.
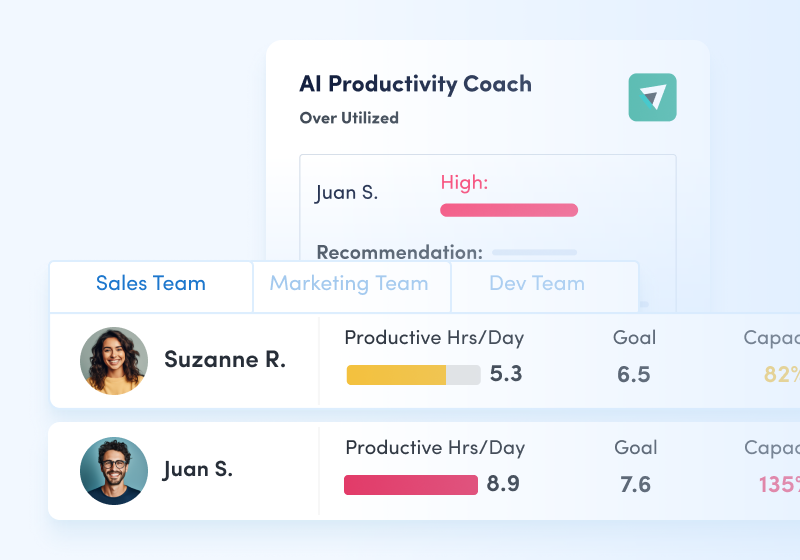
Optimize team performance
Optimize team performance with benchmarks, goal-tracking and AI coaching recommendations to improve workforce productivity.
See what customers say about ActivTrak
Powered by![]()