Trusted by 9,500+ global brands and organizations
Do you know the impact your productivity has on your company or team? Do you want to work smarter instead of harder?
ActivTrak delivers the personal productivity insights you need to…
- Understand how your work impacts your company and team
- Use productivity metrics to validate your performance and drive your career
- Appreciate and celebrate a culture of trust and transparency

“The data and insight provided by the built-in dashboards is everything we wanted and more, and our employees enjoy having access to their data to monitor their own performance and productivity.”
– Director Of Business Development, Services Industry
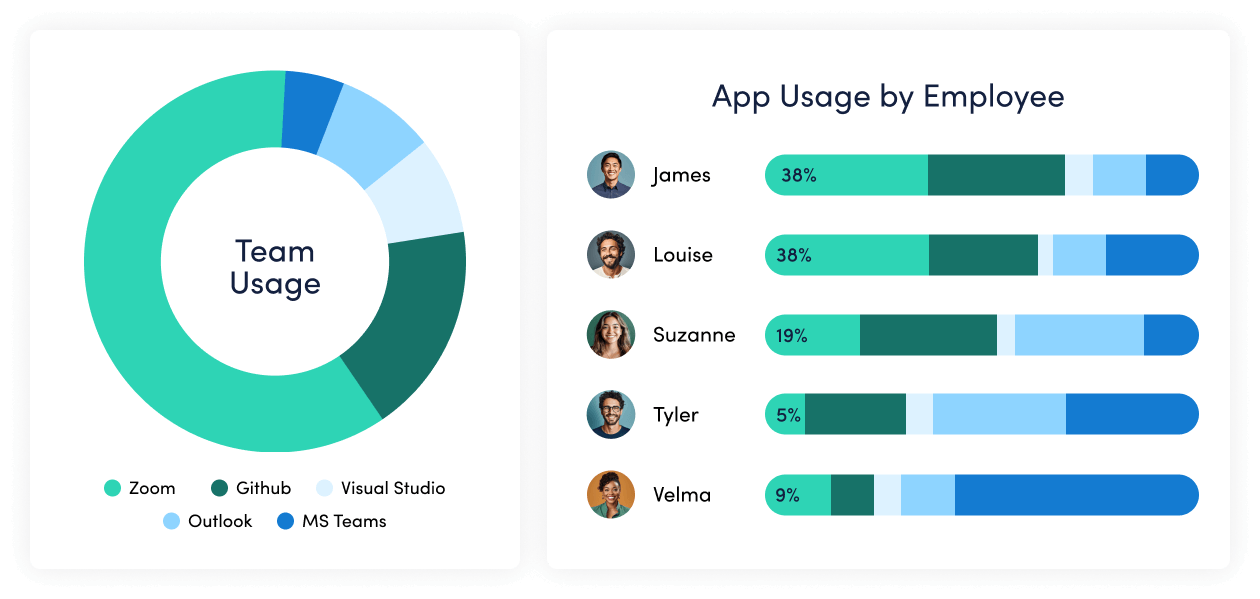
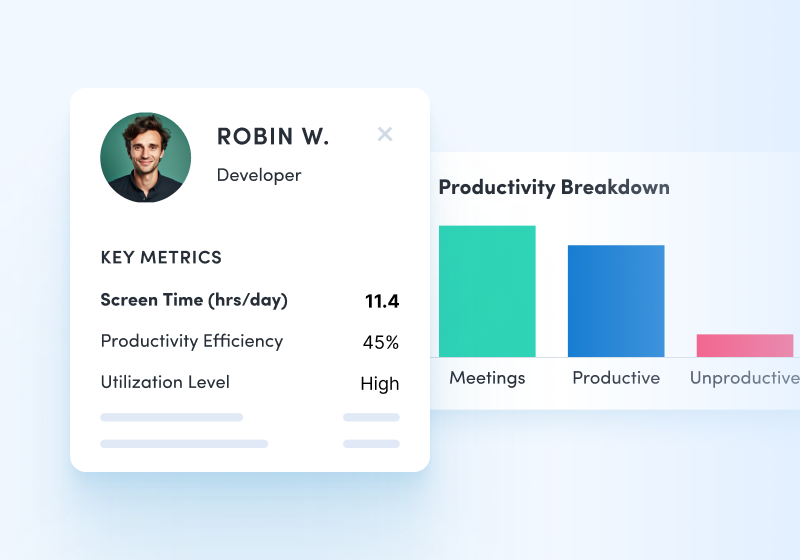
INDIVIDUAL PERFORMANCE
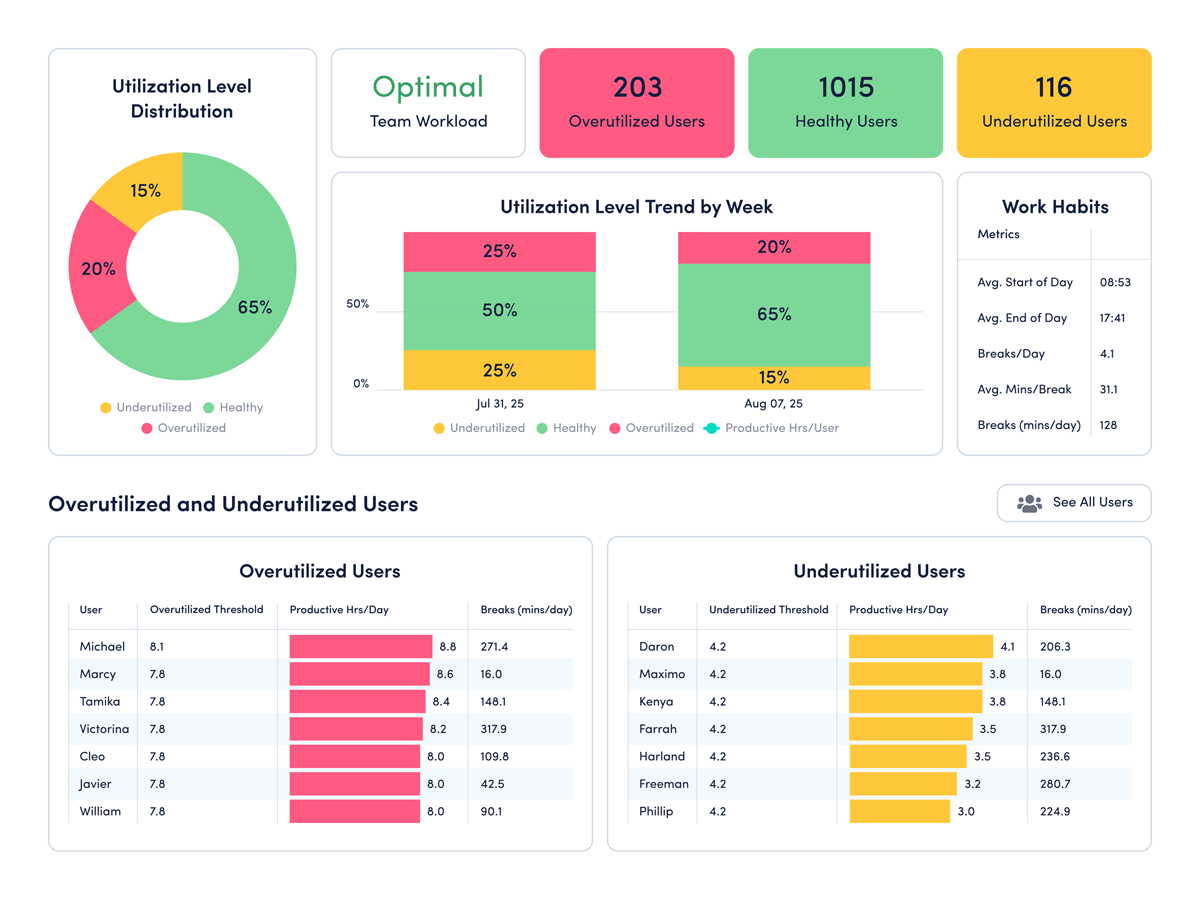
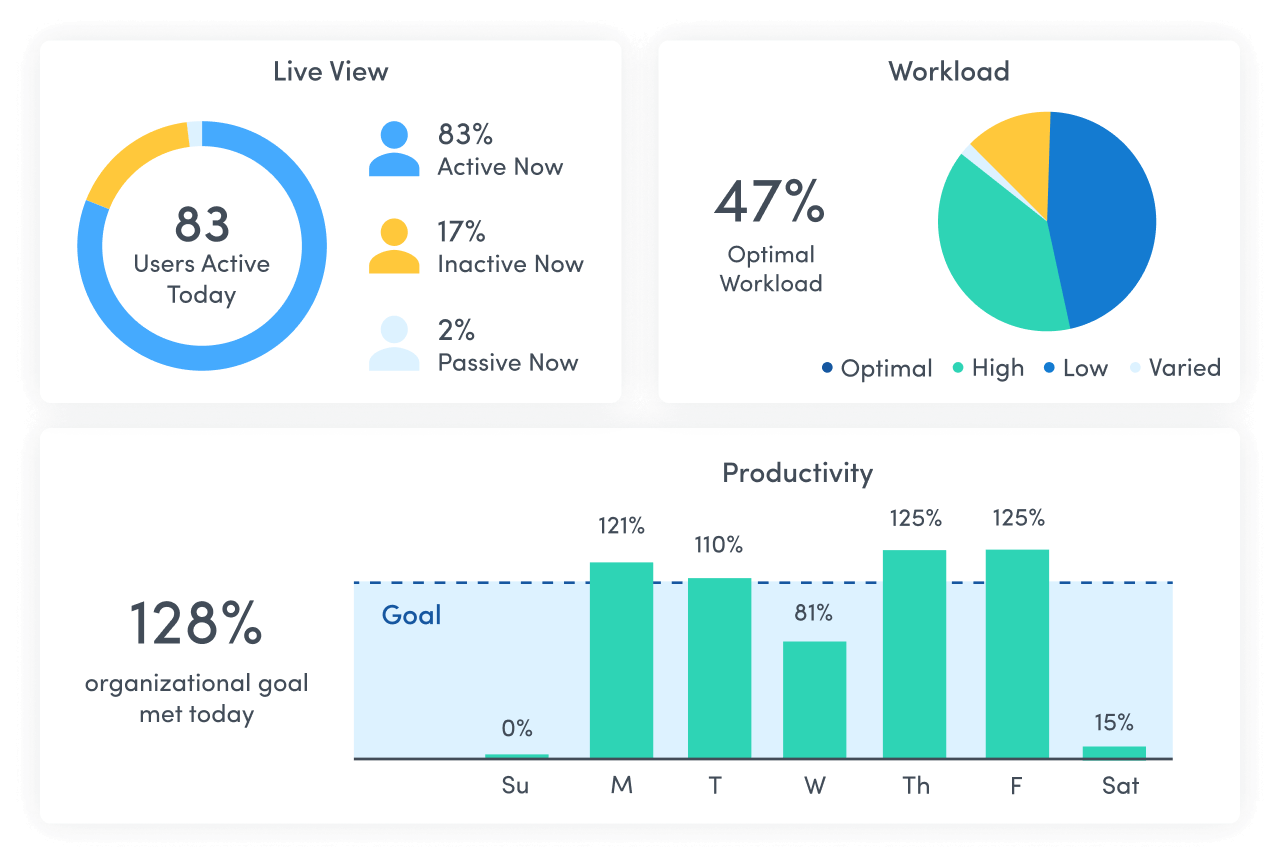
Understand how your work impacts your company and team
- Collaborate with managers on opportunities to rebalance workloads or adjust working hours for optimal productivity
- Understand how your habits improve or hinder productivity and iterate
- Avoid creeping into burnout by self-monitoring burnout risk scores
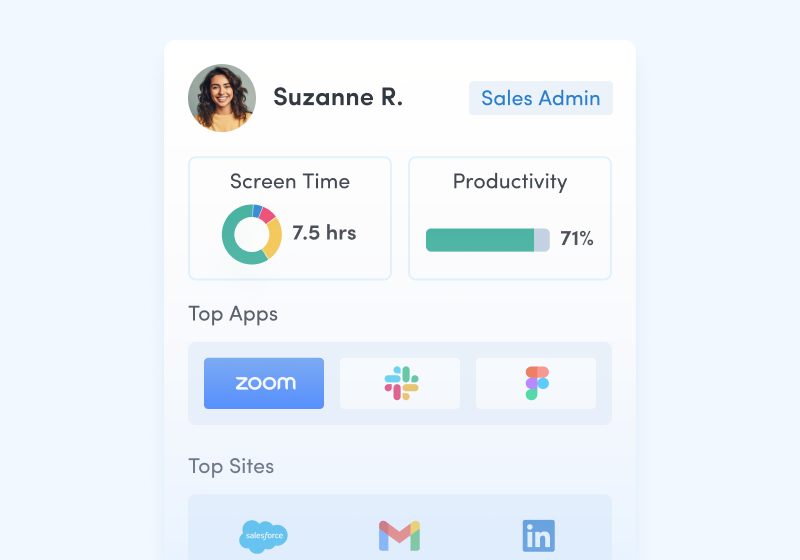
INDIVIDUAL VALIDATION
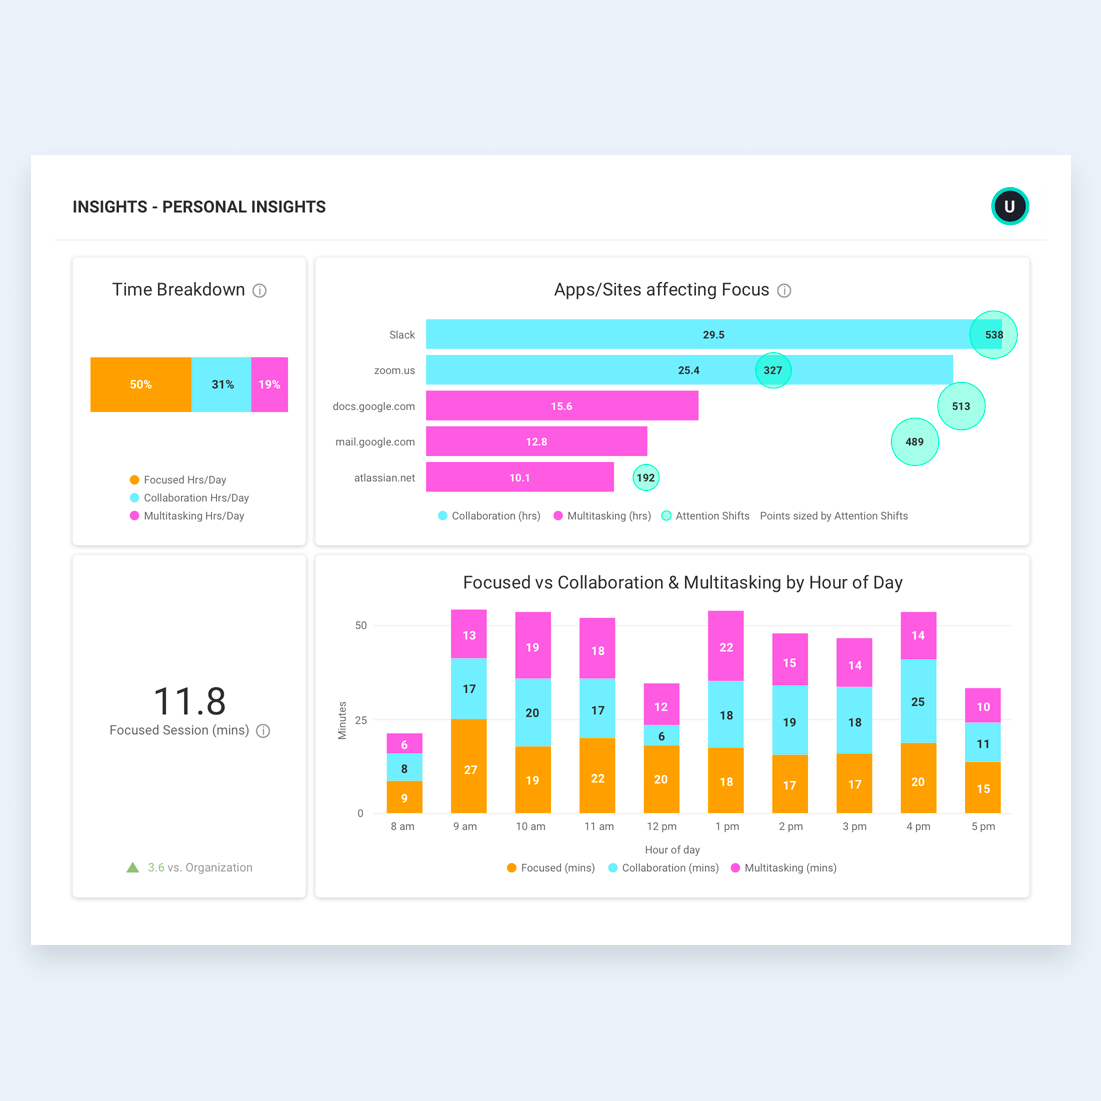
Use productivity metrics to validate your performance and drive your career
- Take your personal productivity metrics into evaluation meetings to highlight improvements
- Strengthen career advancement opportunities with proof of development and progress
- Get recognition from peers on performance achievements
COMPANY CULTURE
Appreciate and celebrate a culture of trust and transparency
- ActivTrak is built with the guiding principles of respect for privacy, transparency, collaboration, and informed insight.
- Our platform helps managers collaborate with employees to make individual work better while improving productivity organization-wide.
Employees leveraging workforce analytics can carry these principles through to influence company culture while improving how work gets done.
Explore team productivity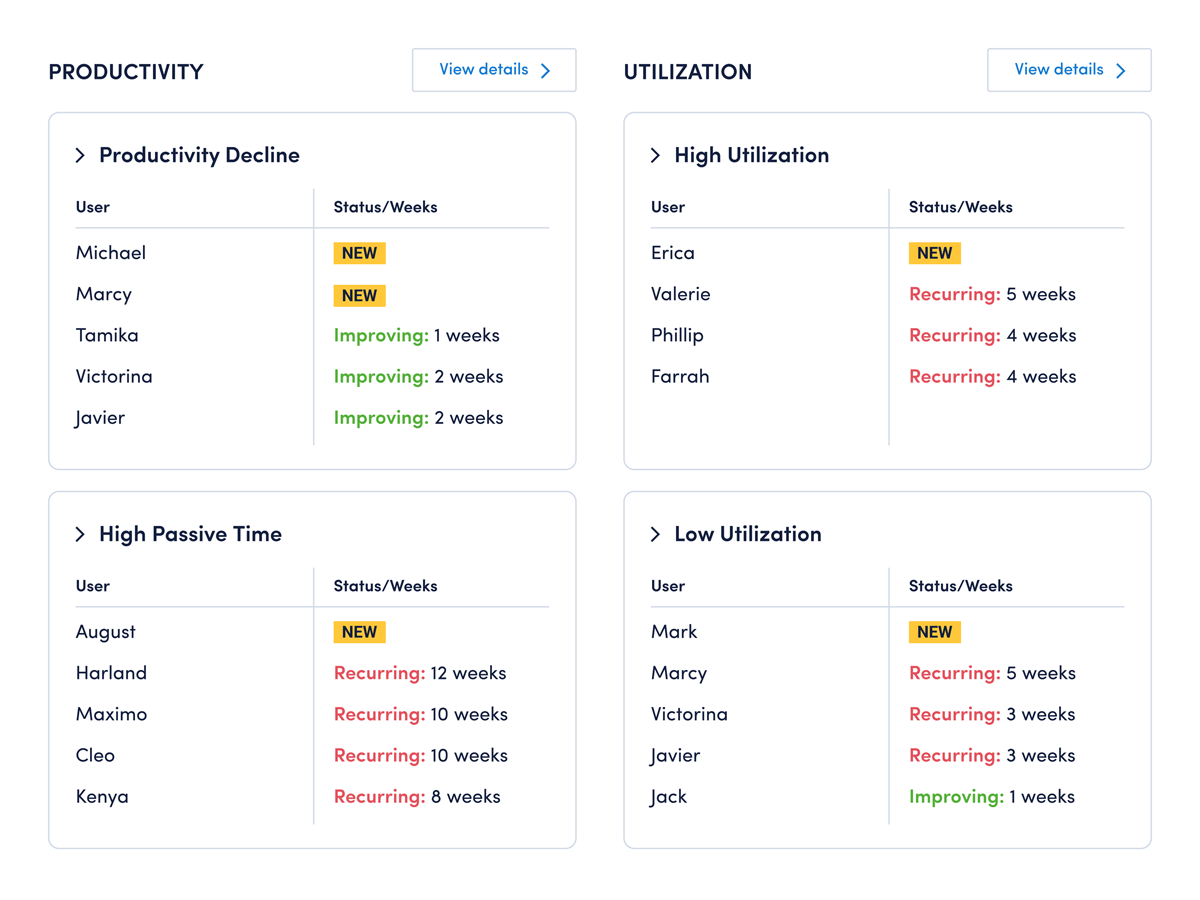
What you can do with ActivTrak
ActivTrak gives you the work intelligence to understand how work happens across people, tools and AI. Measure productivity, improve efficiency, and see how AI is changing workflows—so you can improve performance across your organization.
Executive Insights
Transform workforce data into boardroom-ready insights. See cross-team performance, identify hidden cost savings and make confident decisions that drive measurable business outcomes.
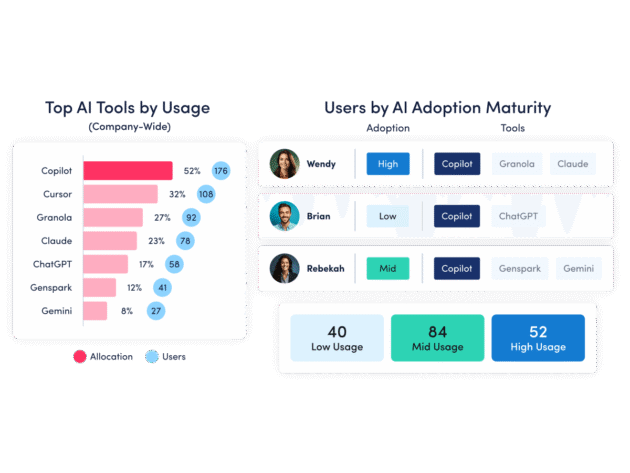
AI Insights
Understand how tools — and AI — are shaping work. See how applications and AI tools are used. Identify what’s driving value, where licenses are underused and how workflows are evolving.
Workforce Management
Understand how work happens across your organization. Analyze work patterns across teams, roles and tools to see where time goes, where friction exists and where performance can improve.
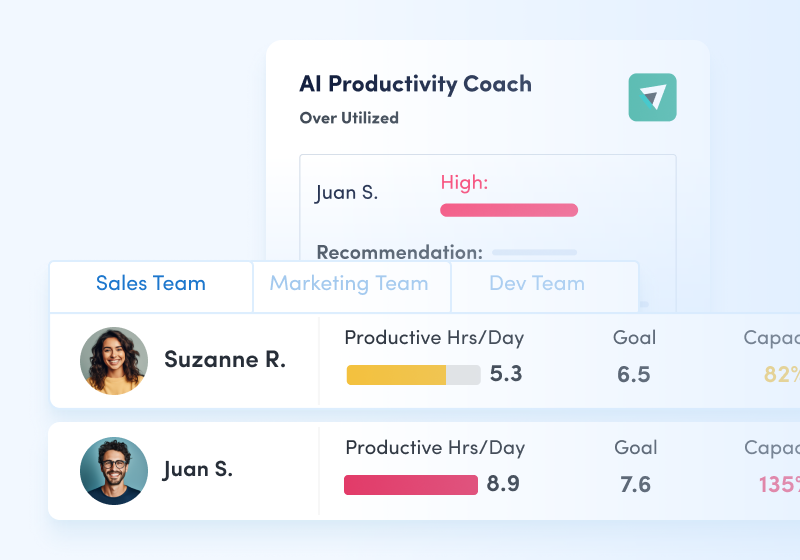
Productivity Optimization
Improve performance with data-driven insight. Quantify productivity, identify capacity and help teams work in more effective, sustainable ways.
Technology Usage & Compliance
Optimize technology investments and ensure compliance. Understand which applications and websites employees use to drive adoption or cut costs, and enforce policies aimed at mitigating risk.
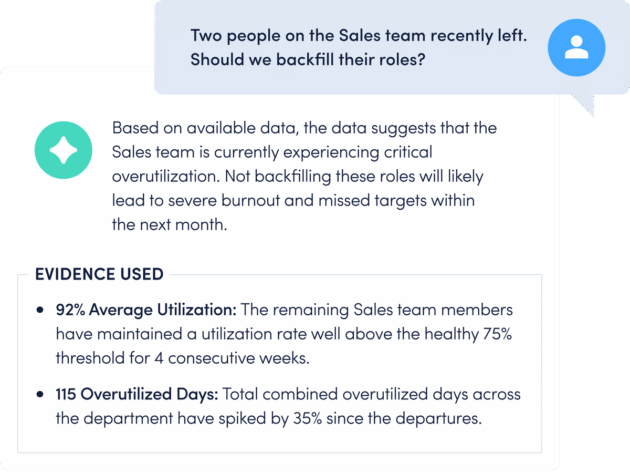
Work Advisor
Let ActivTrak’s conversational AI assistant pull directly from your data for evidenced-backed answers to pressing questions. Skip the manual analysis and get instant insights on work habits, staffing needs, attendance and more.
Connect work intelligence across your tech stack
Integrate existing tools to combine workforce activity, AI usage and business data for deeper, more actionable insights.
Workday
ADP

Microsoft Teams
Outlook
Google Calendar
ServiceNow
Zendesk
ChatGPT
Claude
Gemini
Microsoft Viva
Jira Software
Salesforce
Slack
How It Works
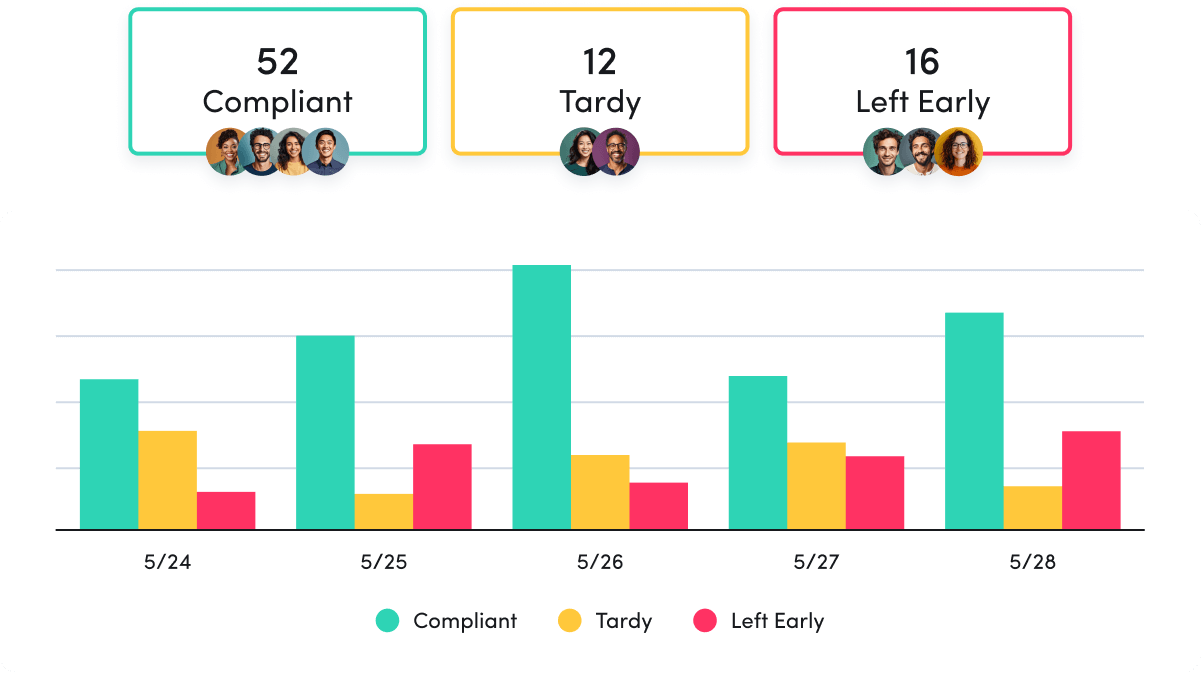
Capture behavioral activity
Capture behavioral activity including hours worked, schedule adherence, location policy compliance and app & website usage.
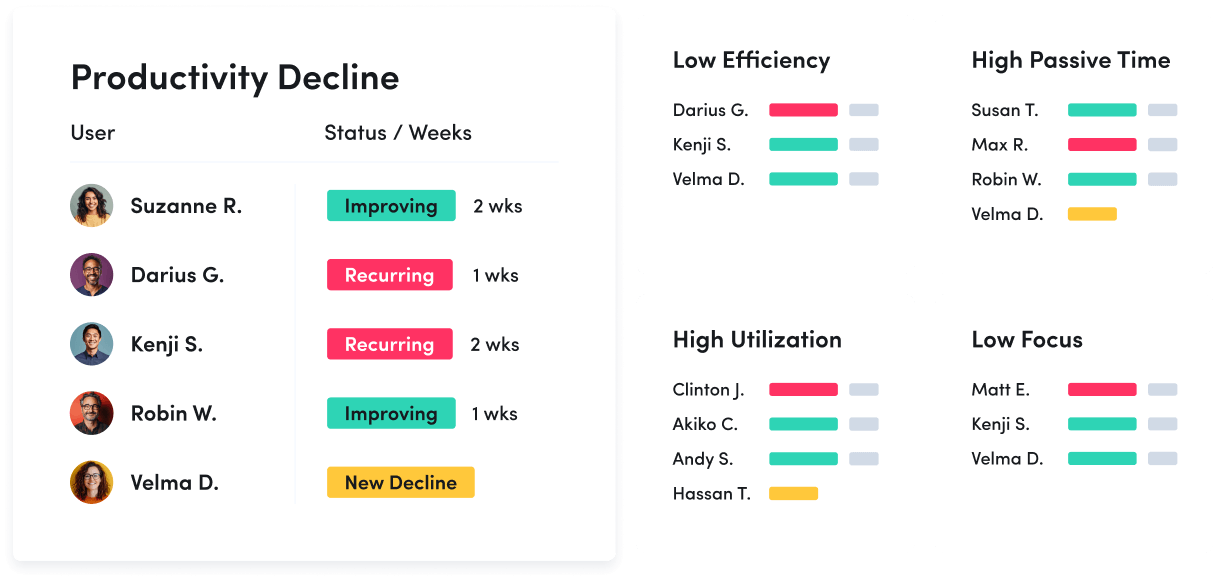
Analyze productivity trends
Analyze productivity trends on employee focus, engagement and utilization to make data-informed decisions on resource allocation.
Optimize team performance
Optimize team performance with benchmarks, goal-tracking and AI coaching recommendations to improve workforce productivity.
See what customers say about ActivTrak
Powered by![]()