AI insights. To see how AI changes work.
Trusted by 9,500+ global brands and organizations
MEASURE AI ADOPTION & IMPACT
Get full visibility into how AI changes work
Most organizations track AI usage, but few can tell if AI tools actually improve performance. ActivTrak links AI activity to real results for clear metrics on everything from adoption to compliance.
- Get a clear view of how AI is used
- Gain control over AI usage
- Classify AI users into maturity stages
- Measure real productivity gains from AI
- Quantify the business impact of AI
- Connect AI usage to ROI

“What I like most about ActivTrak is how it gives me clear visibility into how the team is spending their time without being intrusive. It helps me spot productivity patterns and potential bottlenecks quickly, so I can address issues before they impact the operation.”
— Ops Manager
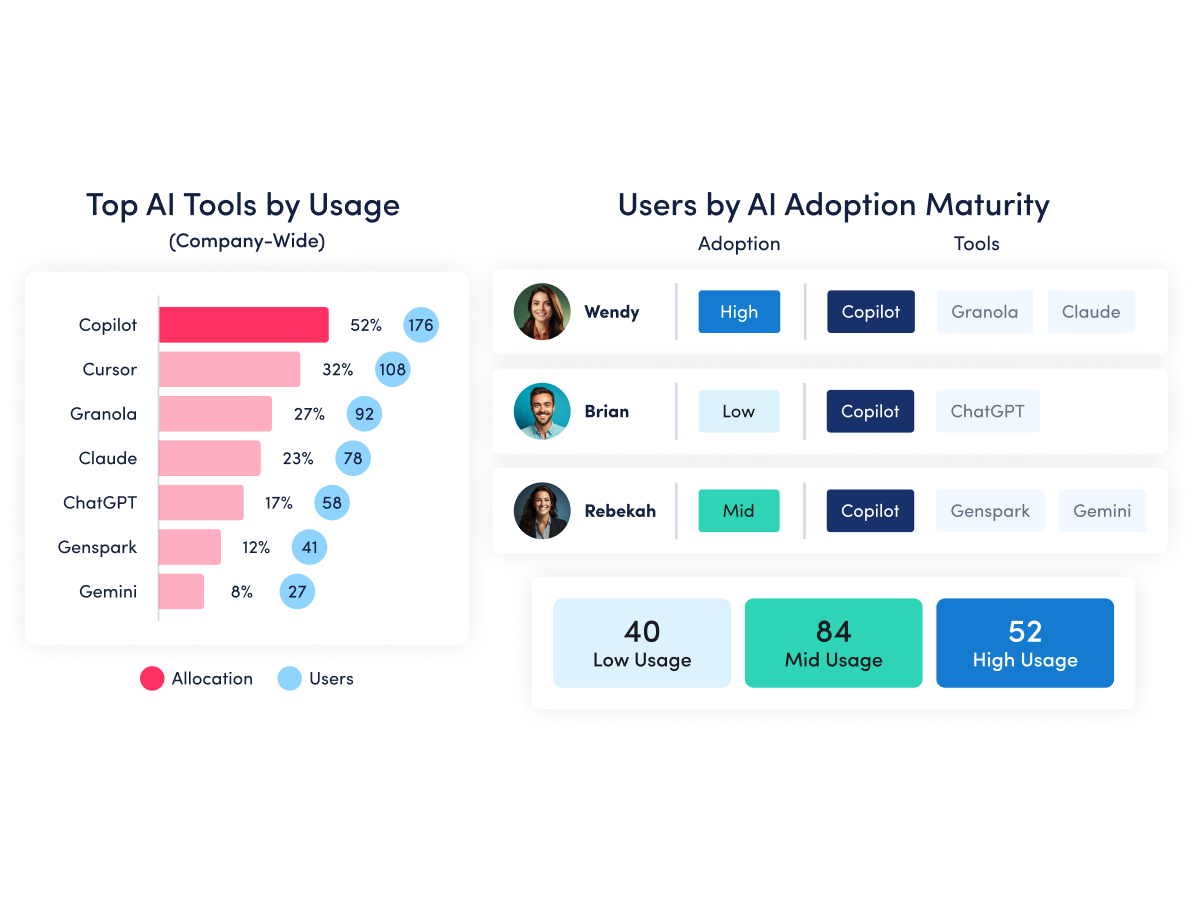
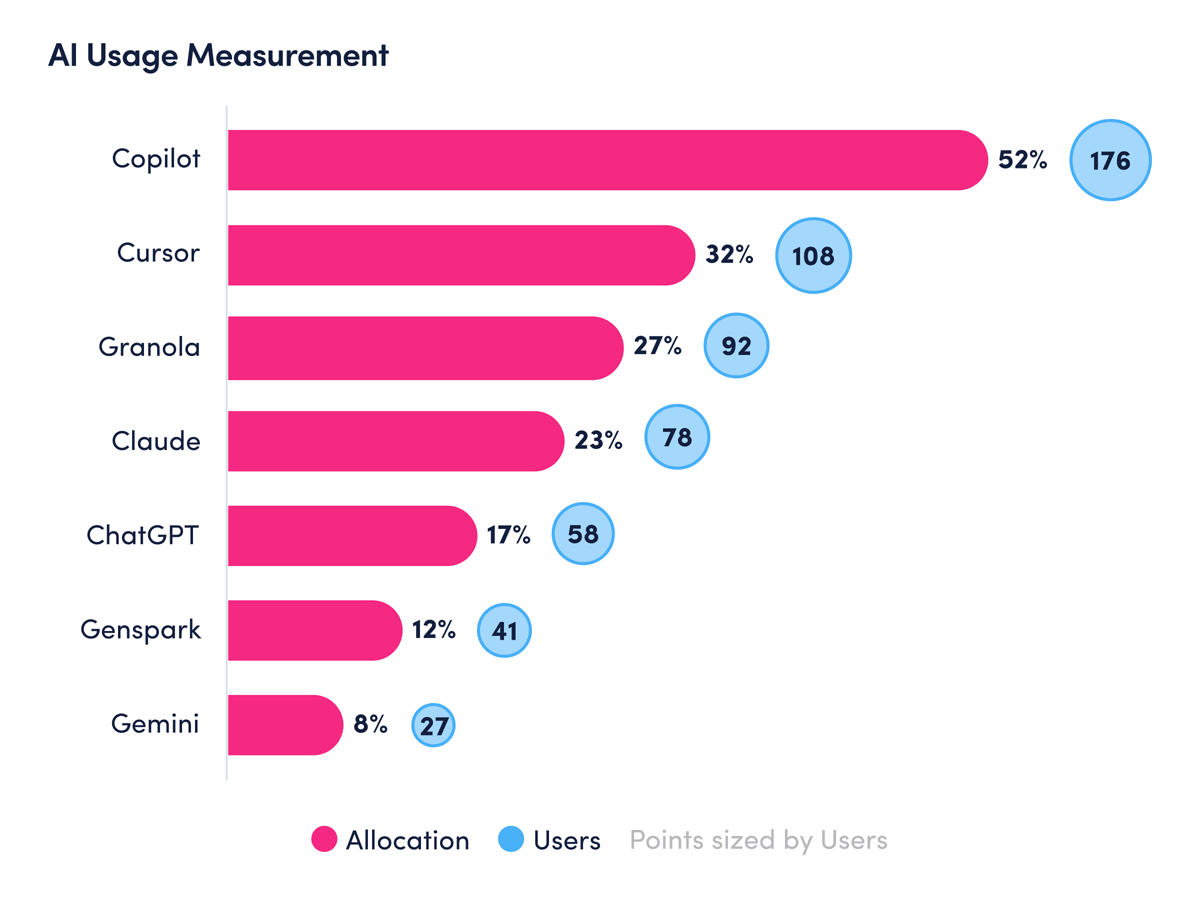
AI ADOPTION & USAGE
Get a clear view of how AI is used
- Measure how widely AI tools are used across the organization
- Distinguish between daily, regular, sporadic and no usage
- Compare adoption and usage across teams, departments or roles
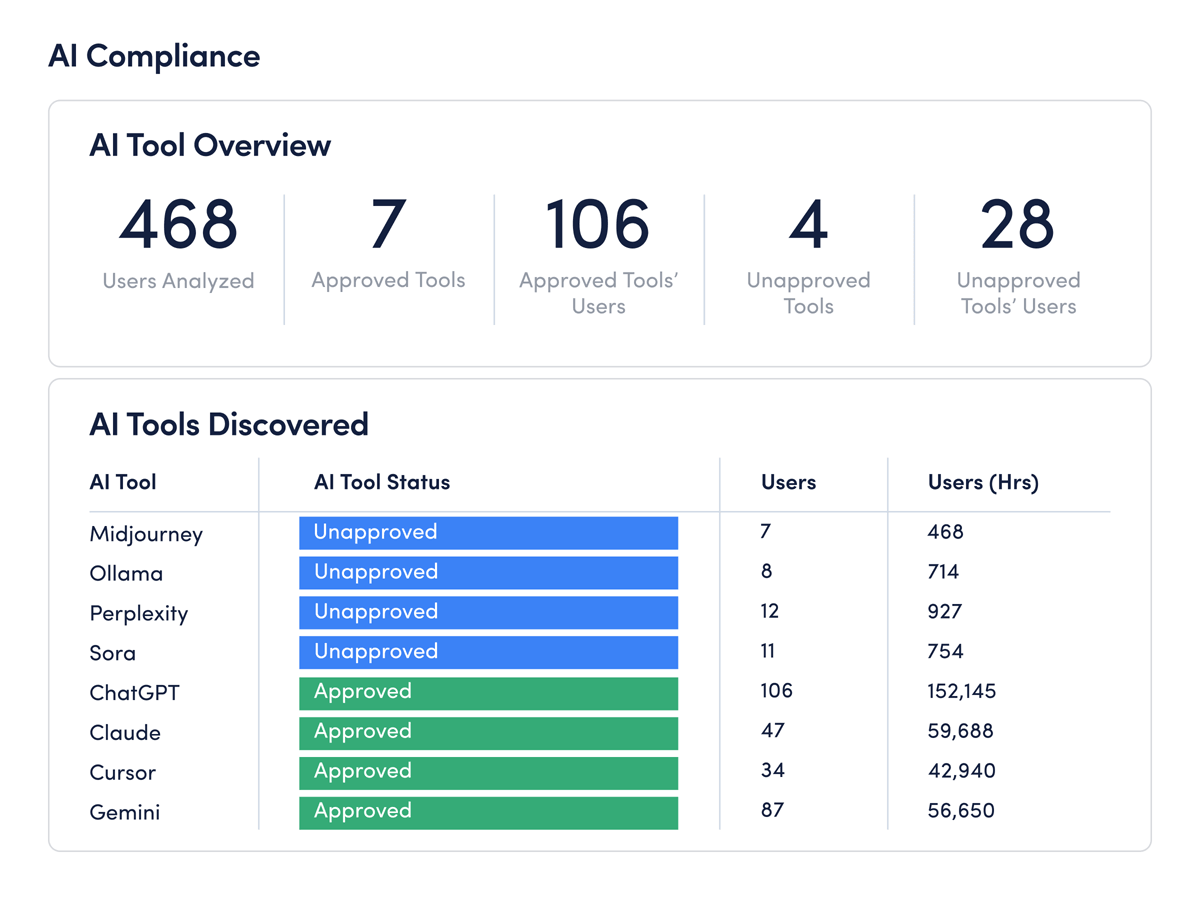
AI USAGE MONITORING
Gain control over AI usage
- Discover all AI tools in use, whether approved or not
- Use adoption insights to define AI usage policies and controls
- Use real-time data to track and enforce compliance
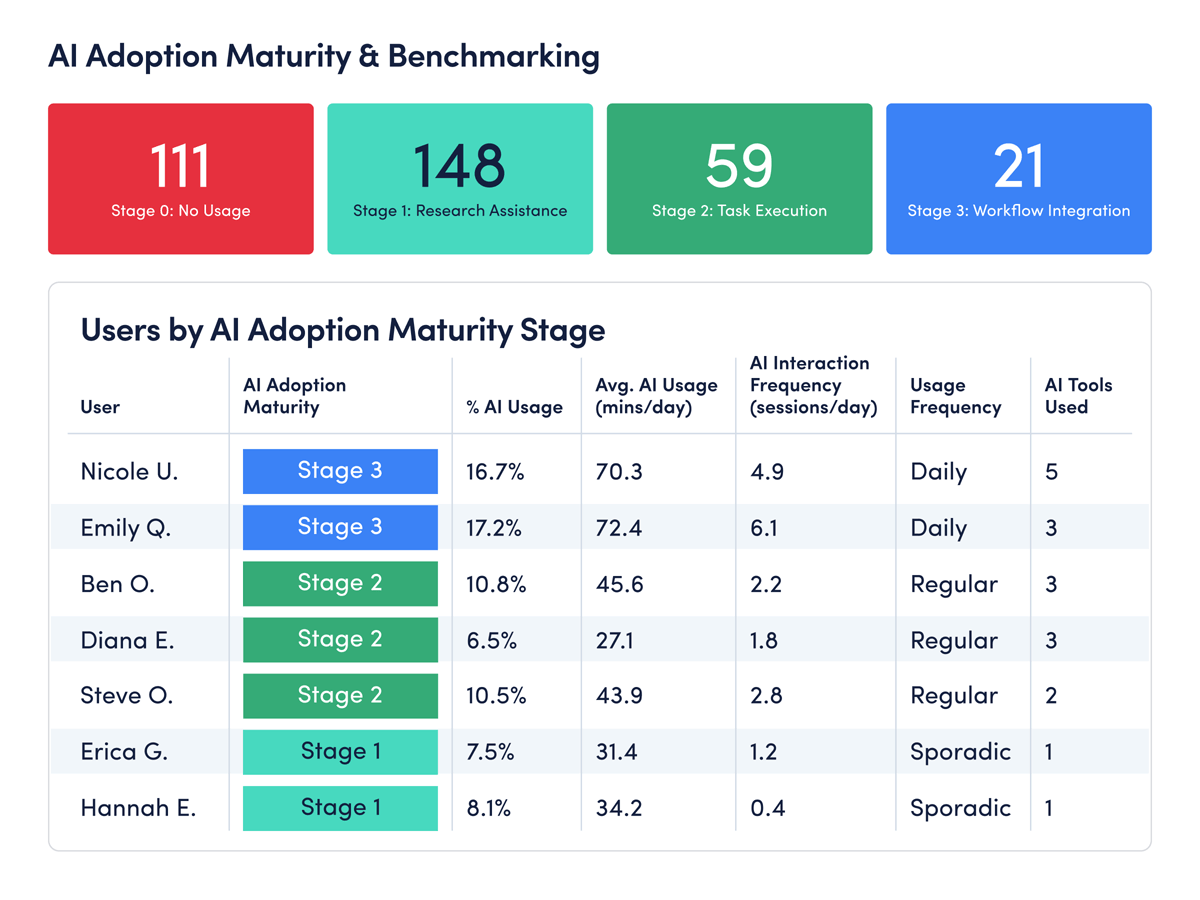
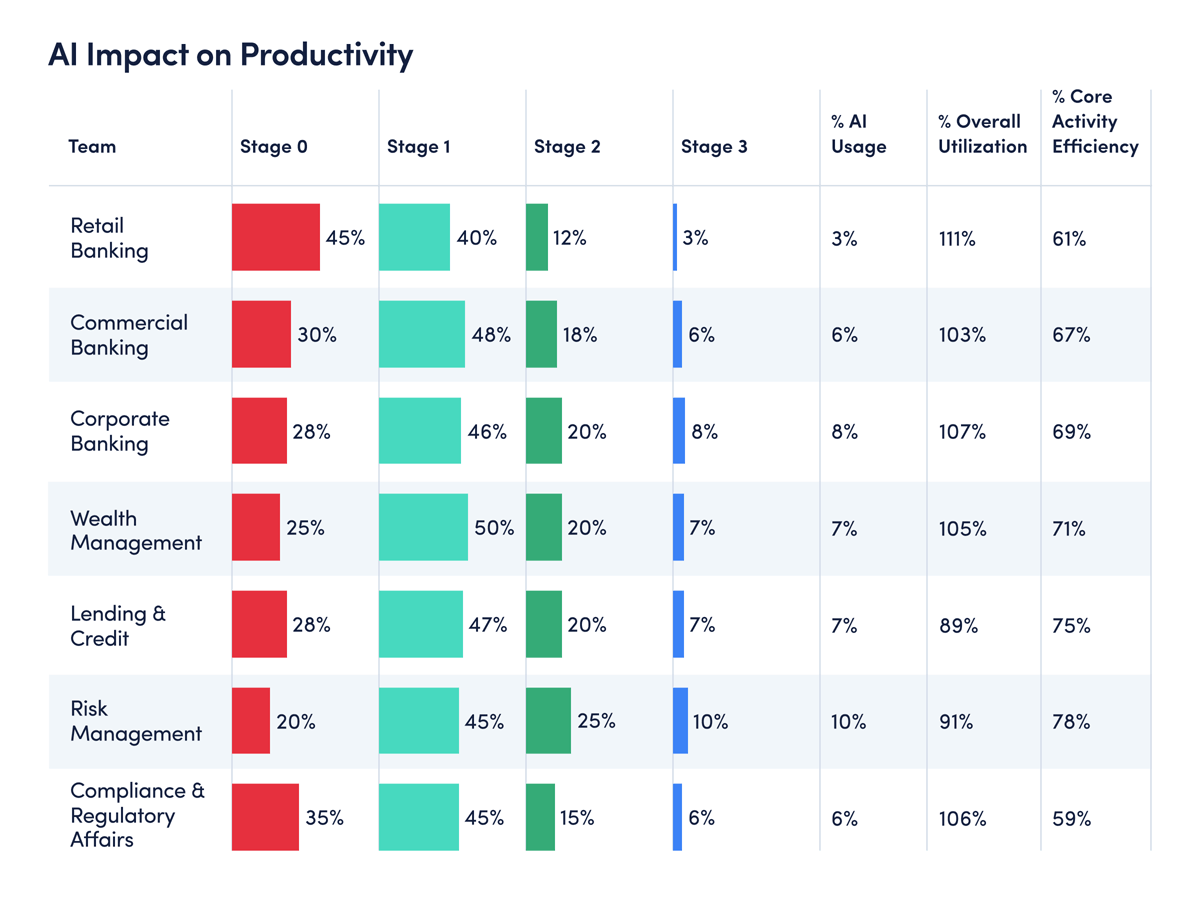
AI ADOPTION MATURITY
Classify AI users into maturity stages
- Understand how deeply AI is embedded into work
- Track progression from no use to daily use
- Compare maturity levels across teams and roles
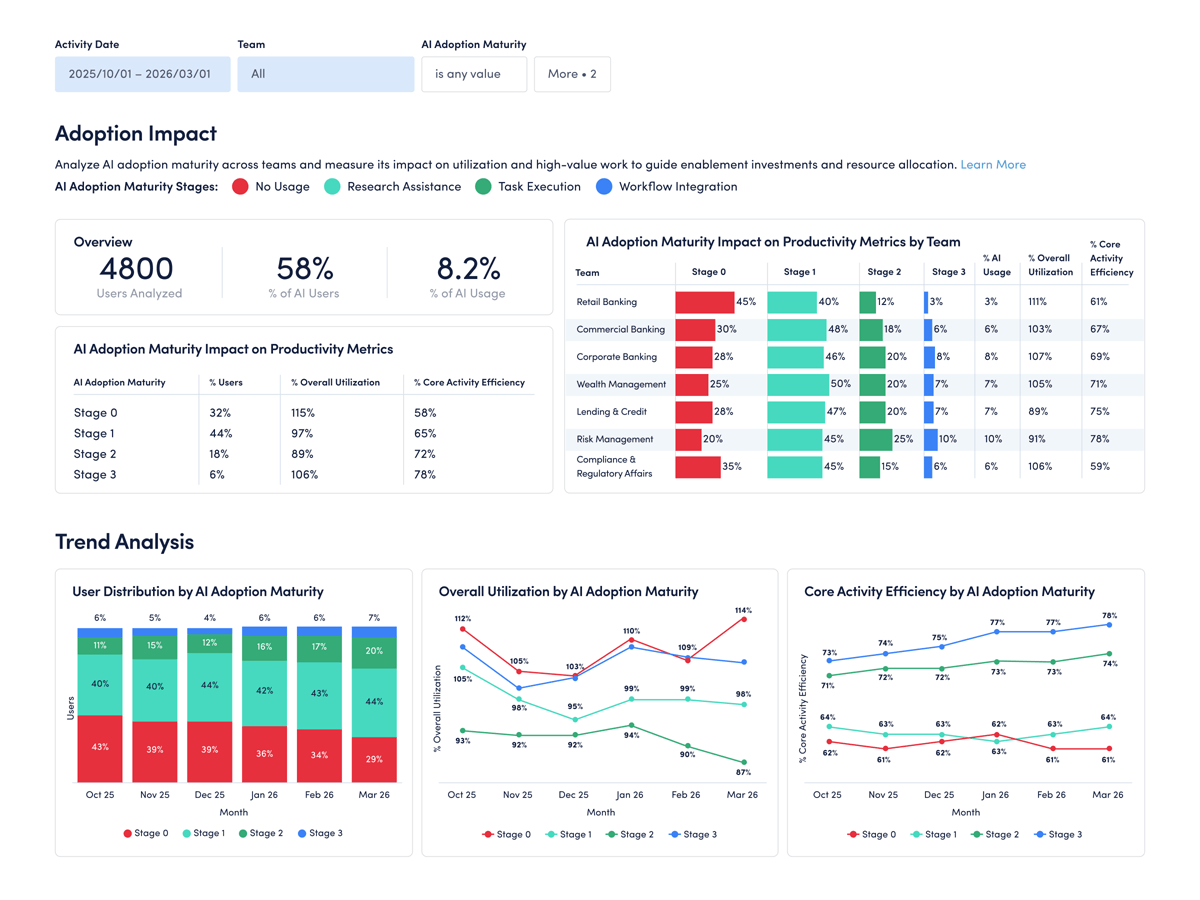
AI PRODUCTIVITY MEASUREMENT
Measure real productivity gains from AI
- Track how teams redistribute time to higher-value work
- Measure the impact of AI on concentrated focus time
- See if AI-assisted work actually frees capacity
AI TRANSFORMATION
Quantify the business impact of AI
- See how much time AI actually saves
- Get a list of top tools and use cases
- Identify future cost saving opportunities
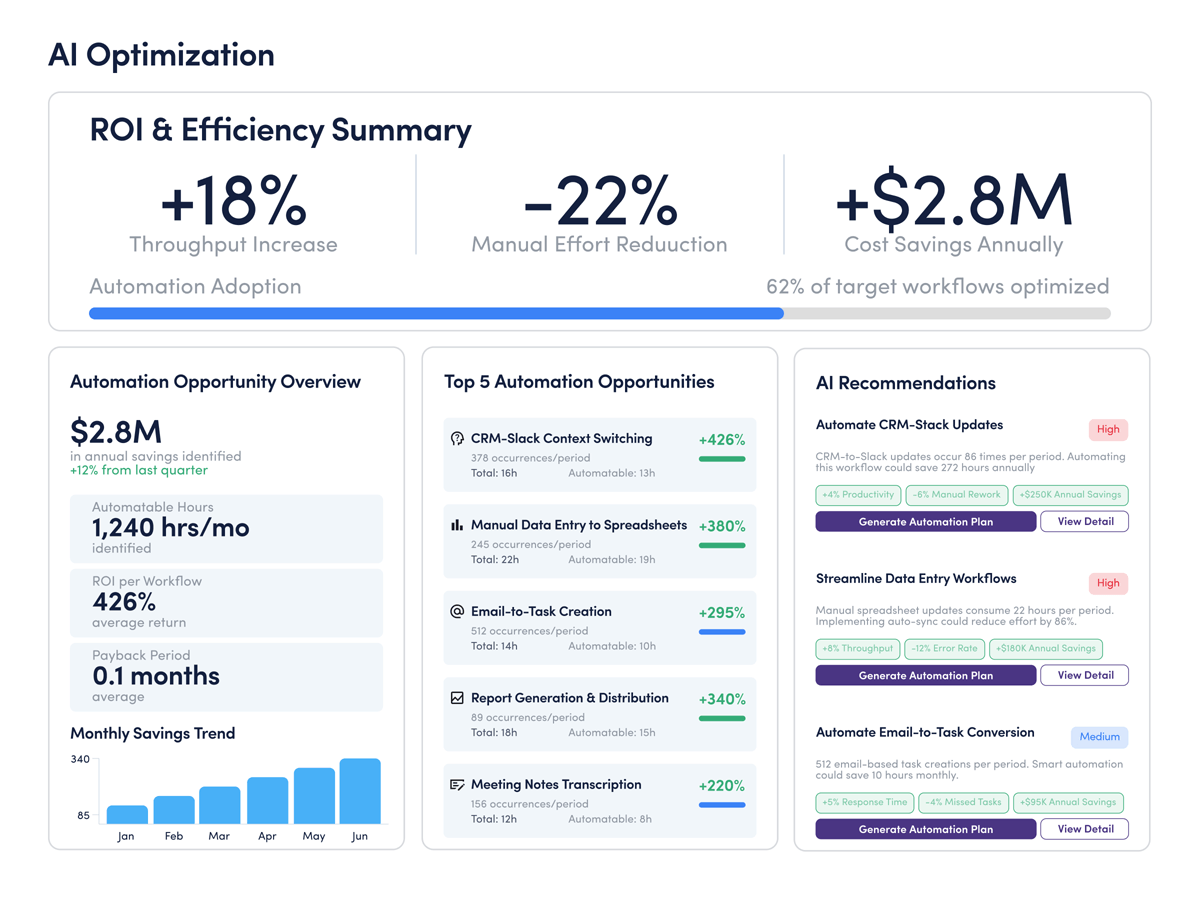
AI ROI TRACKING
Connect AI usage to ROI
- Quantify capacity gains created by AI-enabled work
- Compare outcomes across teams, roles and maturity levels
- See where AI is driving real value, and where to improve
What are ActivTrak’s key features?
ActivTrak is the most comprehensive workforce analytics solution, with robust features to address your employee monitoring, productivity management and workforce planning needs. Make data-driven decisions to quickly optimize performance and boost productivity.
Workforce Management
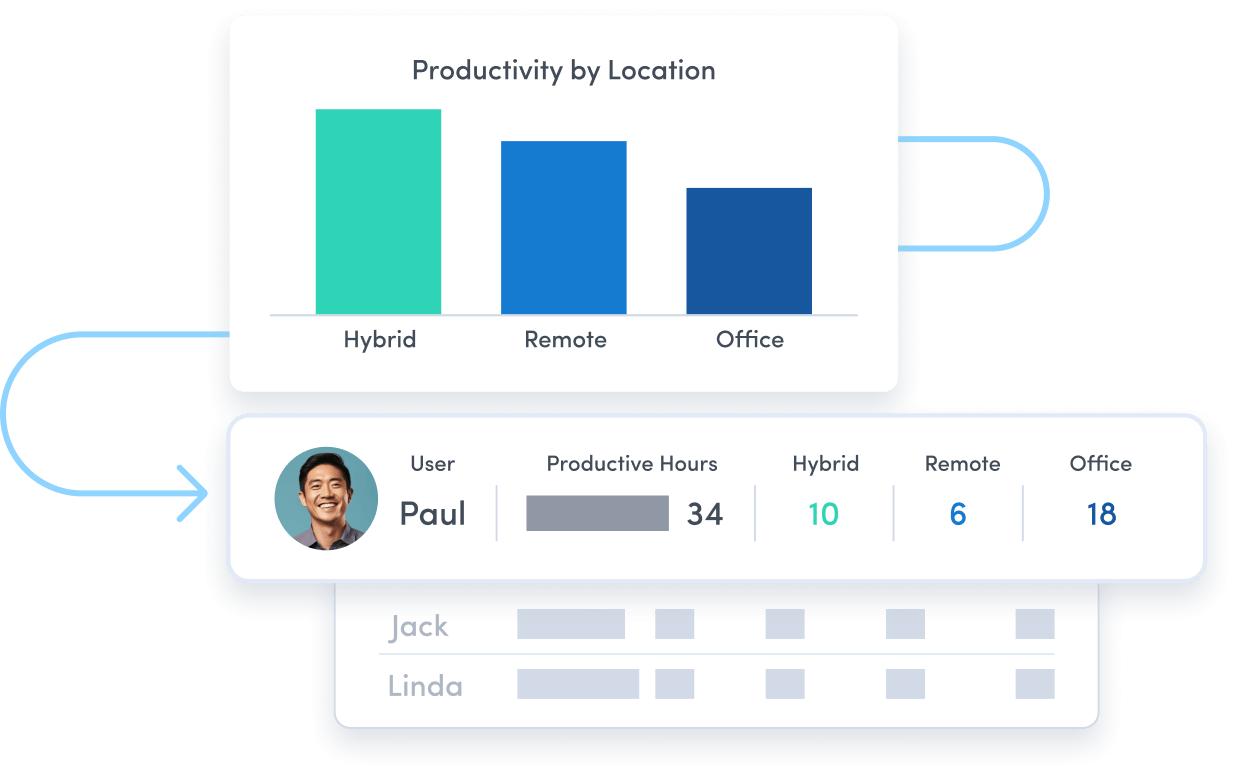
Remote Workforce Management
Remote Workforce Management
Track employee productivity by work location to guide workplace policy decisions.
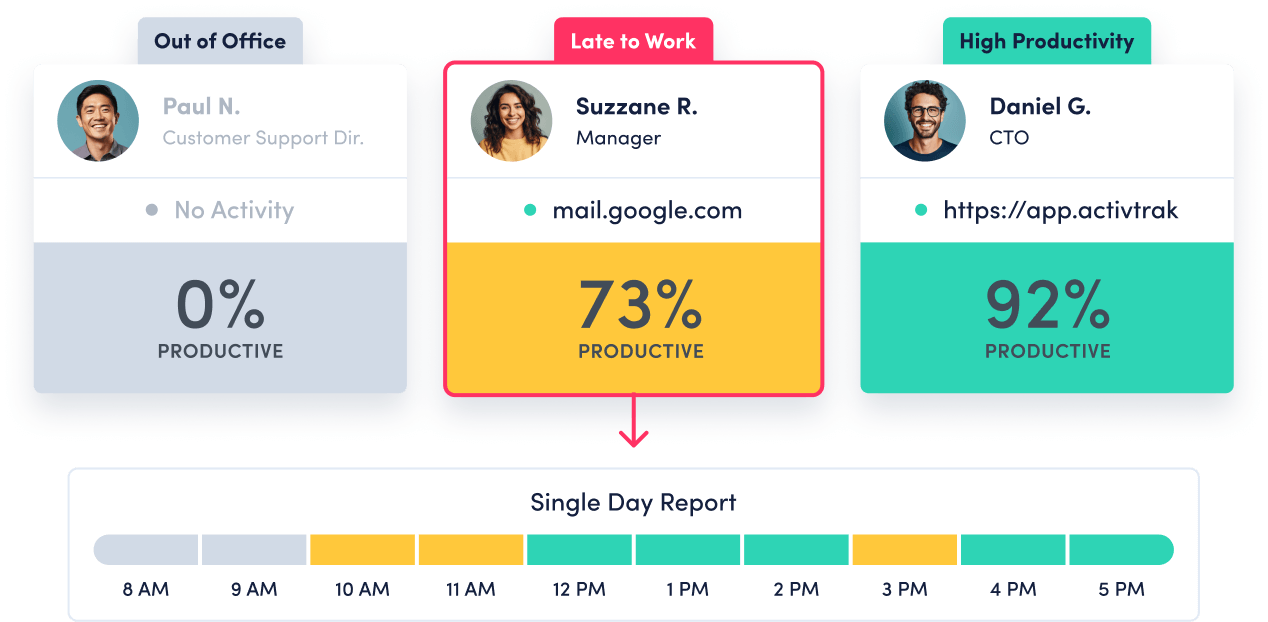
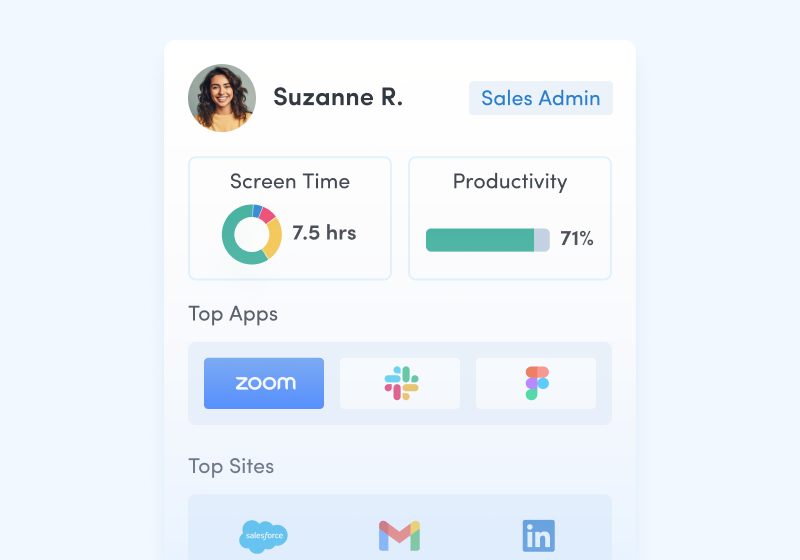
Employee Monitoring
Employee Monitoring
Get real-time visibility into team activity and productivity levels.
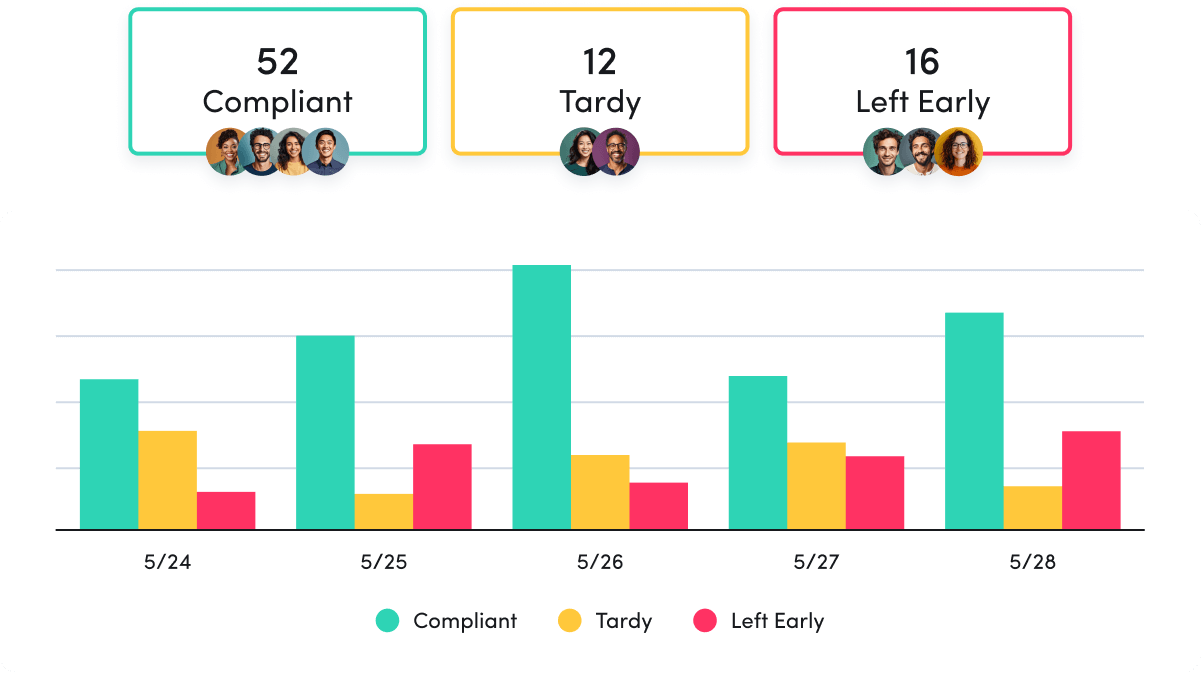
Schedule & Policy Adherence
Schedule & Policy Adherence
Monitor late starts, early departures and extended breaks in real time.
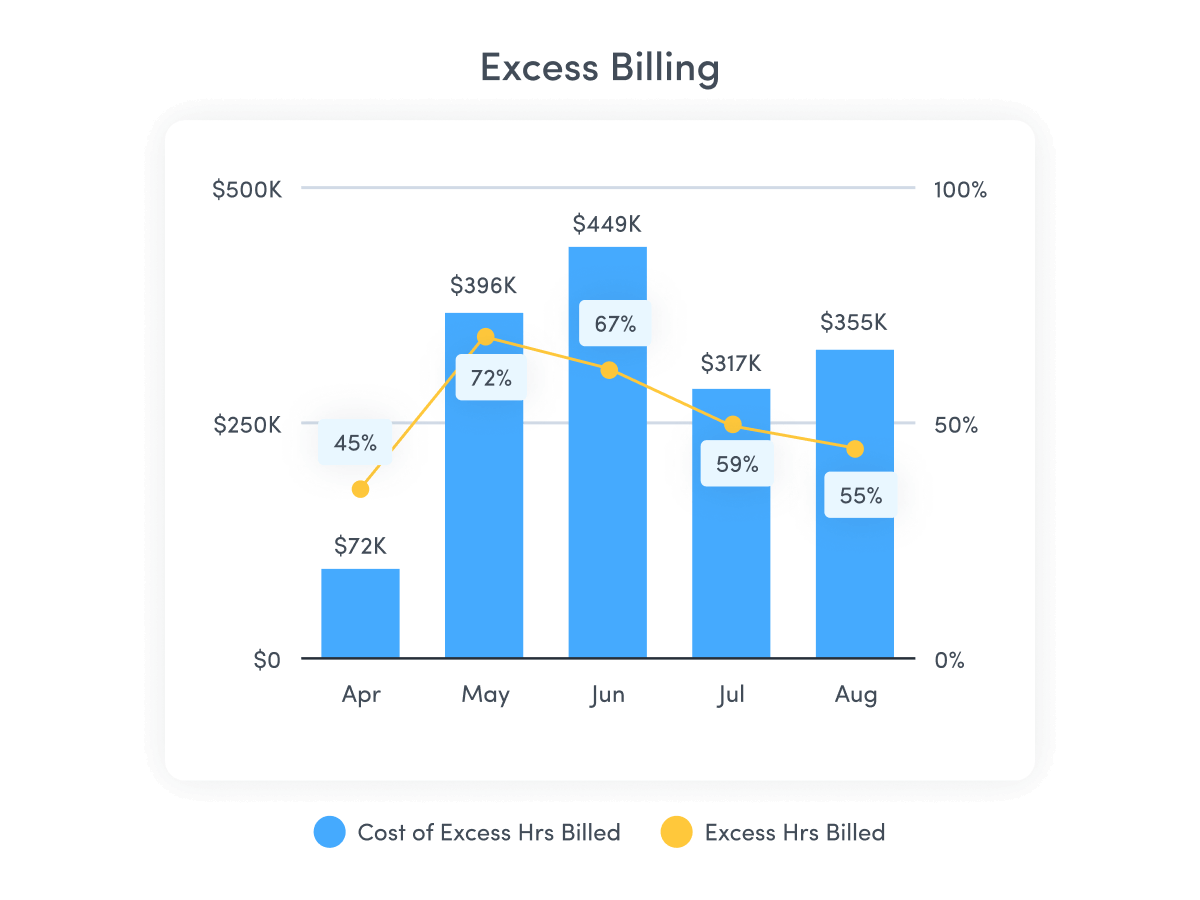
Contractor Billing Reconciliation
Contractor Billing Reconciliation
Confirm contractor hours billed match hours worked.
Timesheet Reconciliation
Timesheet Reconciliation
Automatically verify reported hours against actual work activity to catch errors and prevent overpayments.
Productivity Optimization
Productivity Management
Productivity Management
Make data-driven decisions to fuel productivity across teams and individuals.

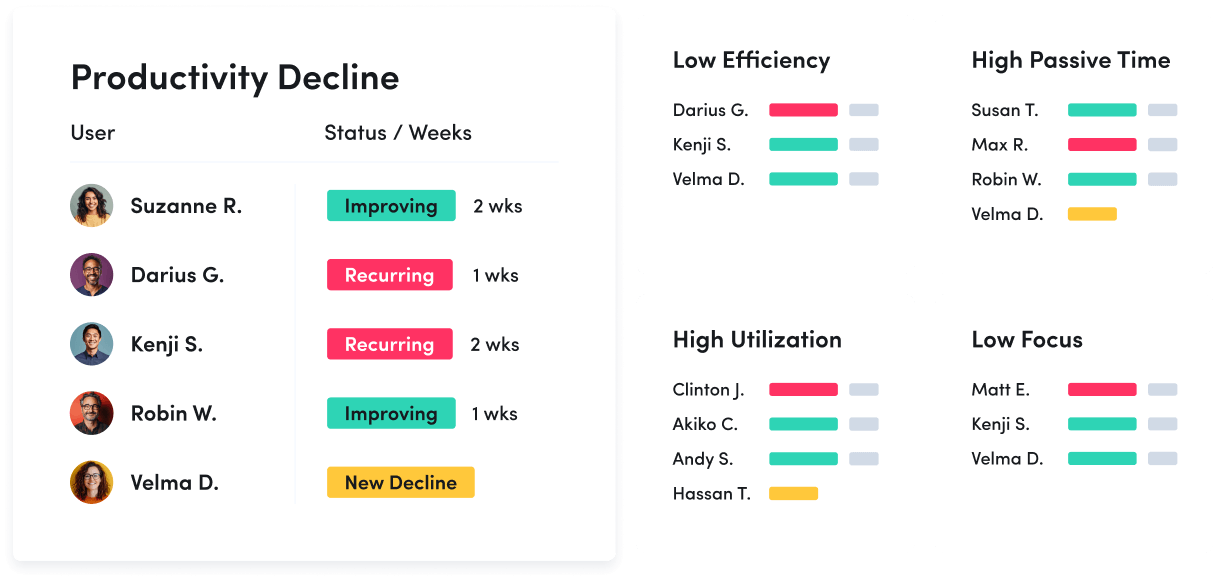
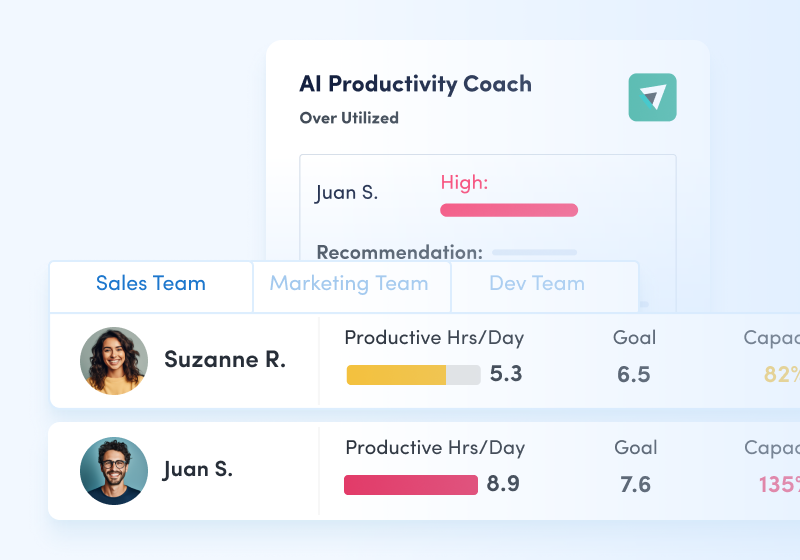
Performance Optimization & Coaching
Performance Optimization & Coaching
Leverage AI-powered insights to understand and optimize team performance.
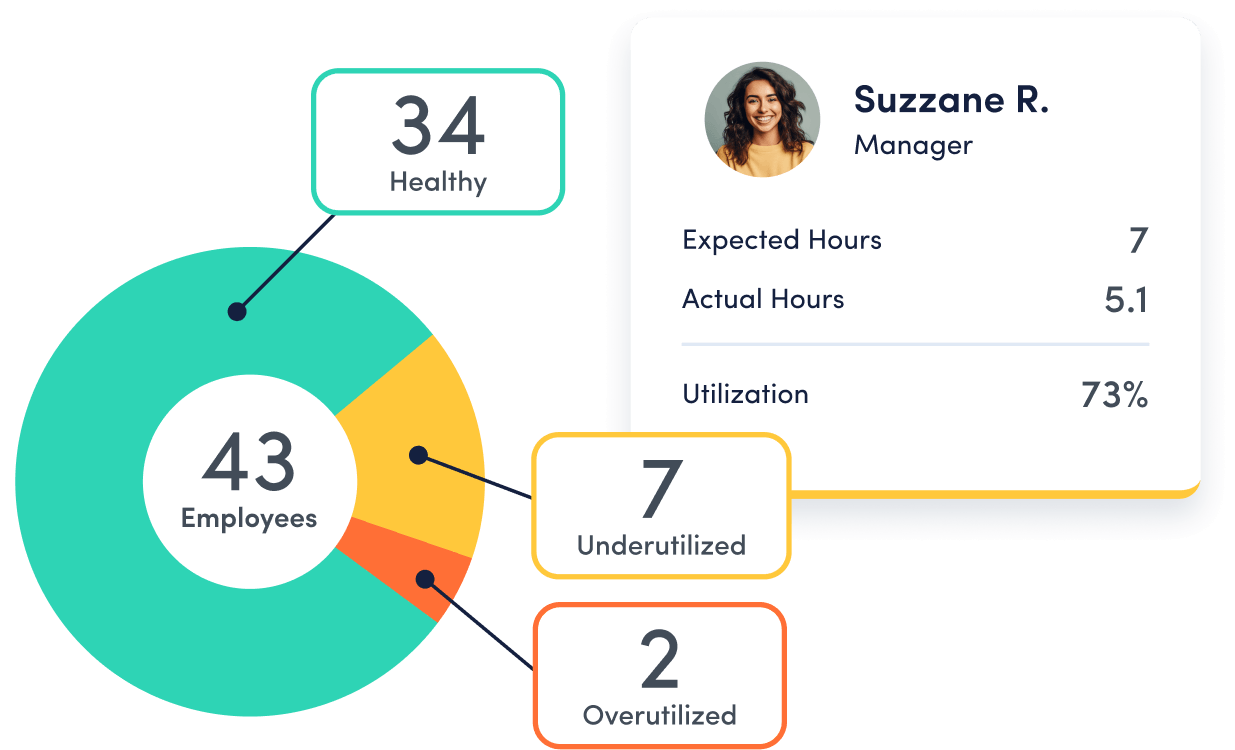
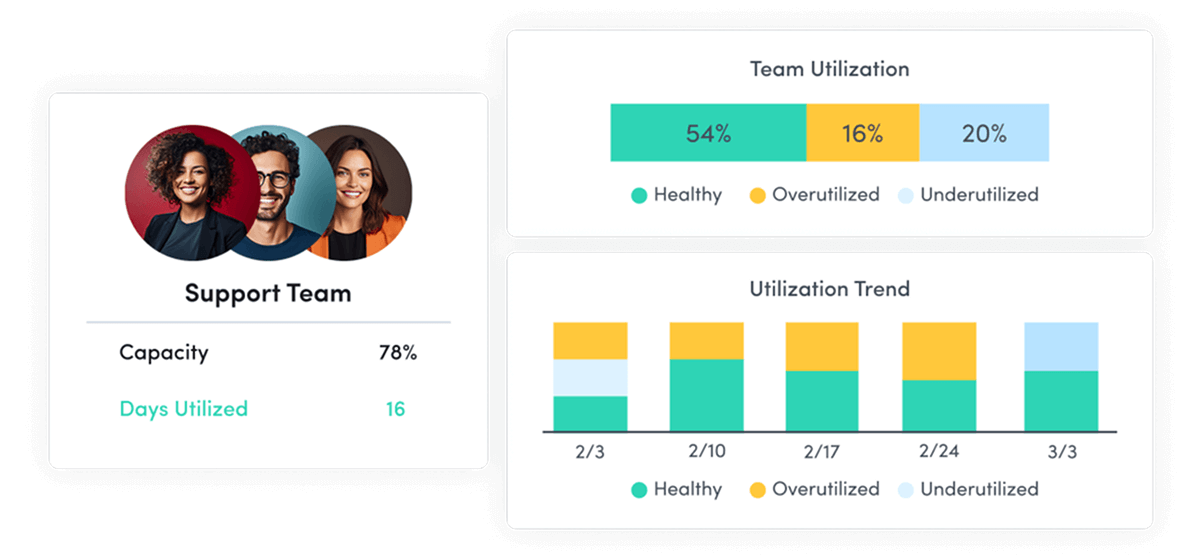
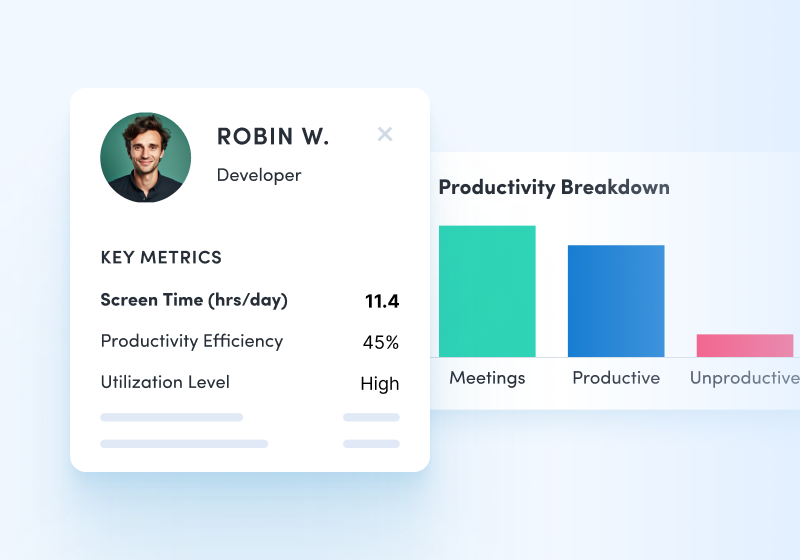
Employee Engagement & Burnout
Employee Engagement & Burnout
Assess employee utilization to detect burnout and balance workloads.
Workforce Planning
Workforce Optimization & Cost Savings
Workforce Optimization & Cost Savings
Uncover hidden inefficiencies to cut costs and boost profitability.
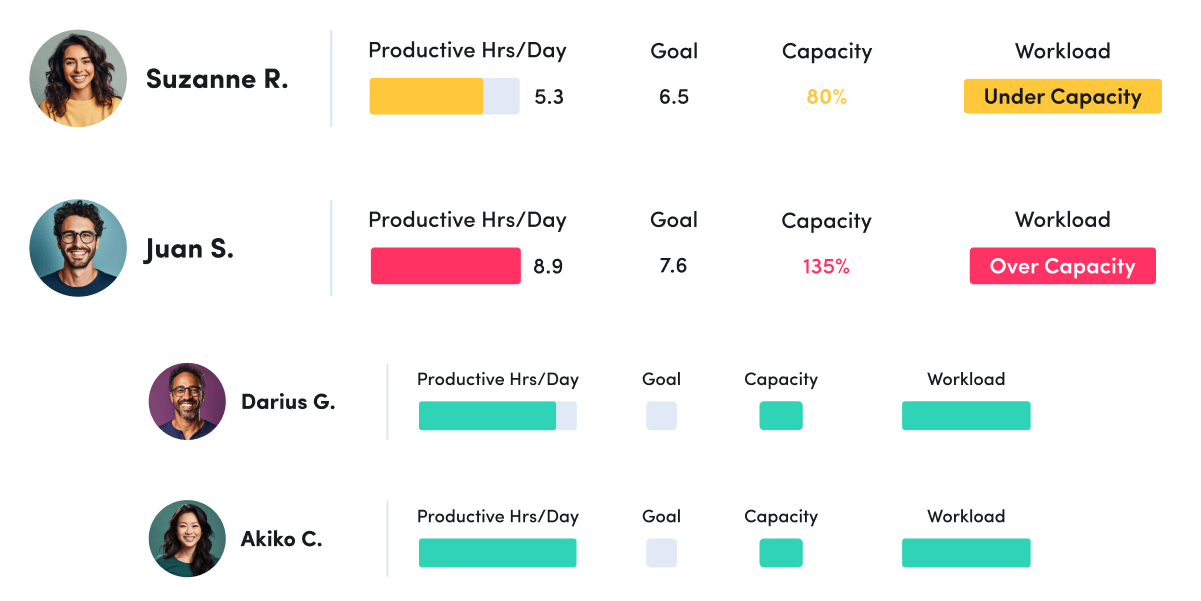
Capacity & Headcount Planning
Capacity & Headcount Planning
Analyze workload capacity to allocate resources and identify staffing needs.
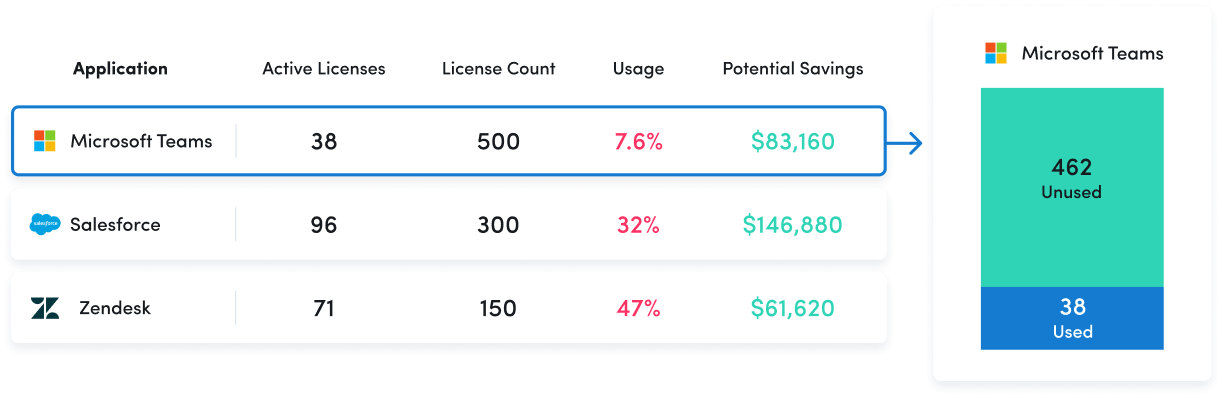
Technology Optimization
Technology Optimization
Track technology usage to identify unused licenses and cut unnecessary costs.
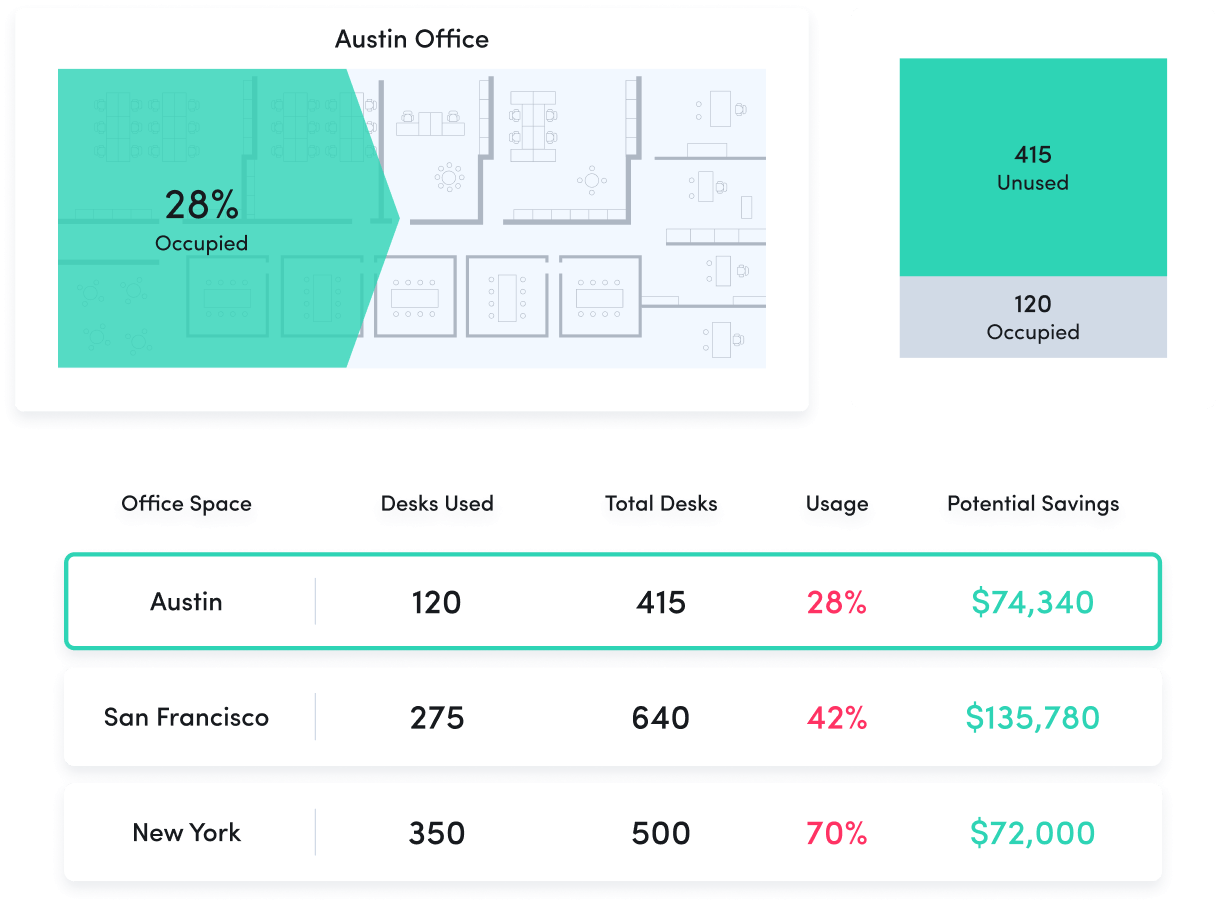
Office Space Planning
Office Space Planning
Right-size real estate investments with insight into office space utilization.
Remote Workforce Management
Track employee productivity by work location to guide workplace policy decisions.
Employee Monitoring
Get real-time visibility into team activity and productivity levels.
Schedule & Policy Adherence
Monitor late starts, early departures and extended breaks in real time.
Contractor Billing Reconciliation
Confirm contractor hours billed match hours worked.
Timesheet Reconciliation
Automatically verify reported hours against actual work activity to catch errors and prevent overpayments.
Productivity Management
Make data-driven decisions to fuel productivity across teams and individuals.
Performance Optimization & Coaching
Leverage AI-powered insights to understand and optimize team performance.
Employee Engagement & Burnout
Assess employee utilization to detect burnout and balance workloads.
Workforce Optimization & Cost Savings
Uncover hidden inefficiencies to cut costs and boost profitability.
Capacity & Headcount Planning
Analyze workload capacity to allocate resources and identify staffing needs.
Technology Optimization
Track technology usage to identify unused licenses and cut unnecessary costs.
Office Space Planning
Right-size real estate investments with insight into office space utilization.
Connect work intelligence across your tech stack
Integrate existing tools to combine workforce activity, AI usage and business data for deeper, more actionable insights.
Workday
ADP

Microsoft Teams
Outlook

Google Calendar
ServiceNow
Zendesk
ChatGPT
Claude
Gemini
Microsoft Viva
Jira Software
Salesforce
Slack
How it Works
Capture behavioral activity
Capture behavioral activity including hours worked, schedule adherence, location policy compliance and app & website usage.
Analyze productivity trends
Analyze productivity trends on employee focus, engagement and utilization to make data-informed decisions on resource allocation.
Optimize team performance
Optimize team performance with benchmarks, goal-tracking and AI coaching recommendations to improve workforce productivity.
Hear what everyone is saying about Activtrak
Powered by![]()
Getting started is easy.
Be up and running in minutes.