Executive Insights That Drive Strategic Impact
Trusted by 9,500+ global brands and organizations
STRATEGIC WORKFORCE INTELLIGENCE
Executive-Ready Insights for Confident Decision-Making
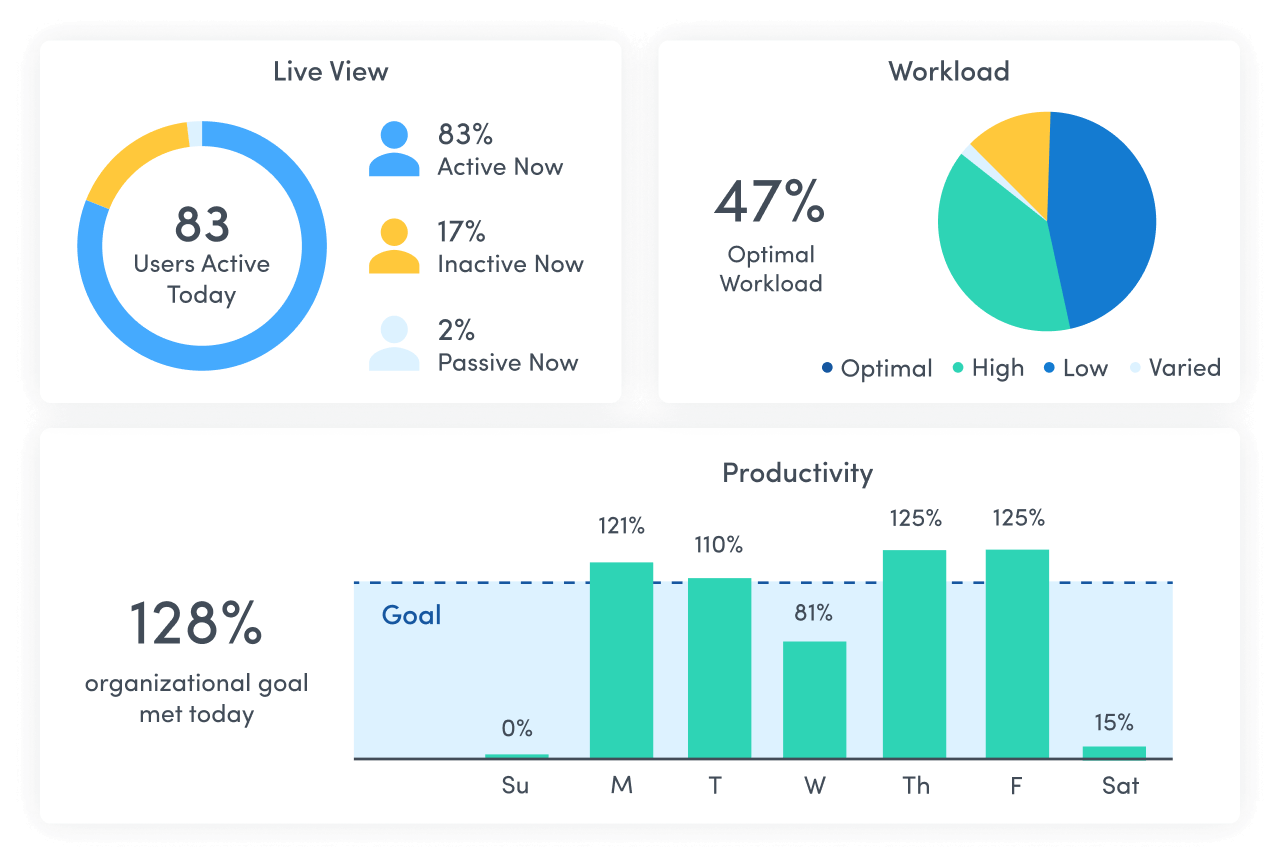
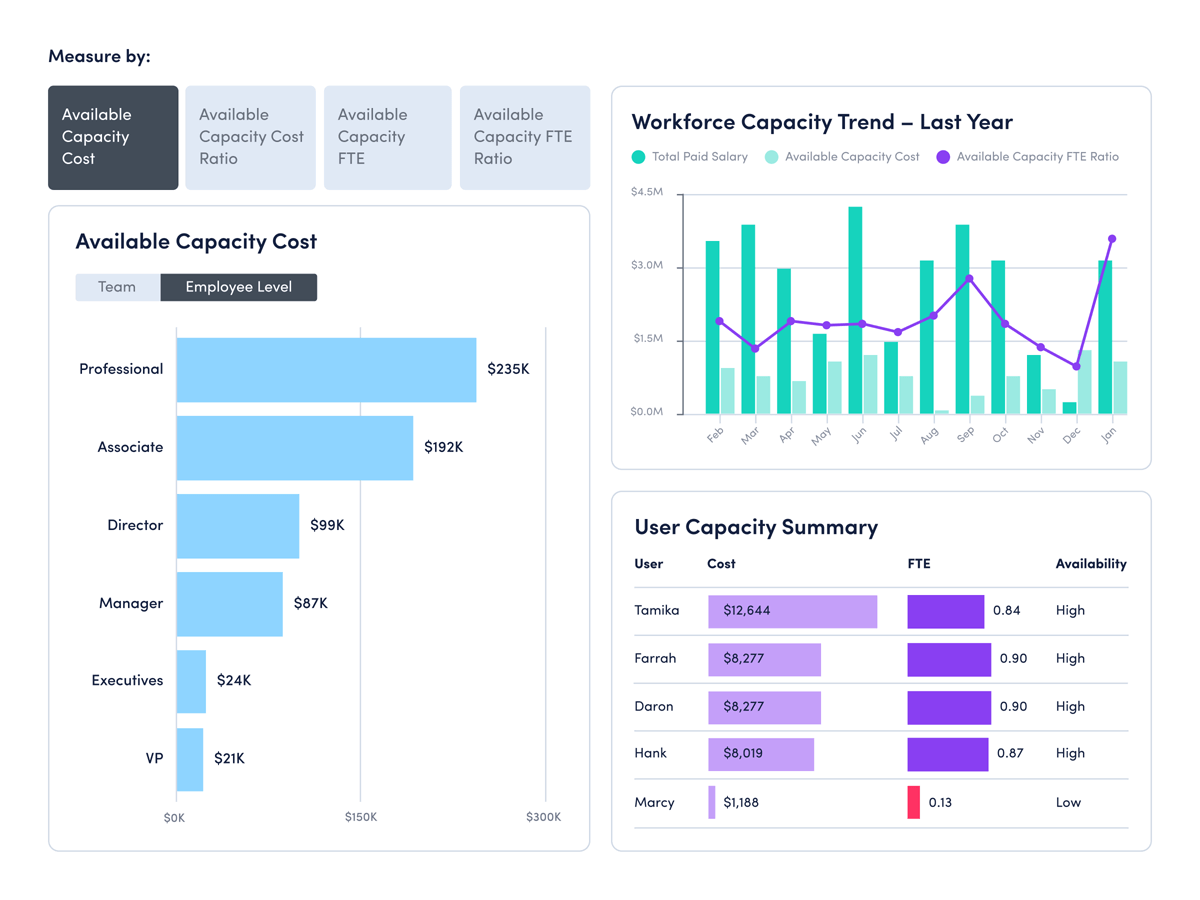
Gain the visibility needed to optimize workforce investments and drive organizational performance through executive-level dashboards.
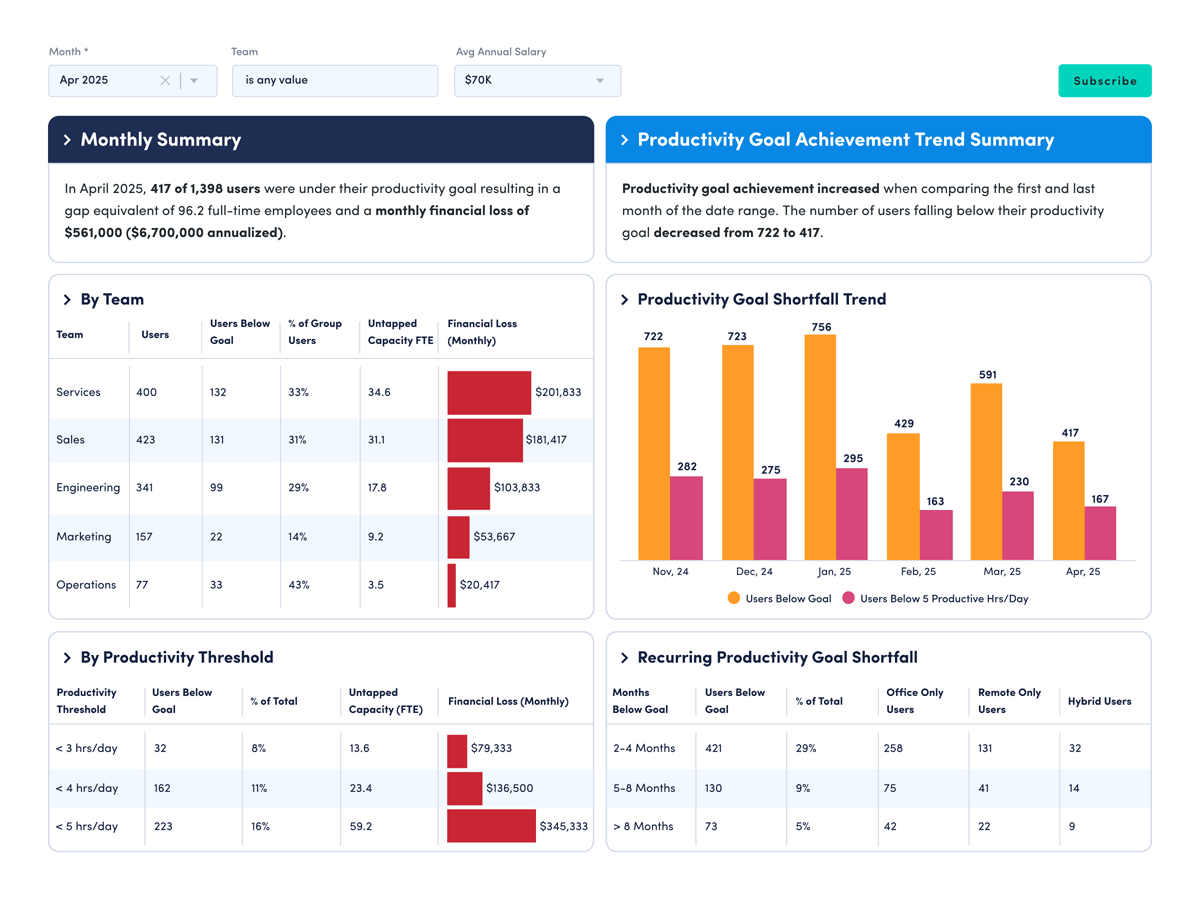
- Unlock hidden capacity and reduce costs
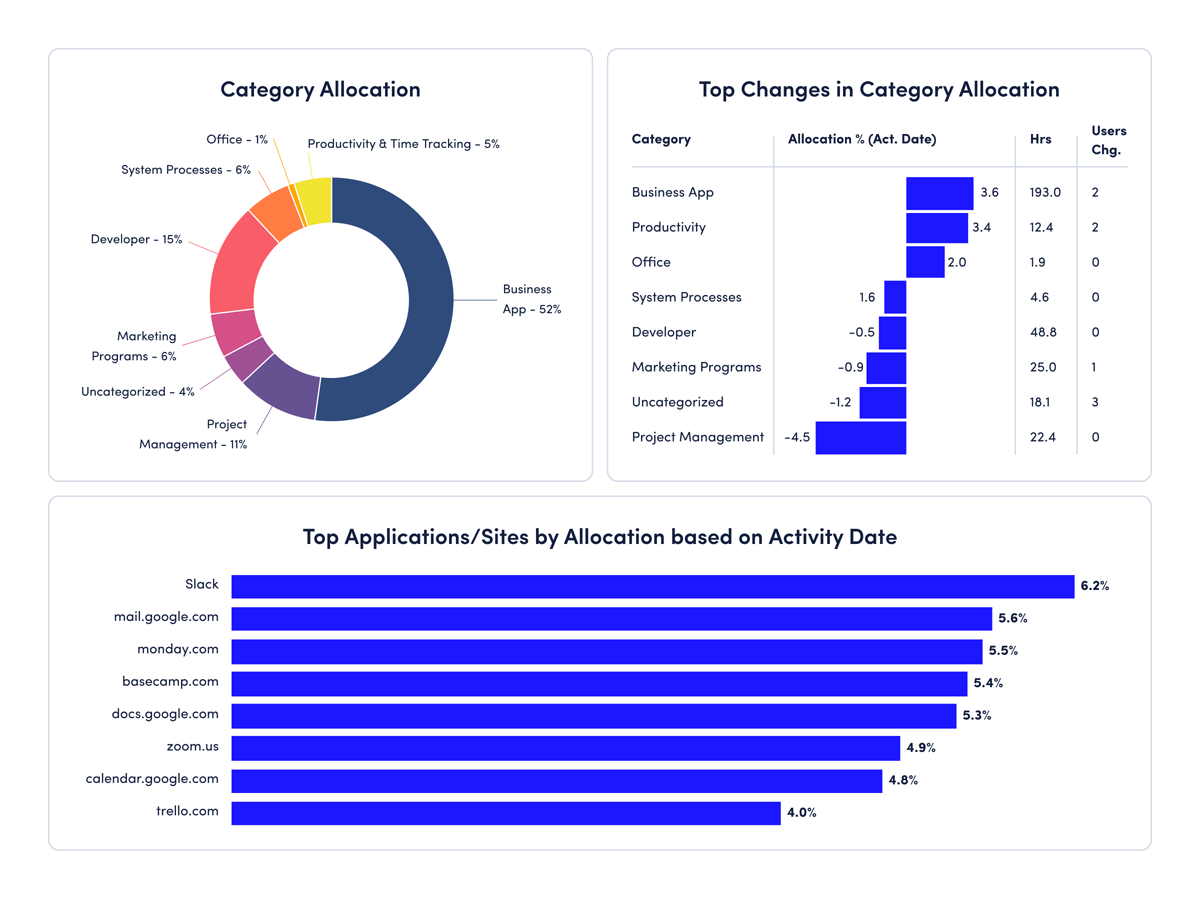
- Maximize tech ROI and adoption
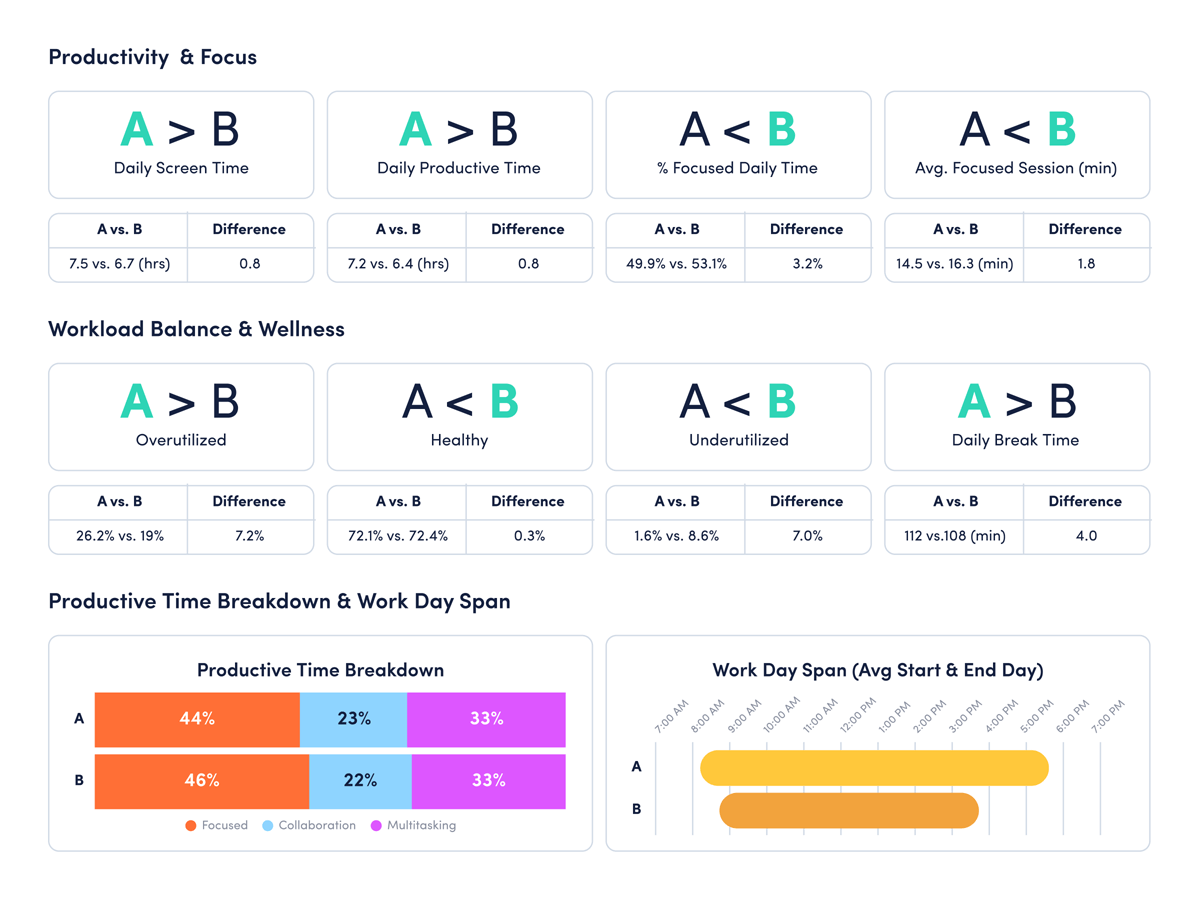
- Drive excellence through comparison
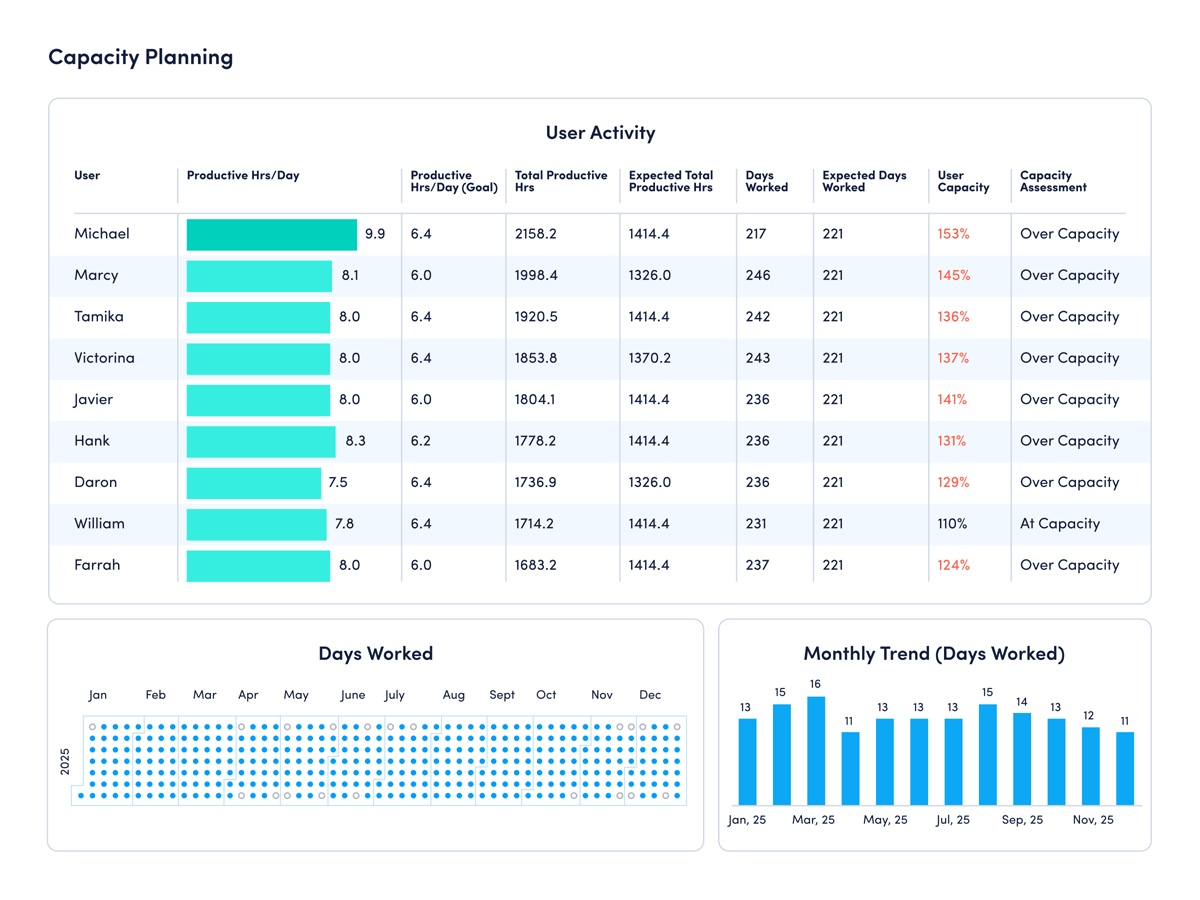
- Right-size teams with confidence
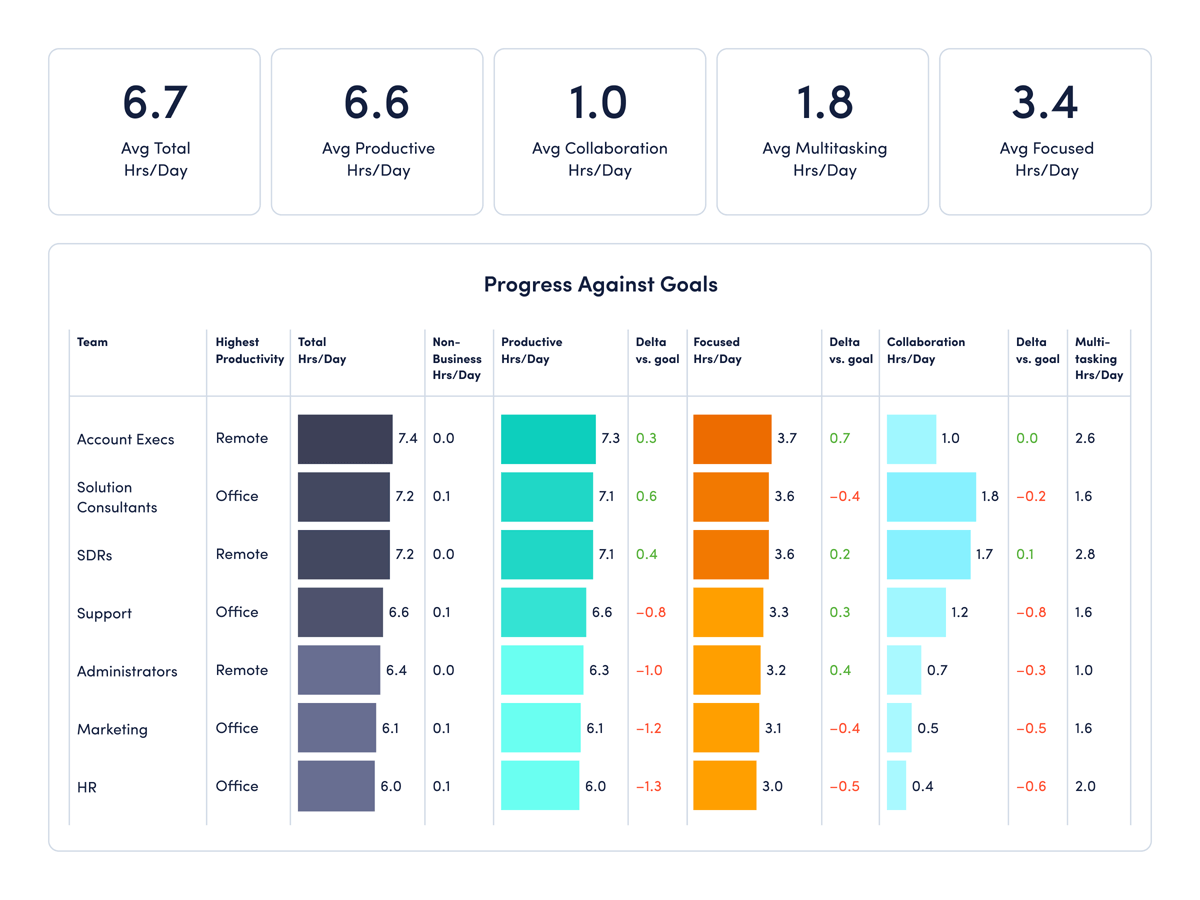
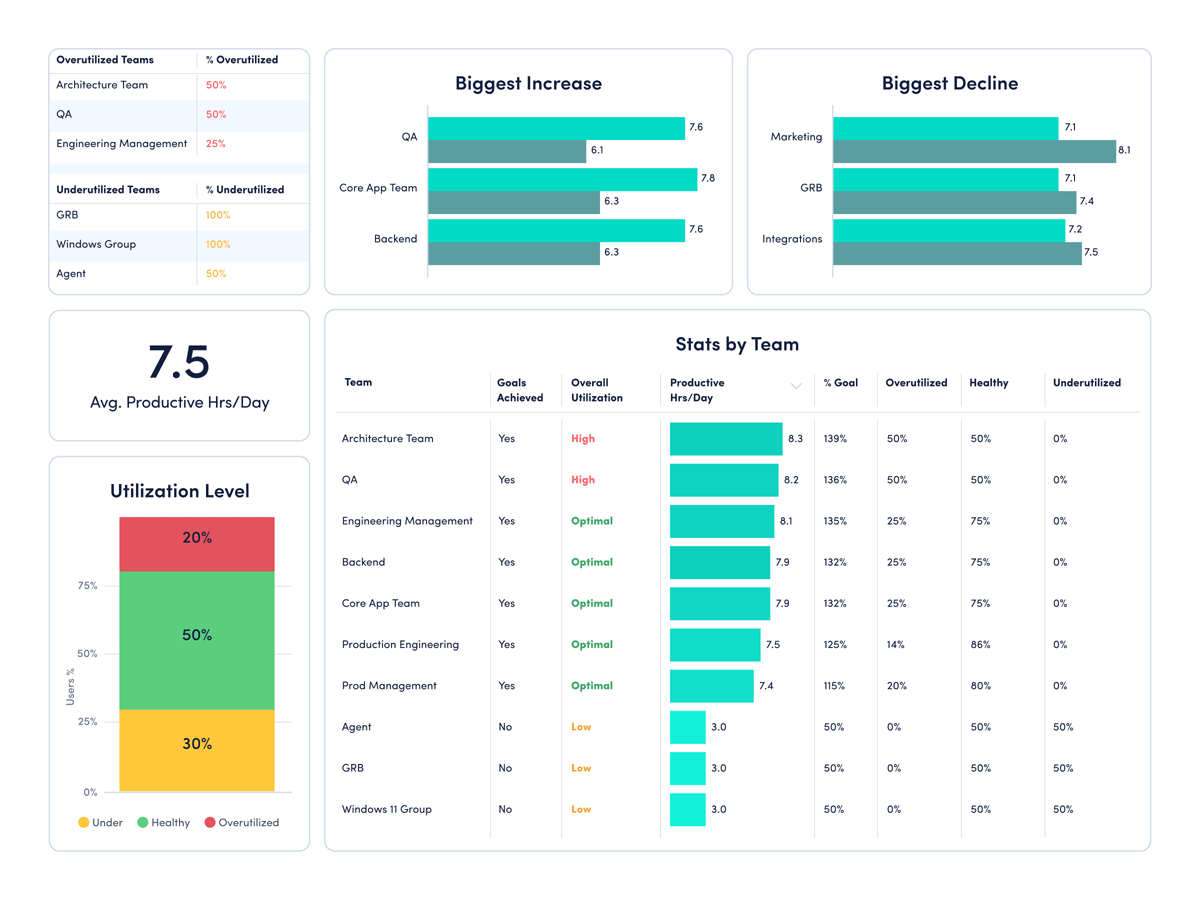
- Measure what matters
- Maximize efficiency to drive growth
- Understand productivity from every angle

We analyze trends over time, set benchmarks, and use goal-based productivity metrics to support performance reviews and team optimization strategies.
— Director, HR
ActivTrak fits your stack
Get deeper insights, integrate with any app.
Saleforce

Microsoft Teams
Slack
ServiceNow
Zendesk
Zoom
Microsoft Viva
Lattice
Qualtrics XM
Jira Software
Workday
ADP
Culture Amp
Asana
How it works
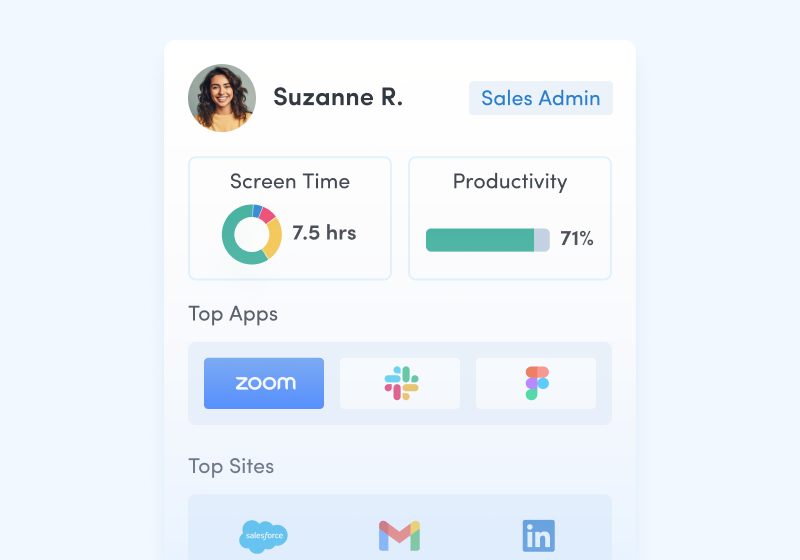
Capture employee activity
Capture employee activity including hours worked, schedule adherence, location policy compliance and app & website usage.
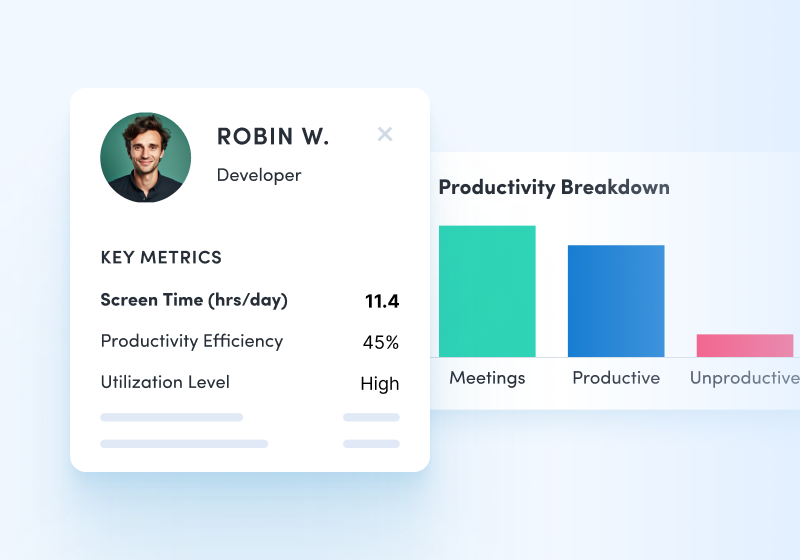
Analyze productivity trends
Analyze productivity trends on employee focus, engagement and utilization to make data-informed decisions on resource allocation.
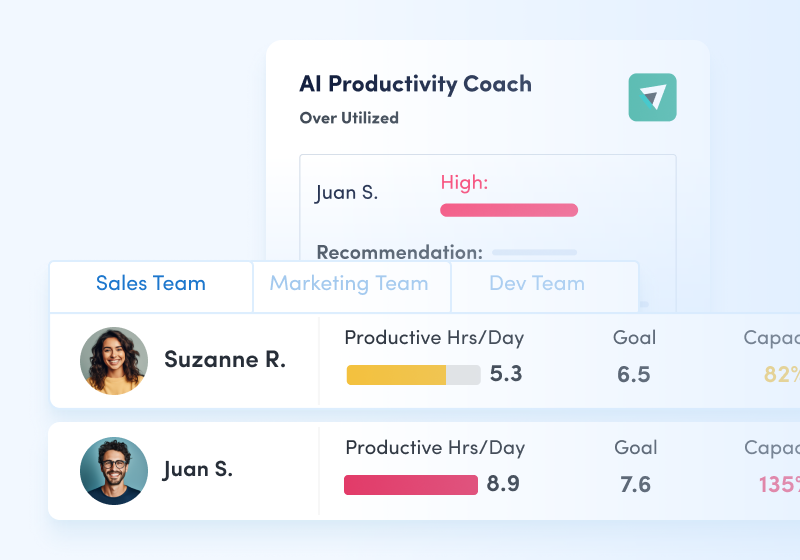
Optimize team performance
Optimize team performance with benchmarks, goal-tracking and AI coaching recommendations to improve workforce productivity.
Hear what everyone is saying about Activtrak
Powered by![]()
Getting started is easy.
Be up and running in minutes.