Workforce Planning Software

Trusted by 9,500+ global brands and organizations
WORKFORCE PLANNING SOFTWARE
Take the guesswork out of critical workforce strategies
Increase productivity and profit margins — fast. ActivTrak unlocks unprecedented visibility into your company’s most valuable assets – your people, tools and workplaces.
Discover how ActivTrak helps you:
- Maximize workforce ROI
- Control your technology costs
- See how change impacts teams
- Understand where employees work best
- Identify hidden capacity and workforce costs

“I use ActivTrak’s data for indisputable evidence for hiring new staff; primarily because workforce is 78% of my costs. Anytime there is a request for a new salaried headcount, I look at the utilization of the current team in the Headcount Planning Dashboard before approving.”
CFO
Human Resource & Employment Services
500-1000 employees
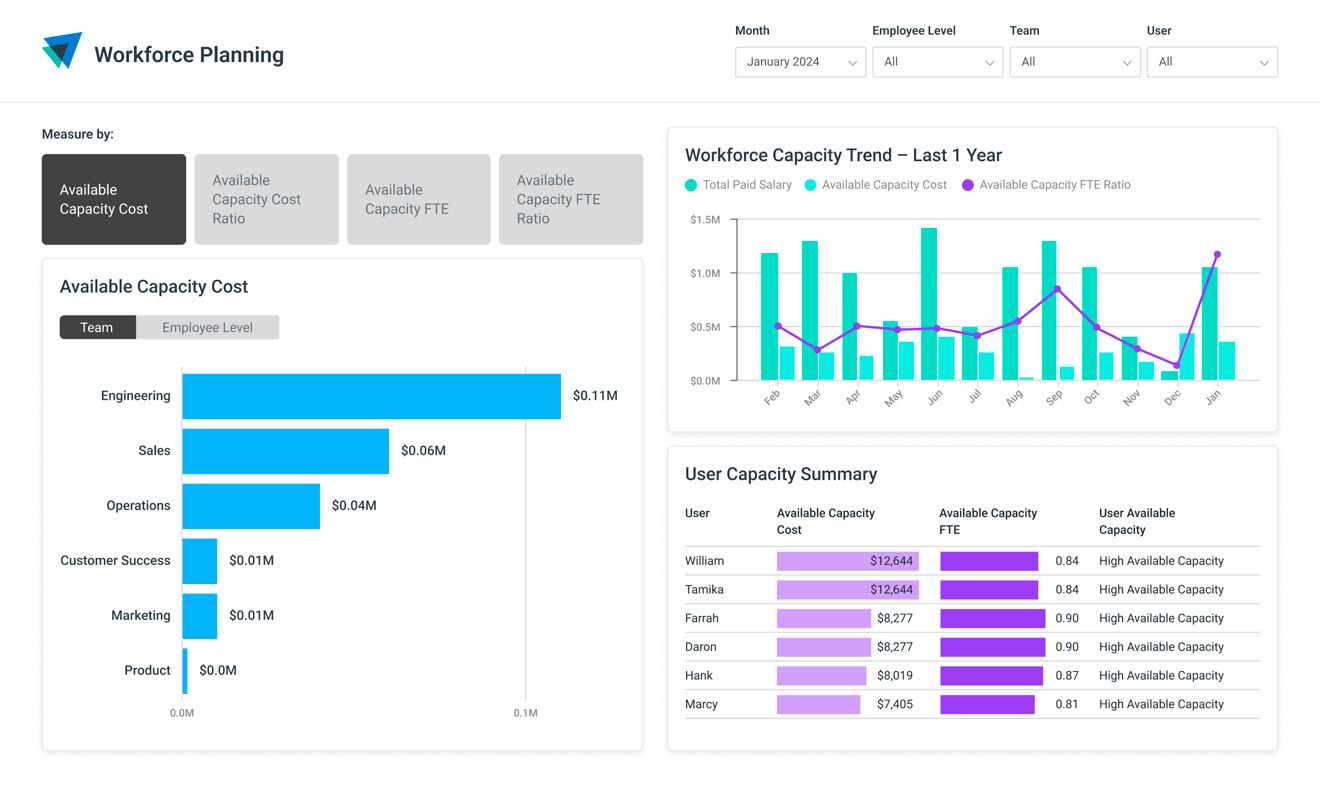
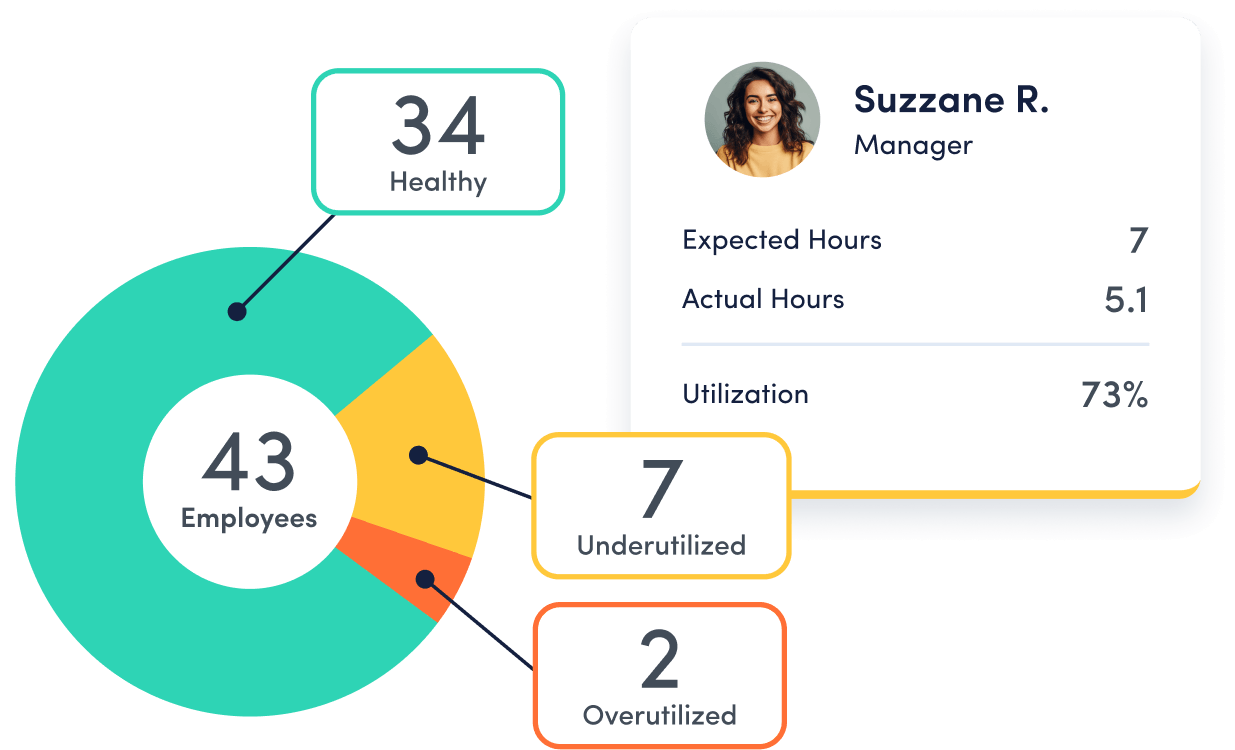
CAPACITY & HEADCOUNT PLANNING
Maximize workforce ROI with data-informed headcount decisions
- Discover untapped labor capacity.
- Make data-informed efficiency and headcount decisions.
- Rightsize teams and balance workloads.
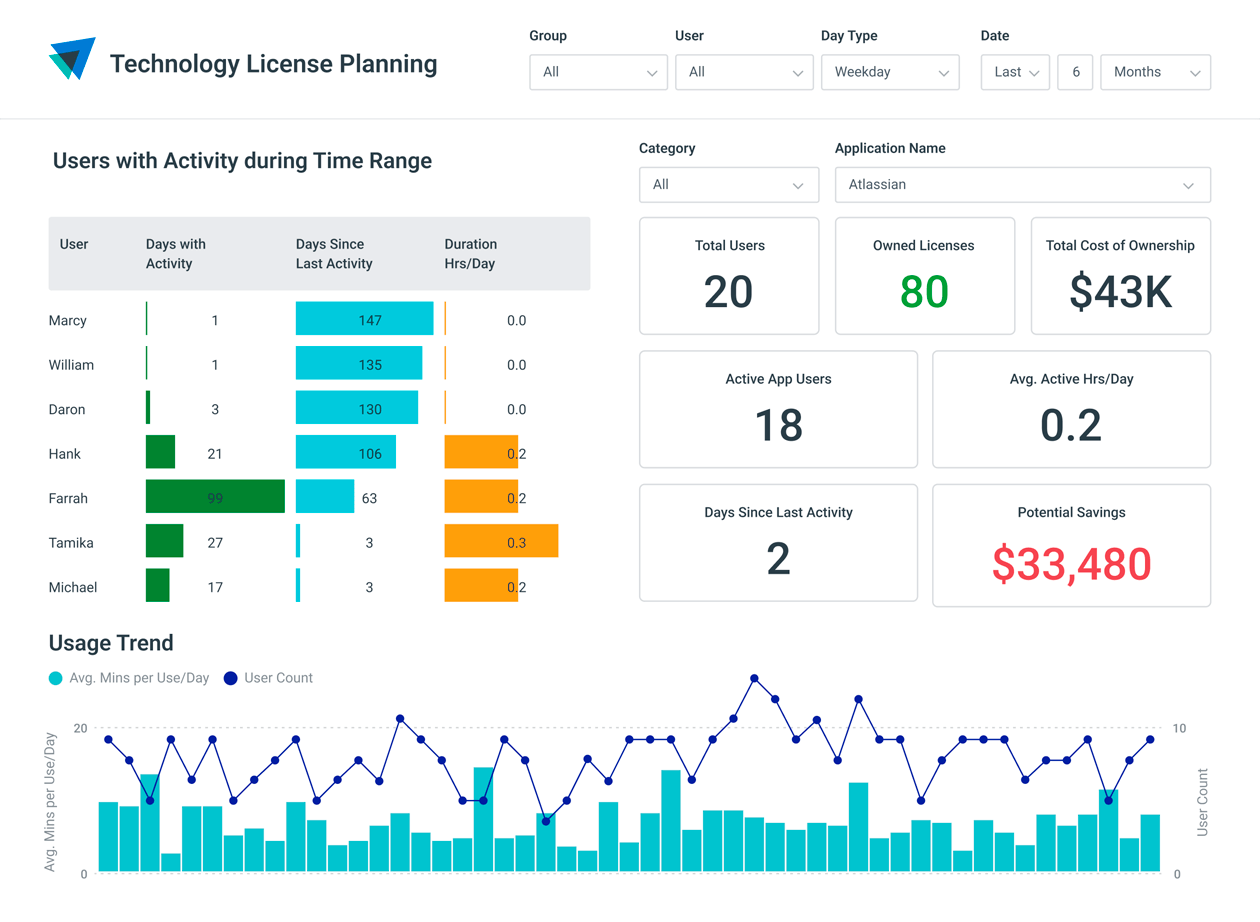
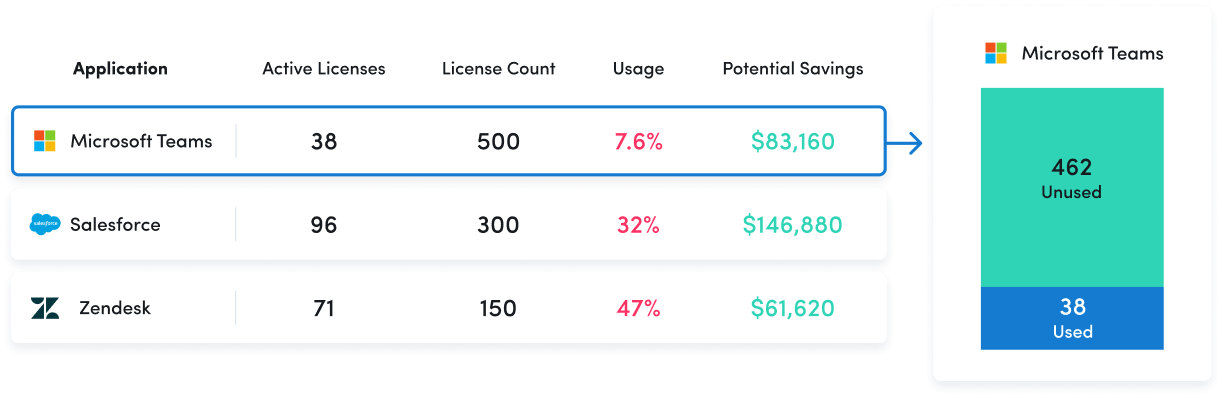
TECHNOLOGY LICENSE PLANNING
Control your technology costs
- Identify unused licenses, duplicate tools and underutilized apps.
- Monitor license usage to anticipate future needs and reallocate resources.
- Correct technology budgets based on usage patterns.
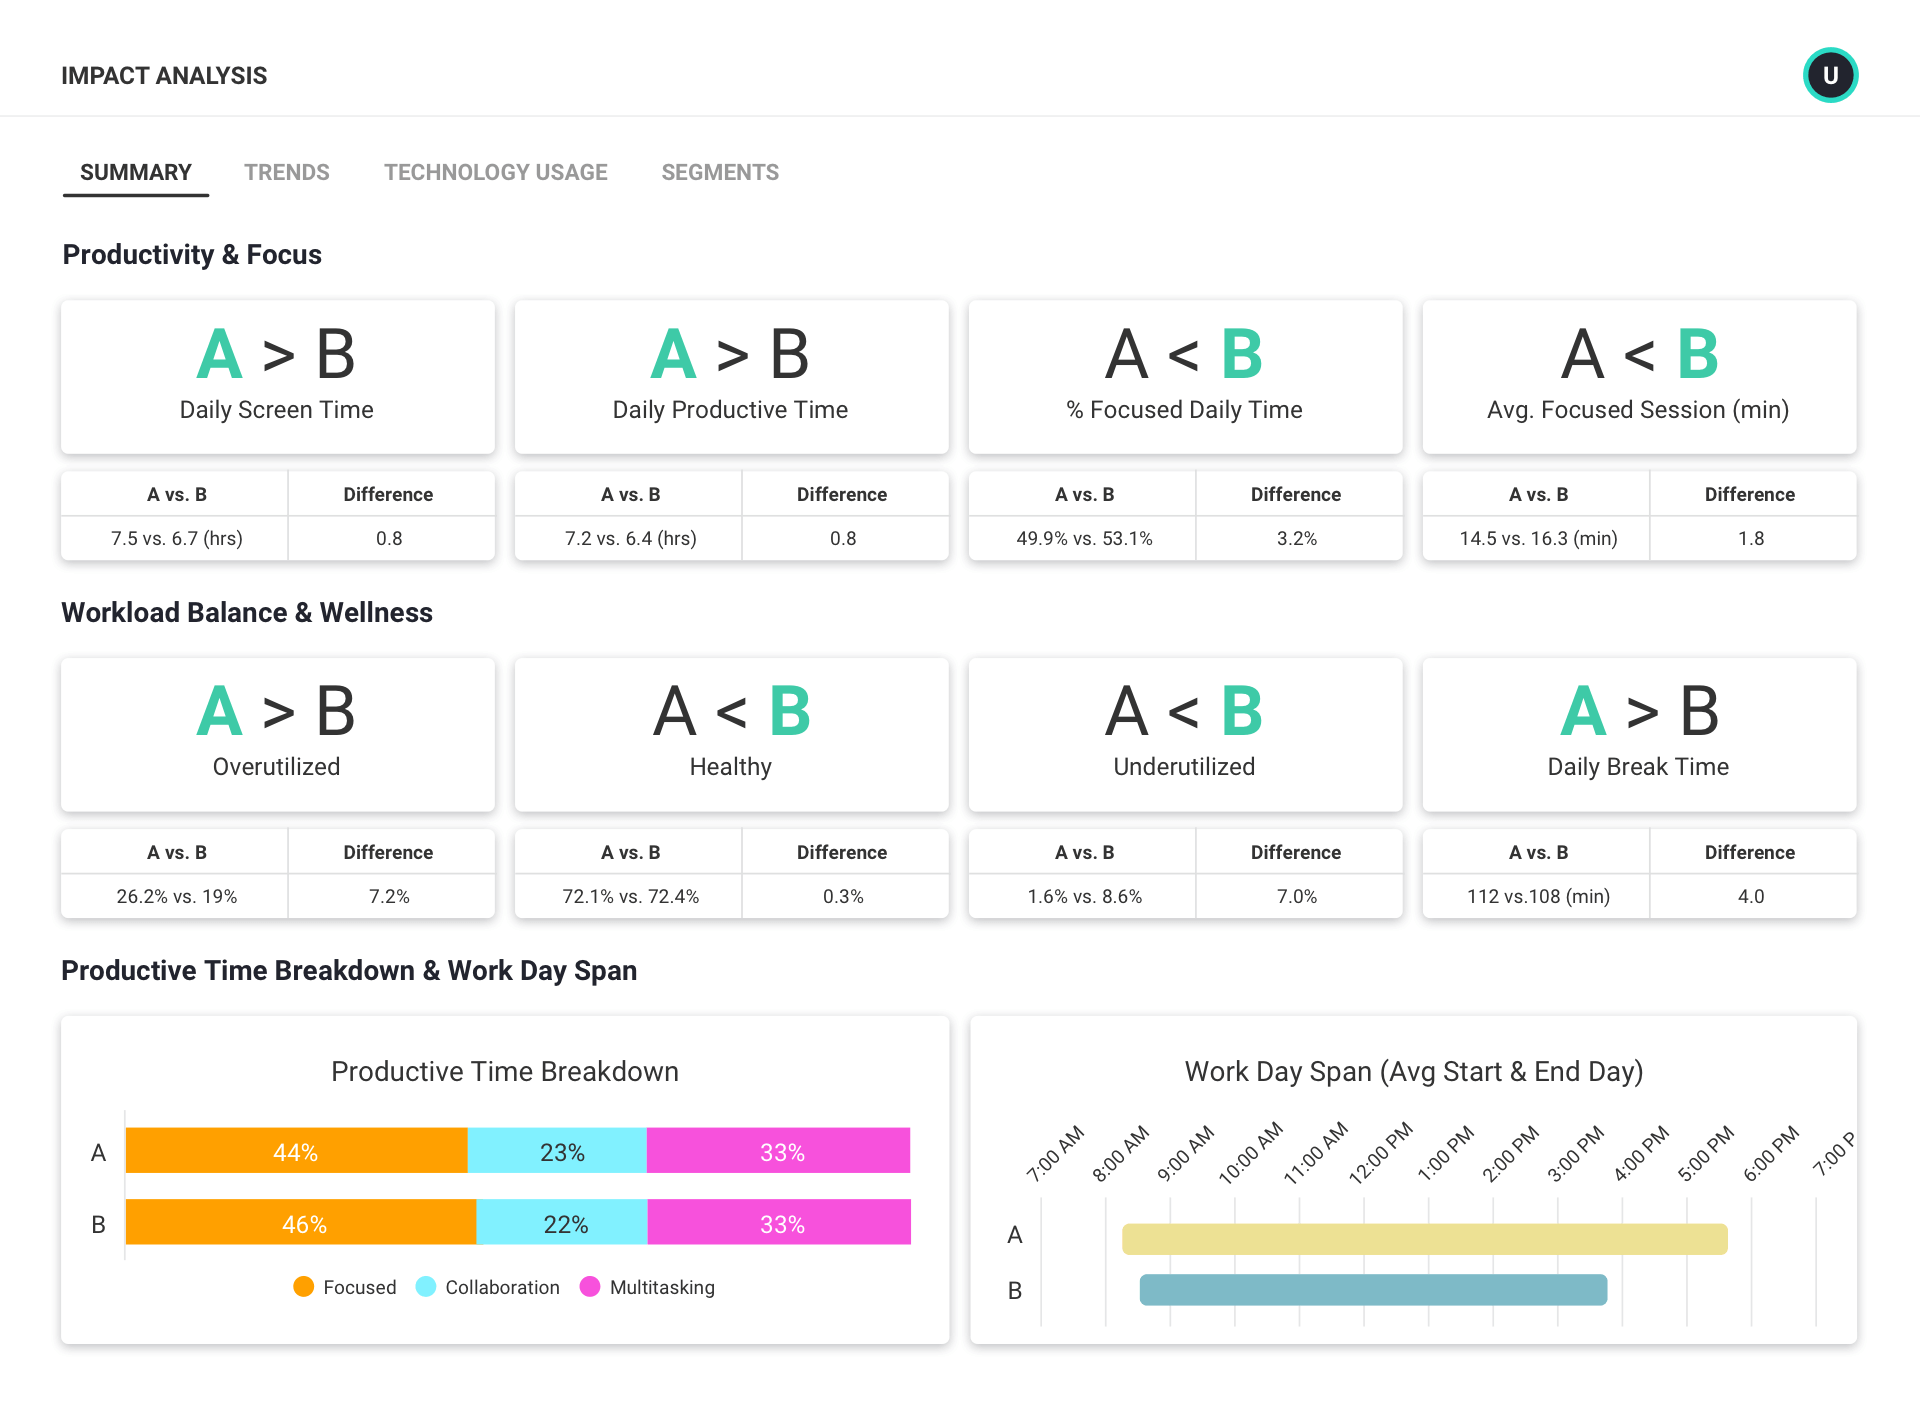
IMPACT ANALYSIS
See how organizational change affects your teams
- Conduct before-and-after analyses and A/B tests.
- Understand trends in employee productivity, workload, engagement and technology usage.
- Quickly identify and mitigate negative effects.
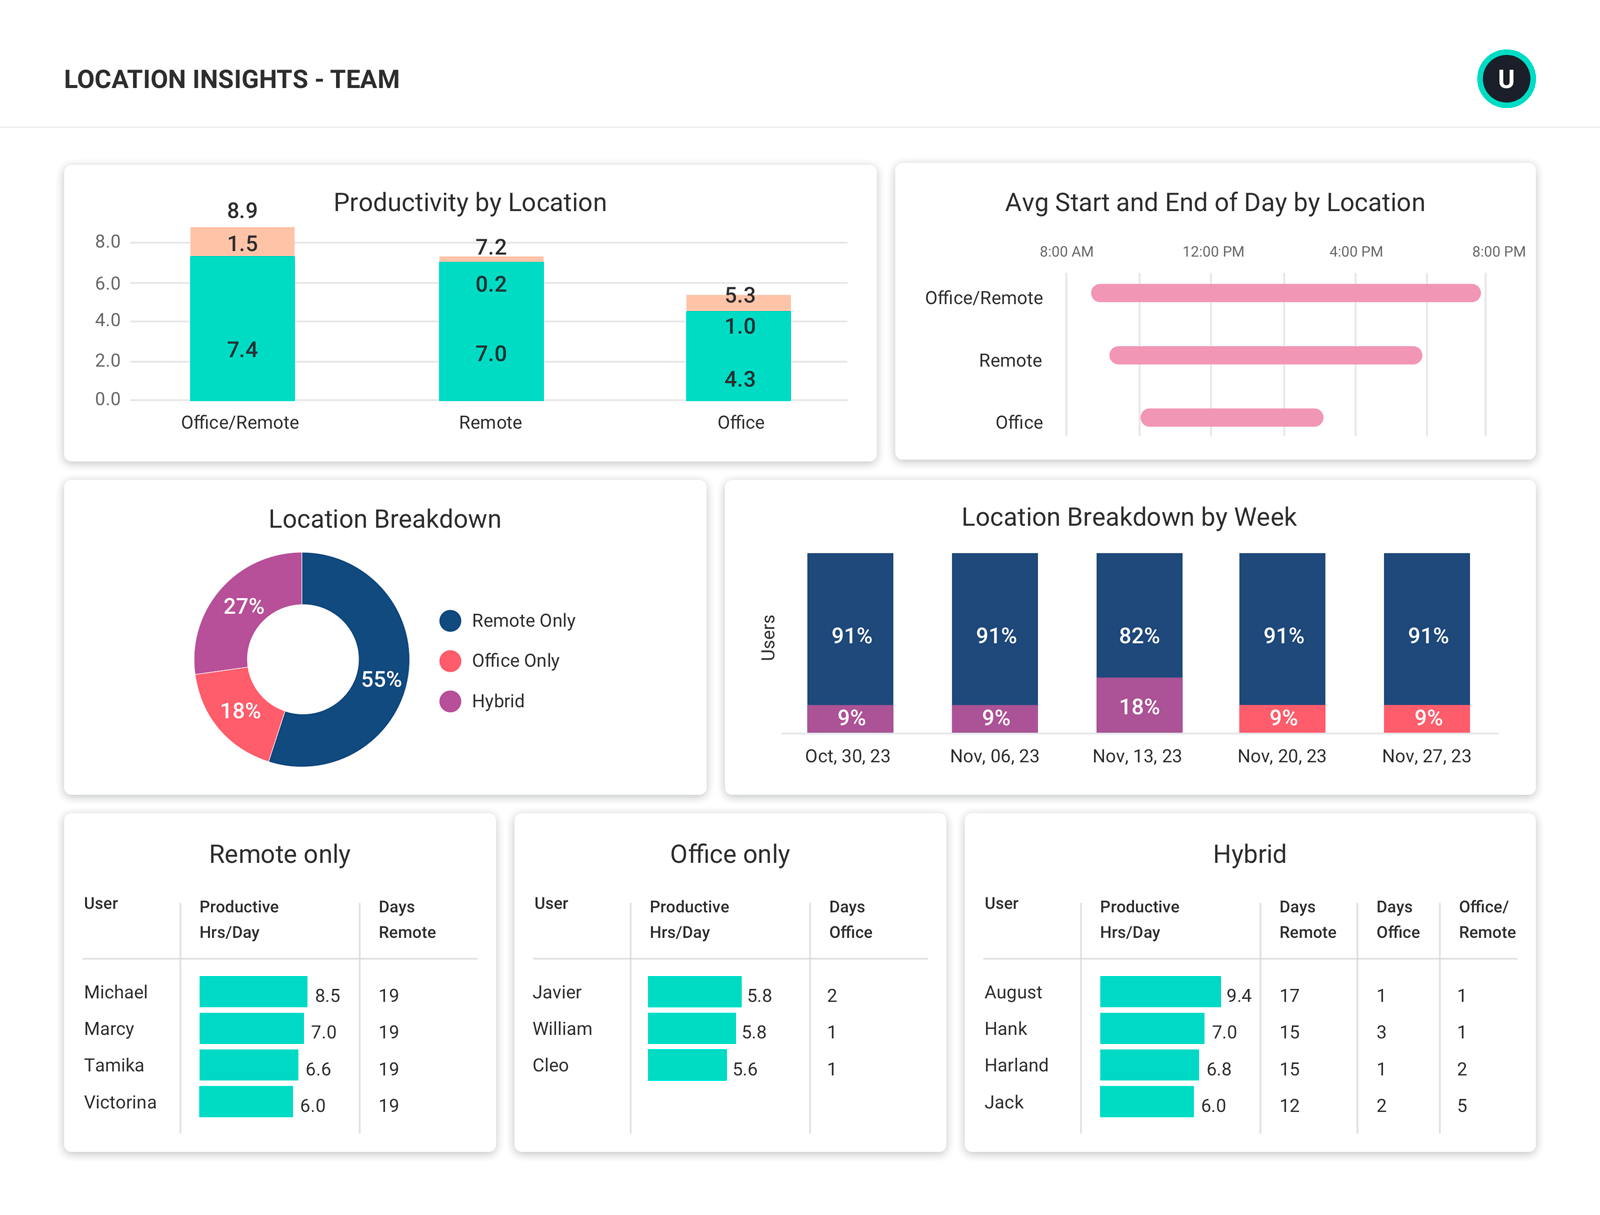
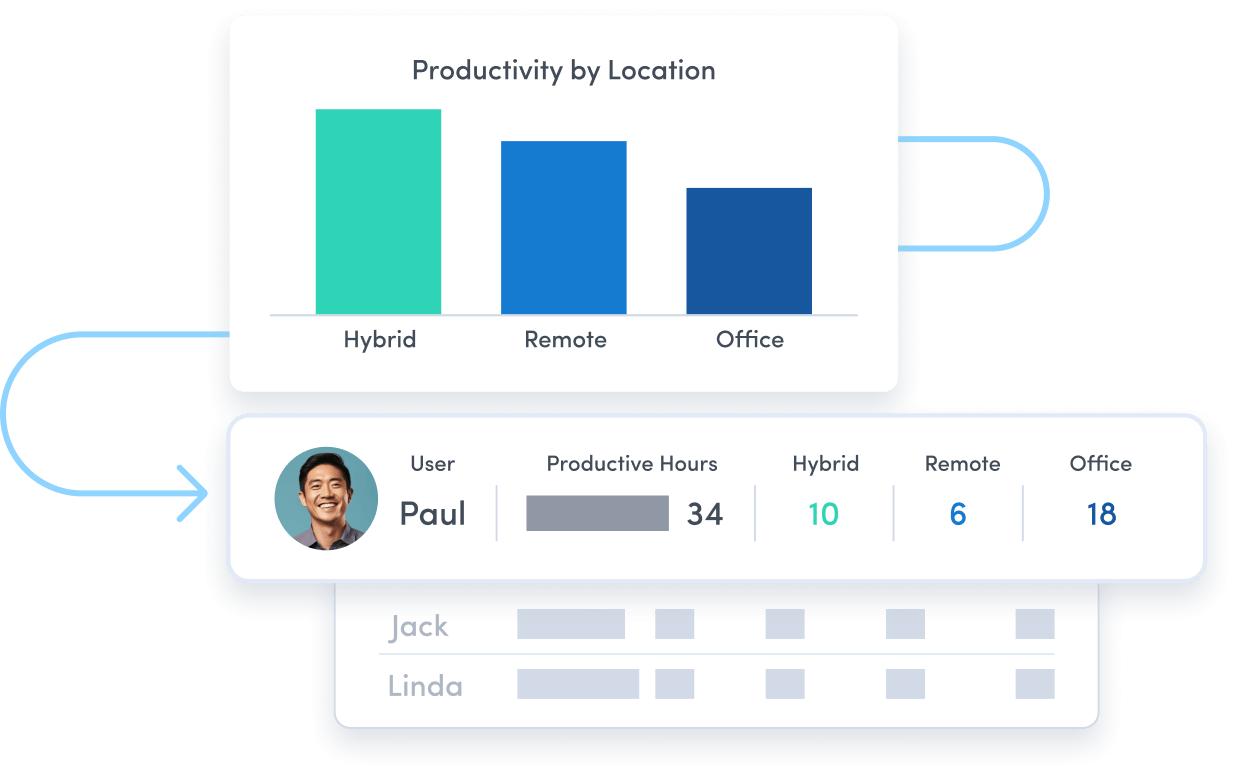
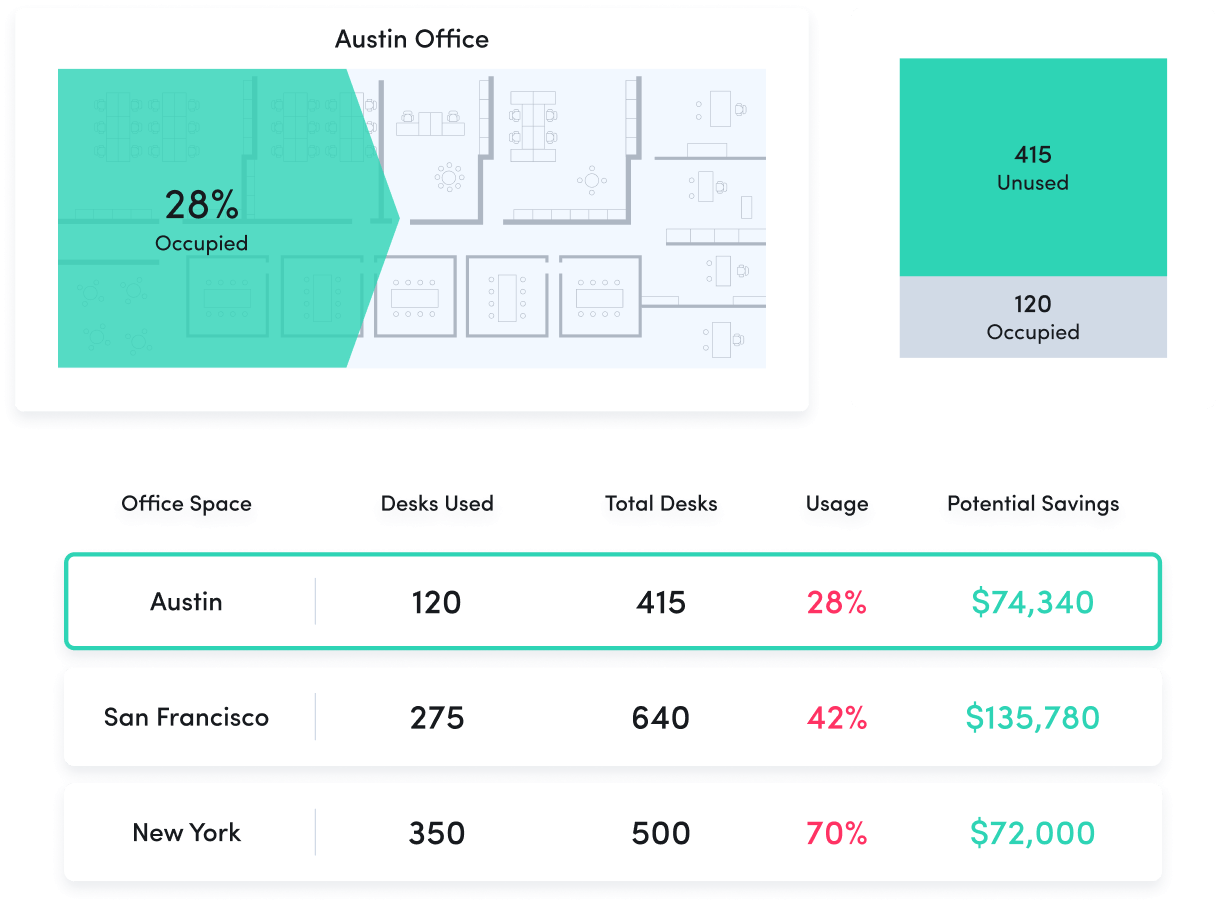
LOCATION INSIGHTS
Understand where employees work best
- Evaluate productivity across different work environments.
- See who’s in the office (and when) for hybrid work policy compliance.
- Align office space investments to actual needs.
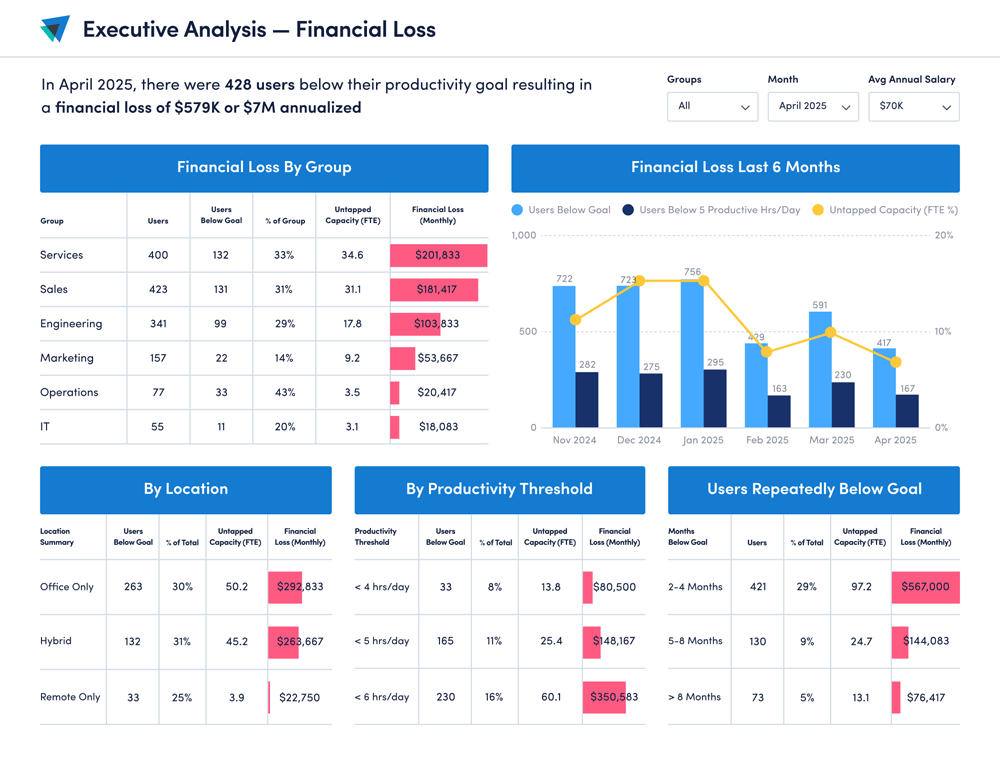
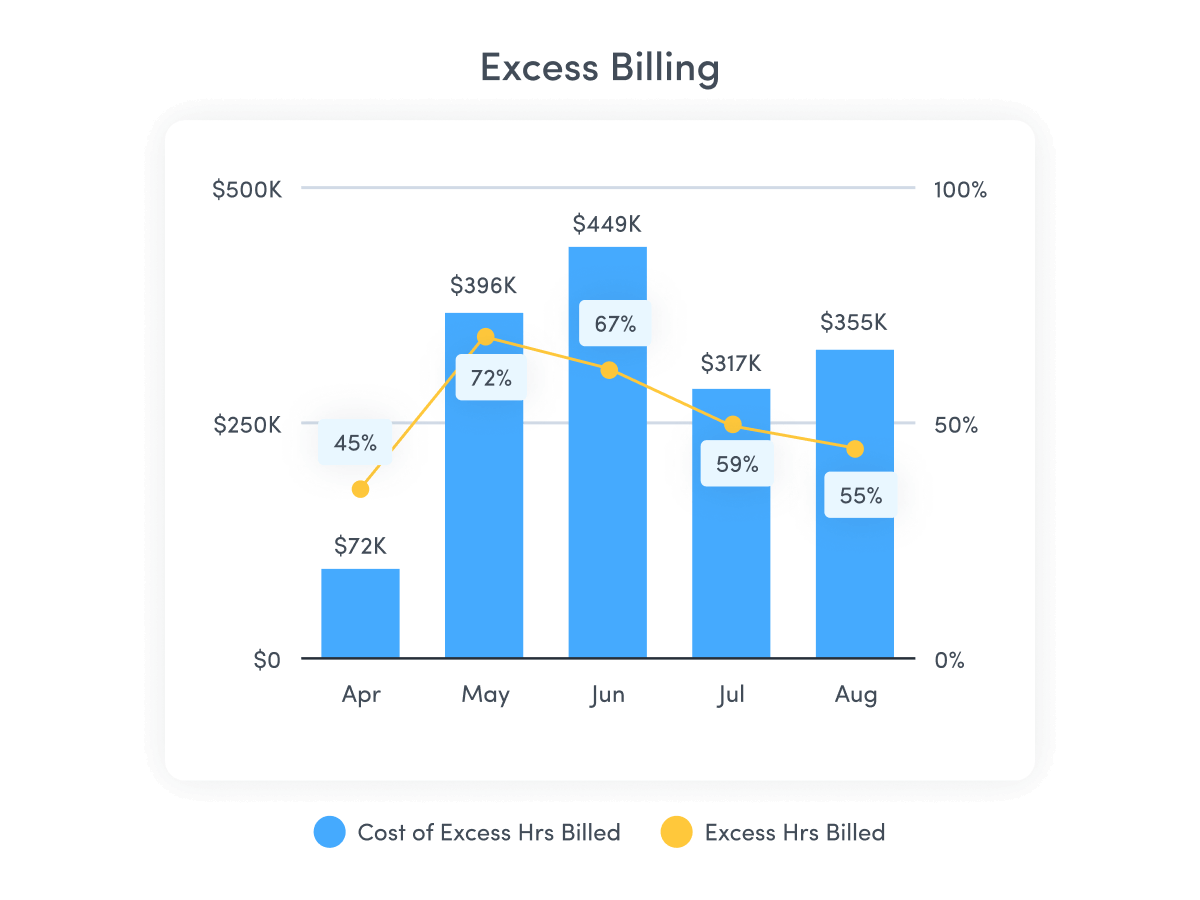
FINANCIAL LOSS ANALYSIS
Reveal cost saving opportunities
- Connect productivity to financial impact to improve forecasting and budgeting decisions.
- Quantify inefficiencies, reallocate resources and capture millions in lost value.
- Built for C-suite decision-making with executive-level financial translation.
Explore our powerful features
ActivTrak is the most comprehensive workforce analytics solution, with robust features to address your employee monitoring, productivity management and workforce planning needs. Make data-driven decisions to quickly optimize performance and boost productivity.
Workforce Management
Remote Workforce Management
Remote Workforce Management
Track employee productivity by work location to guide workplace policy decisions.
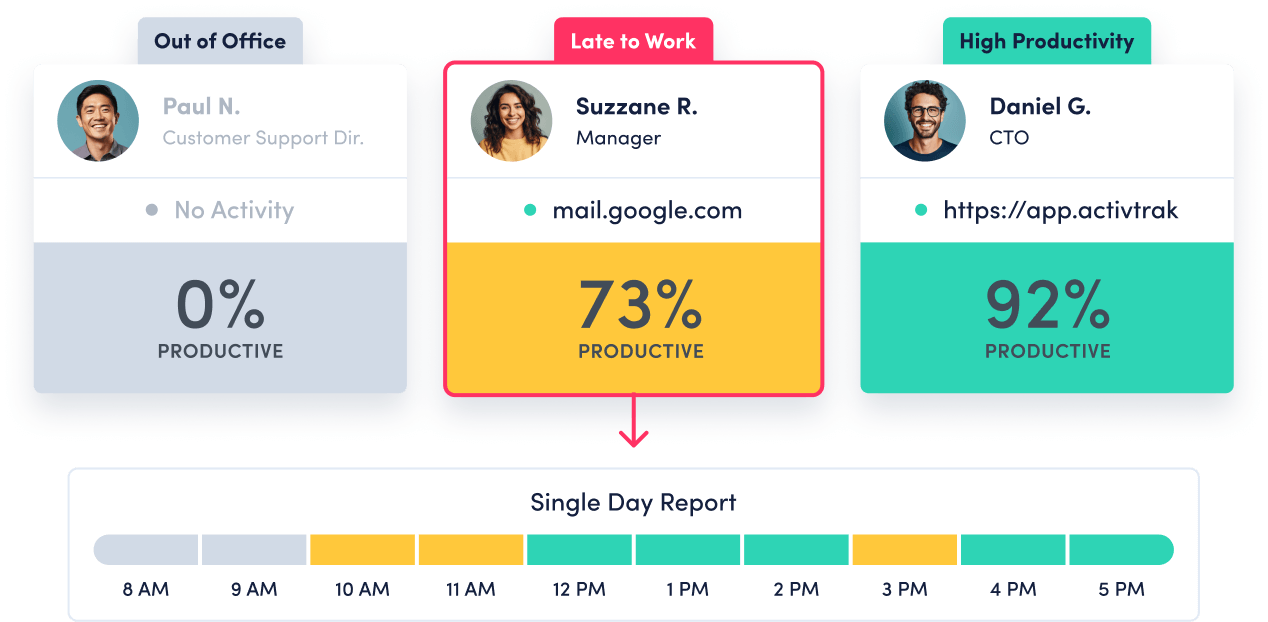
Employee Monitoring
Employee Monitoring
Get real-time visibility into team activity and productivity levels.
Time Tracking & Auditing
Time Tracking & Auditing
Get detailed insight into employee work hours and locations, with time categorized as productive, unproductive or undefined.
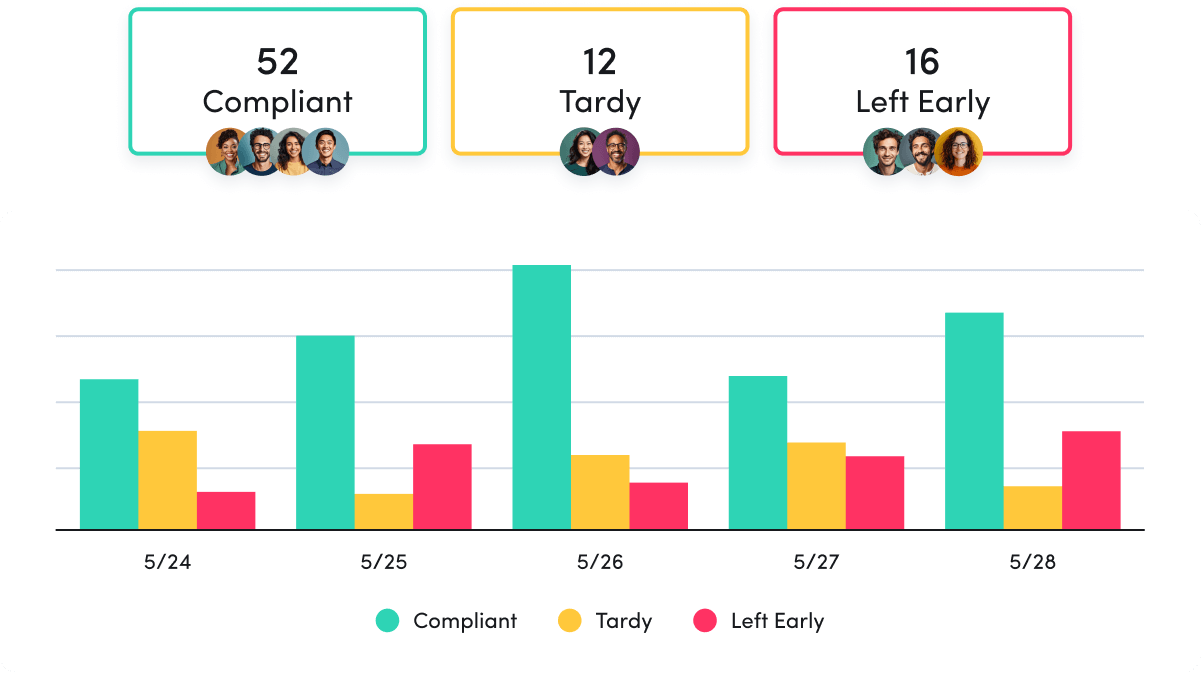
Schedule & Policy Adherence
Schedule & Policy Adherence
Monitor late starts, early departures and extended breaks in real time.
Contractor Billing Reconciliation
Contractor Billing Reconciliation
Confirm contractor hours billed match hours worked.
Productivity Optimization
Productivity Management
Productivity Management
Make data-driven decisions to fuel productivity across teams and individuals.

Performance Optimization & Coaching
Performance Optimization & Coaching
Leverage AI-powered insights to understand and optimize team performance.
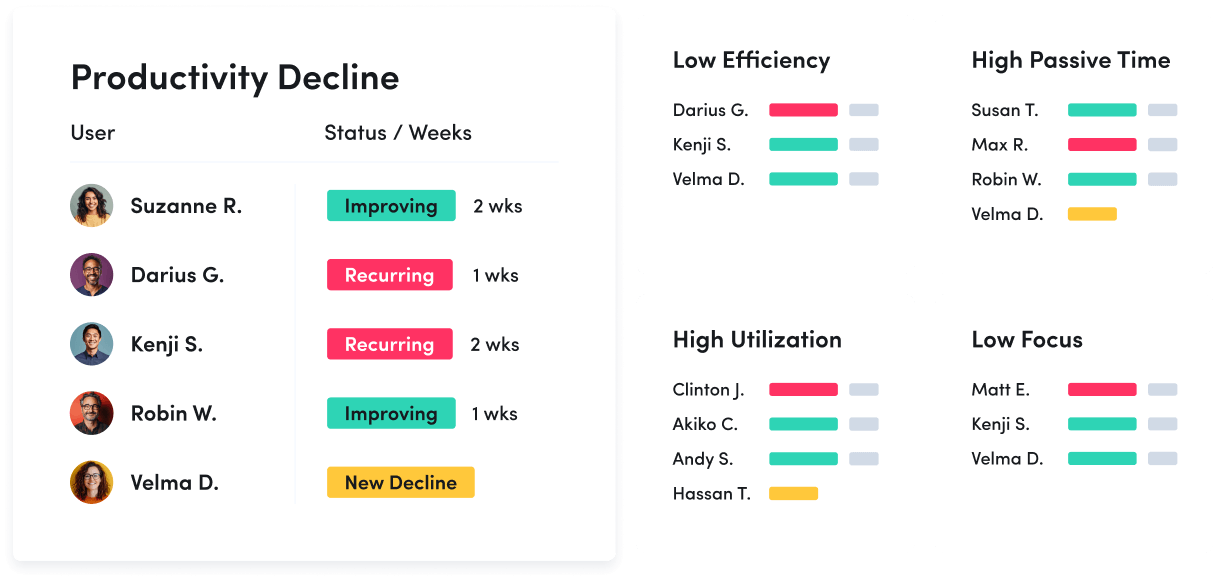
Employee Engagement & Burnout
Employee Engagement & Burnout
Assess employee utilization to detect burnout and balance workloads.
Workforce Planning
Workforce Optimization & Cost Savings
Workforce Optimization & Cost Savings
Uncover hidden inefficiences to cut costs and boost profitability.

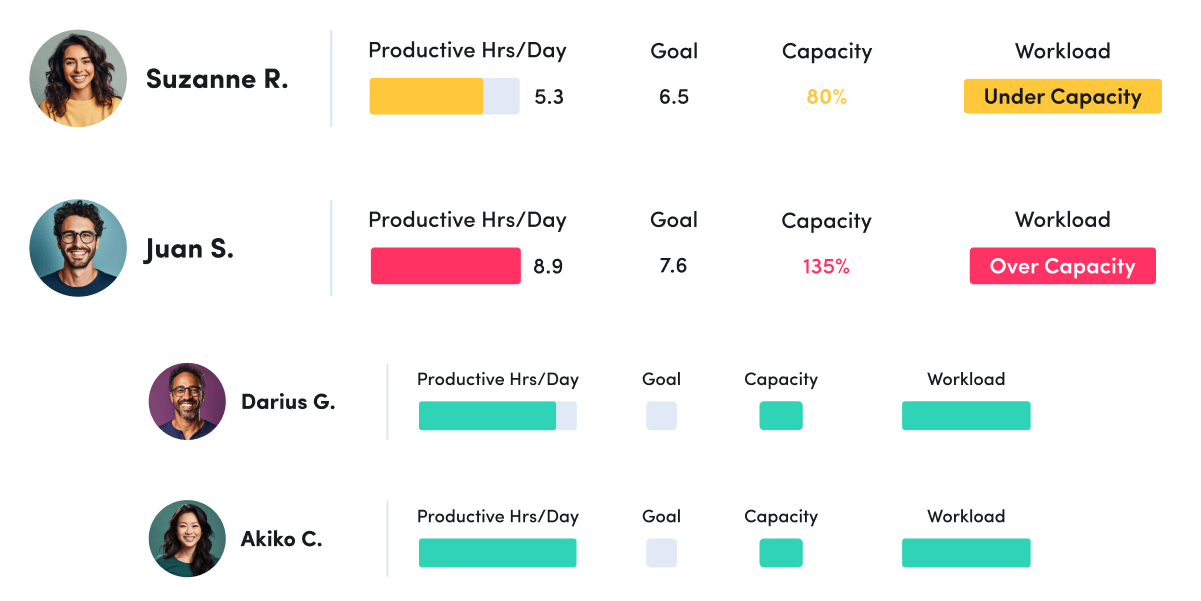
Capacity & Headcount Planning
Capacity & Headcount Planning
Analyze workload capacity to allocate resources and identify staffing needs.
Technology Optimization
Technology Optimization
Track technology usage to identify unused licenses and cut unnecessary costs.
Office Space Planning
Office Space Planning
Right-size real estate investments with insight into office space utilization.
Remote Workforce Management
Track employee productivity by work location to guide workplace policy decisions.
Employee Monitoring
Get real-time visibility into team activity and productivity levels.
Time Tracking & Auditing
Get detailed insight into employee work hours and locations, with time categorized as productive, unproductive or undefined.
Schedule & Policy Adherence
Monitor late starts, early departures and extended breaks in real time.
Contractor Billing Reconciliation
Confirm contractor hours billed match hours worked.
Productivity Management
Make data-driven decisions to fuel productivity across teams and individuals.
Performance Optimization & Coaching
Leverage AI-powered insights to understand and optimize team performance.
Employee Engagement & Burnout
Assess employee utilization to detect burnout and balance workloads.
Workforce Optimization & Cost Savings
Uncover hidden inefficiences to cut costs and boost profitability.
Capacity & Headcount Planning
Analyze workload capacity to allocate resources and identify staffing needs.
Technology Optimization
Track technology usage to identify unused licenses and cut unnecessary costs.
Office Space Planning
Right-size real estate investments with insight into office space utilization.
ActivTrak fits your stack
Get deeper insights, integrate with any app.
Saleforce

Microsoft Teams
Slack
ServiceNow
Zendesk
Zoom
Microsoft Viva
Lattice
Qualtrics XM
Jira Software
Workday
ADP
Culture Amp
Asana
How it works

Collect
Use the ActivTrak Agent to gather digital activity data about how employees work while safeguarding employee privacy.

Analyze
Assess productivity drivers, engagement levels and work habits through intuitive dashboards and AI-powered reports.

Optimize
Use ActivTrak Coach to improve productivity, performance and resource utilization for organizational health and well-being.
See what customers say about ActivTrak
Powered by![]()
Getting started is easy. Be up and running in minutes.
Workforce planning software FAQs and use cases
What is Workforce Planning?
Workforce planning is a process of determining the present and future needs of an organization’s workforce to reach business goals. It involves assessing existing staffing resources against projected needs, costs, and objectives. This helps to create an action plan, to understand what skills, resources, and training are needed.
The first step in workforce planning is to identify ideal roles within the organization. Then planning can proceed with the focus on the number of employees required for each role. By considering the current employee population, potential hiring needs, and new or expected processes and technology tools, an accurate plan can be made.
Once the plan is in place, it is important to monitor and review it regularly. This will help to ensure that the plan is up to date and that any changes in the organization’s goals or objectives are taken into account. Additionally, it is important to ensure that the plan is communicated to all relevant stakeholders, so that everyone is aware of the plan and can work together to achieve the desired outcomes.
What is Strategic Workforce Planning?
Strategic workforce planning is a long-term process that organizations use to accurately assess current and future organizational needs in regards to people, skills, and resources to meet long-term goals. It should also include a flexible and responsive way of anticipating and reacting to future changes in the organization or in the external environment.
This type of planning involves the creation of a strategy that is continually updated regarding such aspects as competency requirements, desired job roles mix and profiles, and key performance indicators for each role. Strategic workforce planning has the potential to develop a well-structured plan to employ individuals who possess the skills needed to meet future organization goals.
The process of strategic workforce planning should involve a comprehensive analysis of the current workforce, including an assessment of the skills and competencies of each employee. This analysis should be used to identify any gaps in the current workforce and to develop strategies to fill those gaps. Additionally, the process should include an evaluation of the external environment to identify any potential changes that could impact the organization’s workforce needs.
Why is Workforce Planning Important?
Workforce planning assists organizations in managing their current and future workforce requirements, ensuring optimal use of resources. Conversely, failing to plan can compromise the effectiveness of an operation by having too little or too many workers in certain positions. Without thorough consideration given to both current and future personnel needs, valuable productivity can be affected as a result.
Organizations can also identify gaps in their talent pool, creating a blueprint to plug those gaps. By understanding what job roles may be needed in the future – and which skills will be required – organizations can develop strategies to ensure they have the right people in the right place when they are needed.
In addition, workforce planning can help organizations to identify potential areas of risk, such as skills shortages or over-reliance on certain individuals. This can help to ensure that organizations are prepared for any potential changes in the future, and can take steps to mitigate any risks.
What is the Goal When Workforce Planning?
When effective planning is used it can bring long-term benefits with regards to operational efficiency and operational performance. The ultimate goal of workforce planning is to ensure an optimal number of staff with appropriate skillsets that meet organizational objectives.
Workforce planning software is a key asset for many organizations, connecting people planning with broader business objectives. This modern technology offers organizations a platform for forecasting future needs by taking into account all possible situations and scenarios, enabling employers to make informed decisions about their future workforce.
By using workforce planning software, organizations can also identify potential skills gaps and plan for the necessary training and development of their employees. This helps to ensure that the organization has the right people with the right skills in the right place at the right time, allowing them to remain competitive in the market.
How Can Analytics Improve Workforce Planning?
Analytics solutions can enhance workforce planning by turning historically disconnected signals (like work hours, meetings and tools used) into a cohesive picture of capacity, utilization and demand. This helps leaders rebalance workloads and time hiring/freeze decisions with confidence. Workforce analytics software like ActivTrak enables teams to quantify capacity across both individuals and teams, identifying overload and idle time. Predictive analytics can also blend historical patterns with real-time employee data to forecast future trends and risks, enhancing your strategic workforce planning.
What Workforce Planning Features Does ActivTrak Offer?
ActivTrak provides a variety of cutting-edge and insightful workforce planning features, such as:
- Capacity & Headcount Planning: Assess workload distribution to identify underutilized and overworked employees in order to make informed decisions
- Schedule Adherence Reports: Track schedule compliance to detect when employees have a late start, early end or deviation from assigned schedules
- Technology Usage Planning: Understand tool and application usage to identify unused or duplicate tools and optimize costs
- Impact Analysis: Monitor the effects of changes like new technology, flexible schedules or one time events like a change in leadership or reduction in force