Timesheet reconciliation. To prevent payroll errors and excess labor costs.
Trusted by 9,500+ global brands and organizations
TIMESHEET RECONCILIATION
Accurate, automated timesheet validation and anomaly detection
Eliminate hours of manual review each pay period to ensure accuracy, prevent fraud and stay audit-ready — all while preventing millions in annual overpayments.
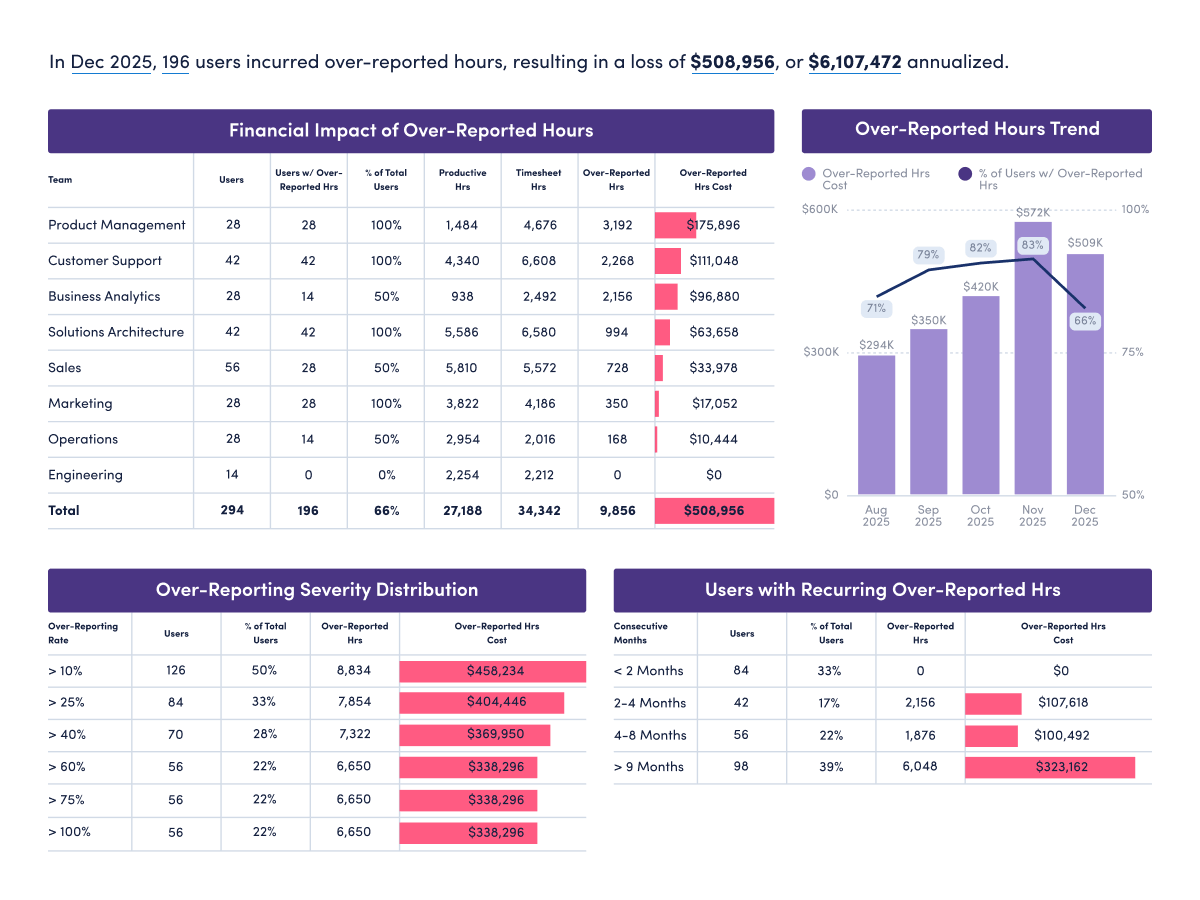
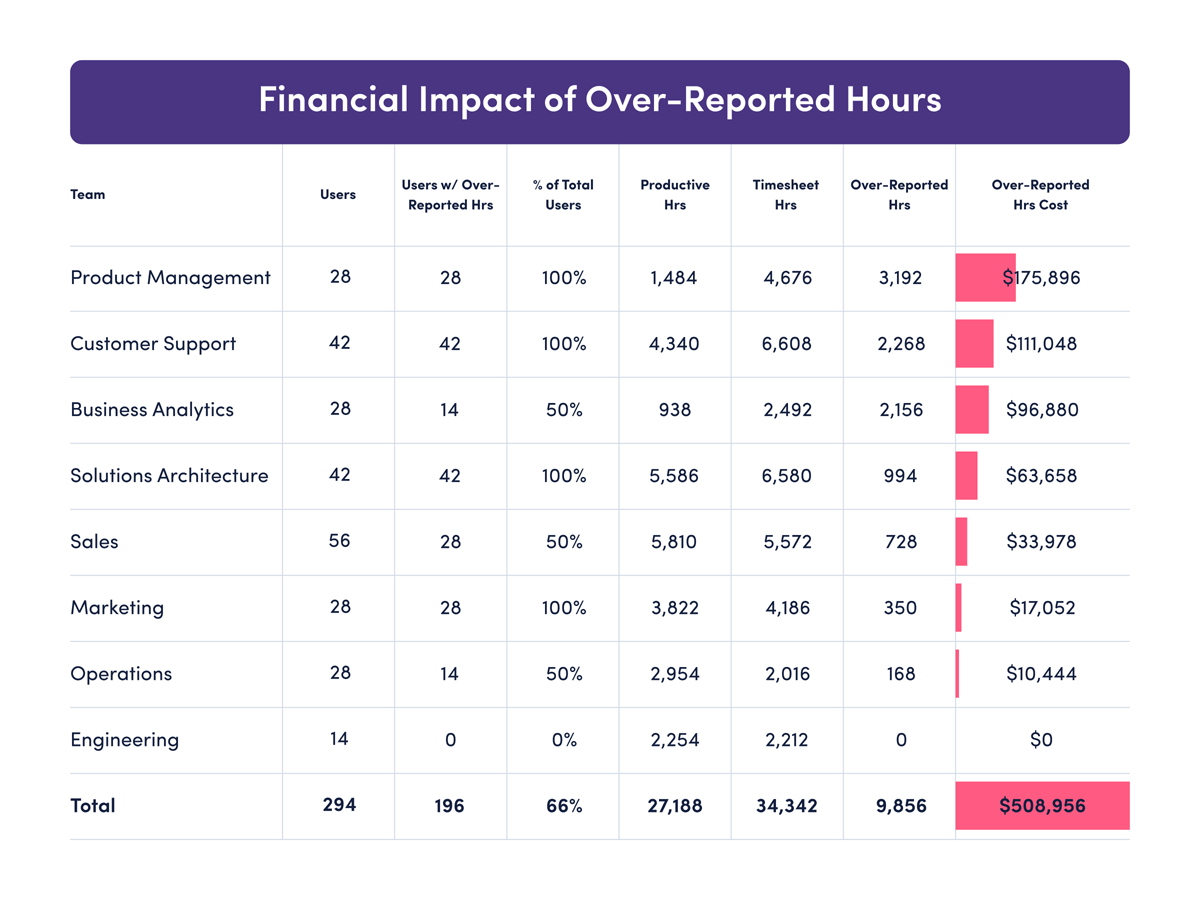
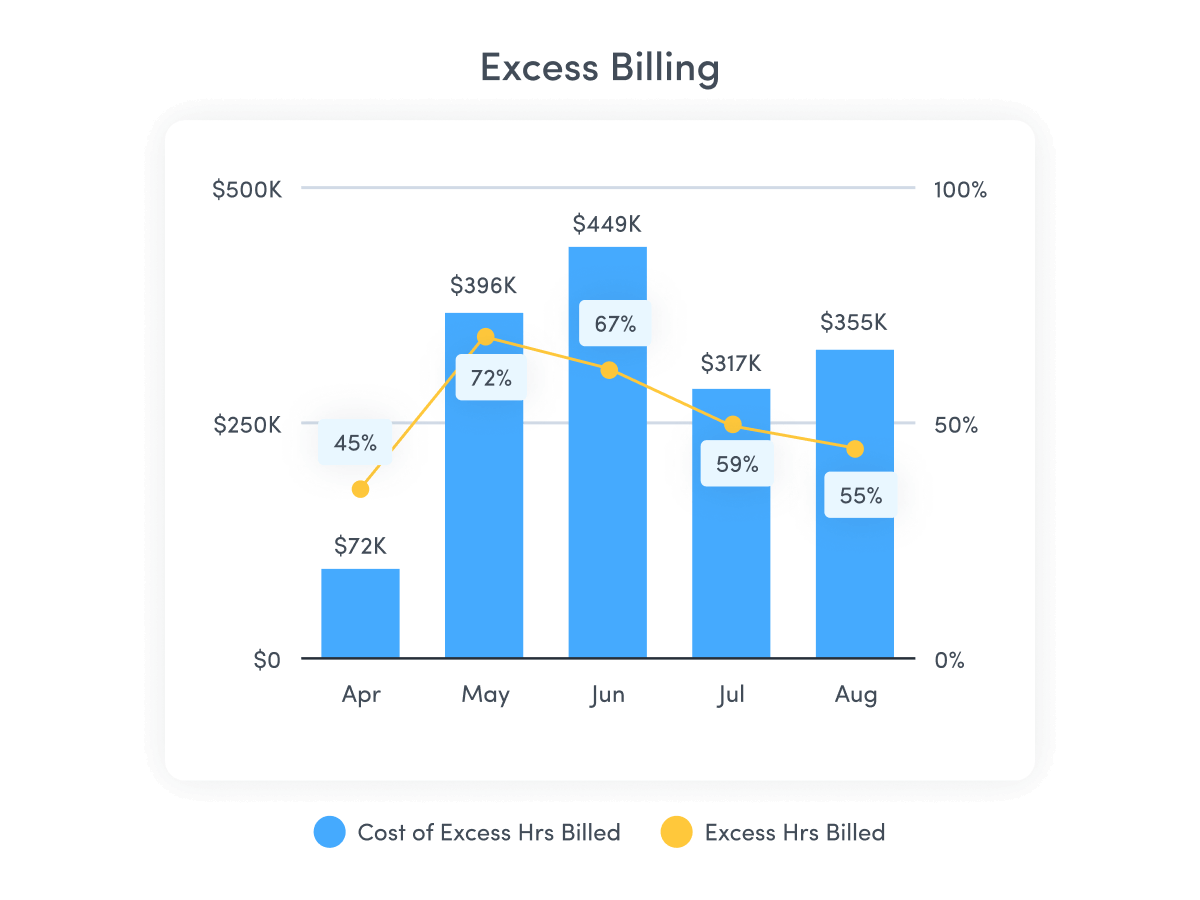
PAYROLL COST RECOVERY
Identify timesheet errors before payroll runs
- See the exact dollar impact of over-reported hours each month
- Avoid overpayments and the awkward process of reclaiming funds
- Distinguish between isolated errors and systemic issues that require policy changes
COMPLIANCE AUDITING
Prevent timesheet overbilling with concrete data
- Verify employee-reported hours using objective productivity data
- Distinguish honest mistakes from intentional misreporting
- Spot repeat offenders who regularly over-report hours
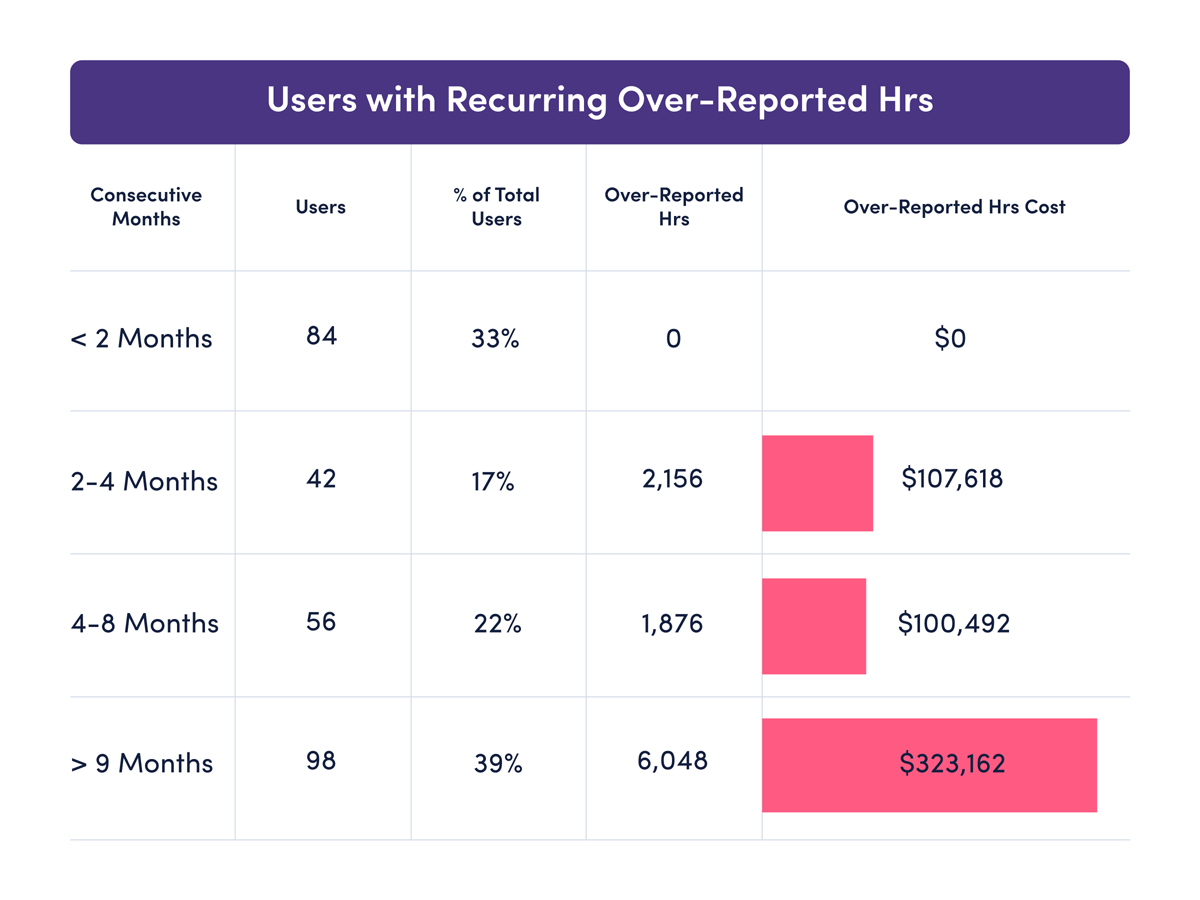
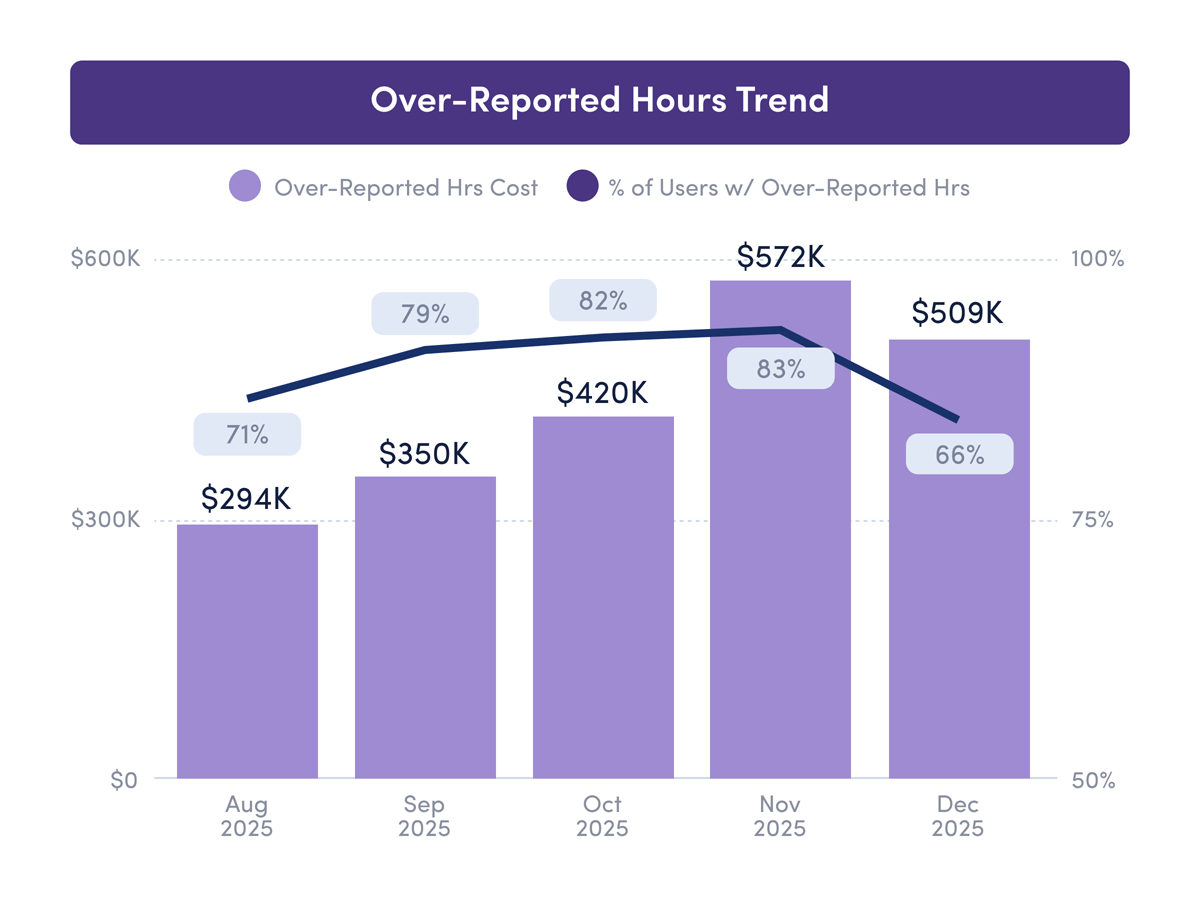
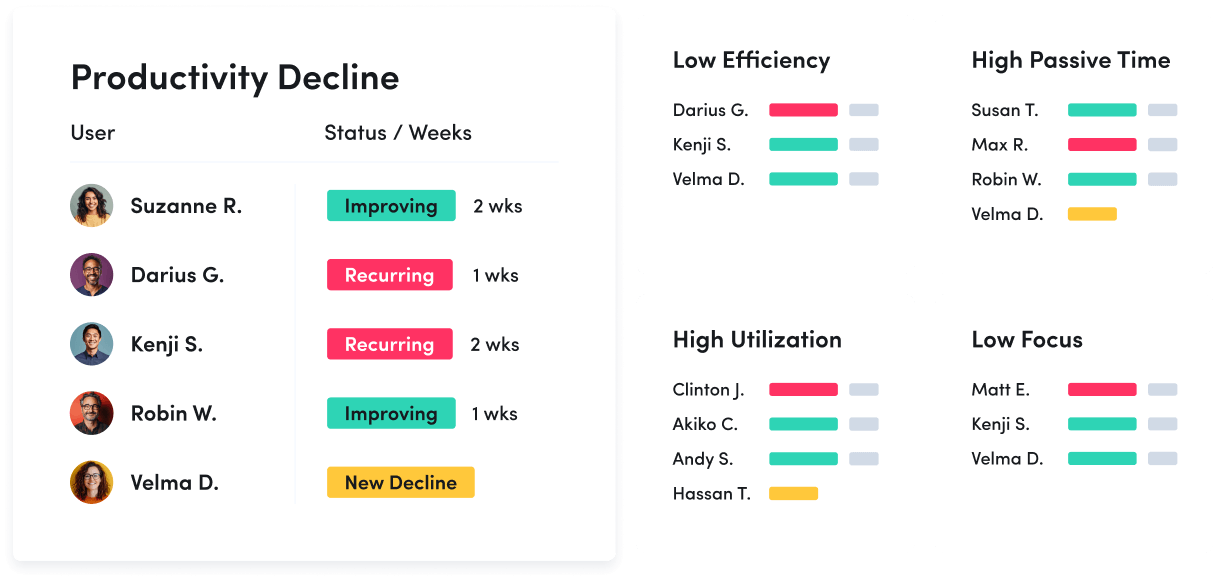
OVER-REPORTING TRENDS
Track inflated timesheet patterns
- Spot recurring trends tied to busy periods, project deadlines or billing cycles that may require interventions
- Track whether coaching conversations, policy changes or training initiatives improve accuracy over time
- Let HR and finance know when it’s time to investigate an unusually high number of inflated timesheets
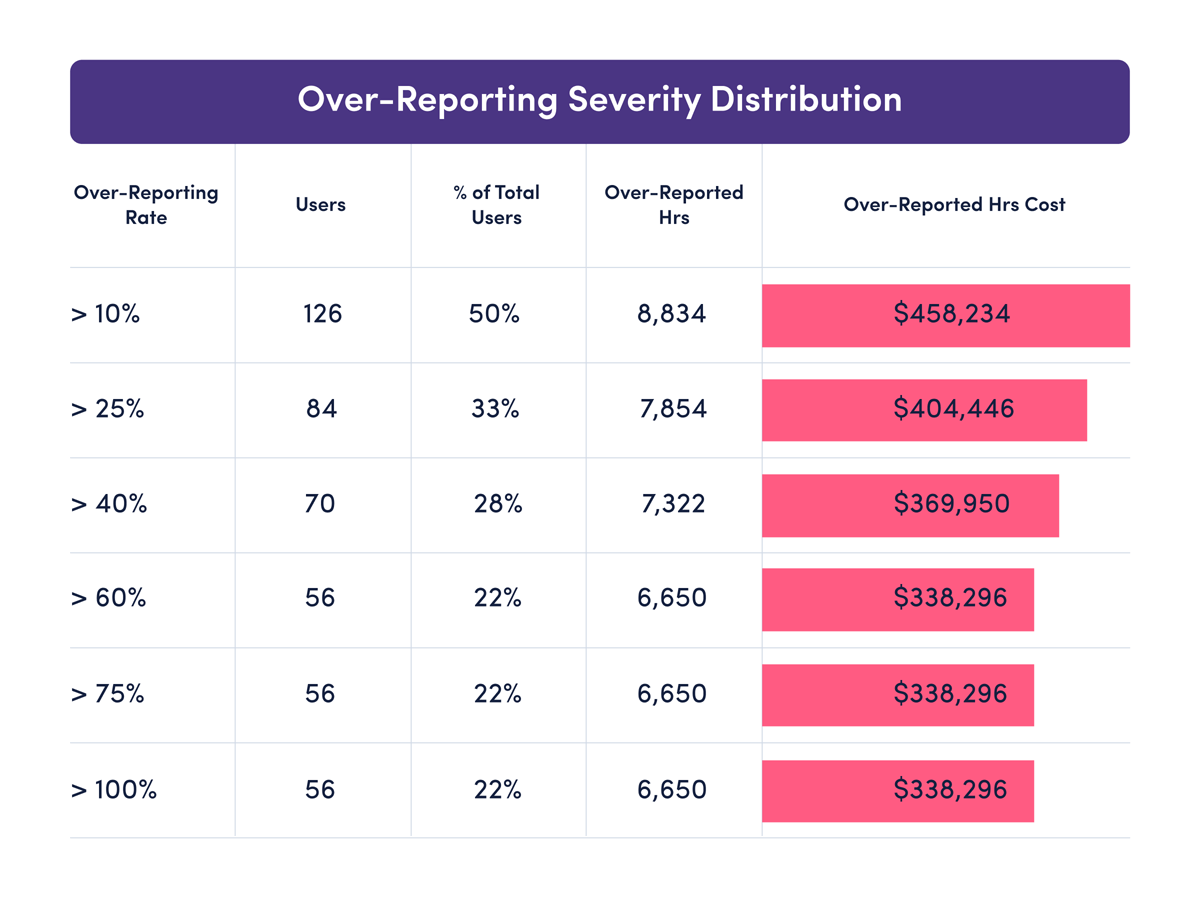
OVER-REPORTING SEVERITY
Decide how and when to respond
- Quickly identify when over-reported hours create financial risk and require immediate action
- Separate minor inconsistencies from significant violations to right-size investigations
- Apply appropriate interventions based on severity, from automated reminders to formal reviews
What are ActivTrak’s key features?
ActivTrak is the most comprehensive workforce analytics solution, with robust features to address your employee monitoring, productivity management and workforce planning needs. Make data-driven decisions to quickly optimize performance and boost productivity.
Workforce Management
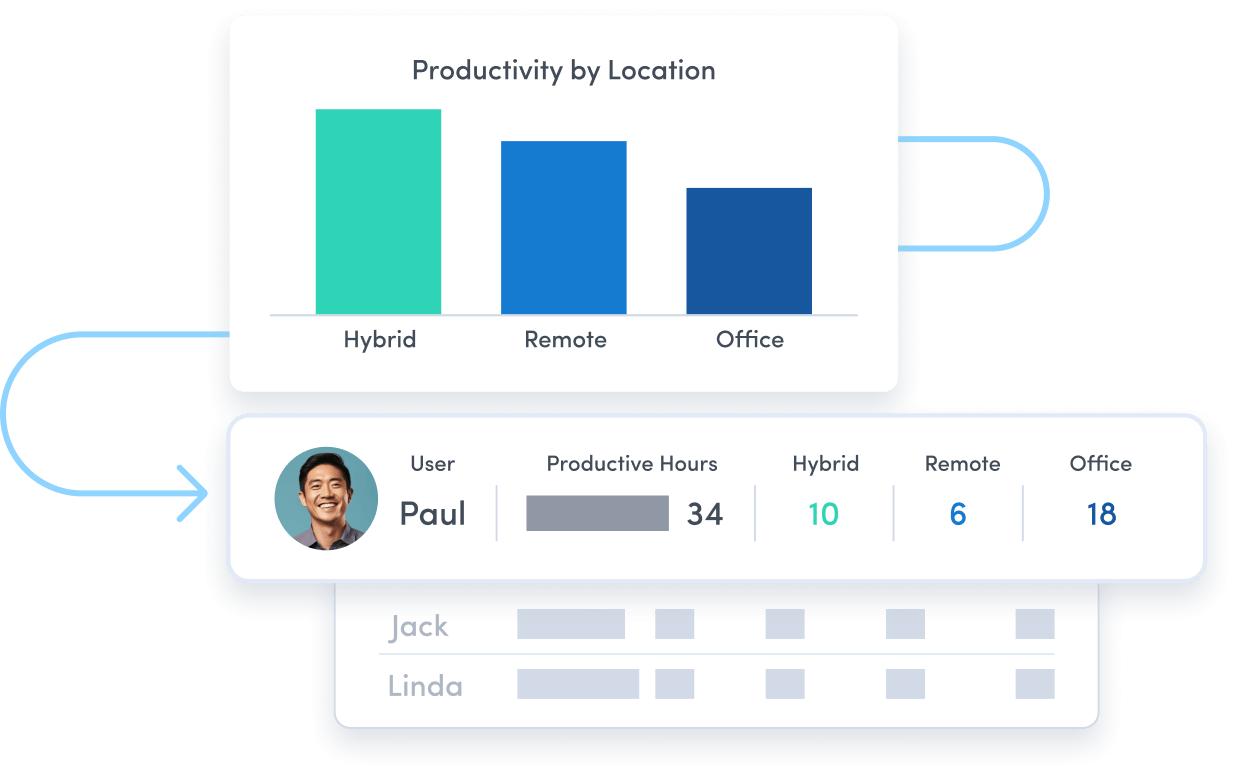
Remote Workforce Management
Remote Workforce Management
Track employee productivity by work location to guide workplace policy decisions.
Employee Monitoring
Employee Monitoring
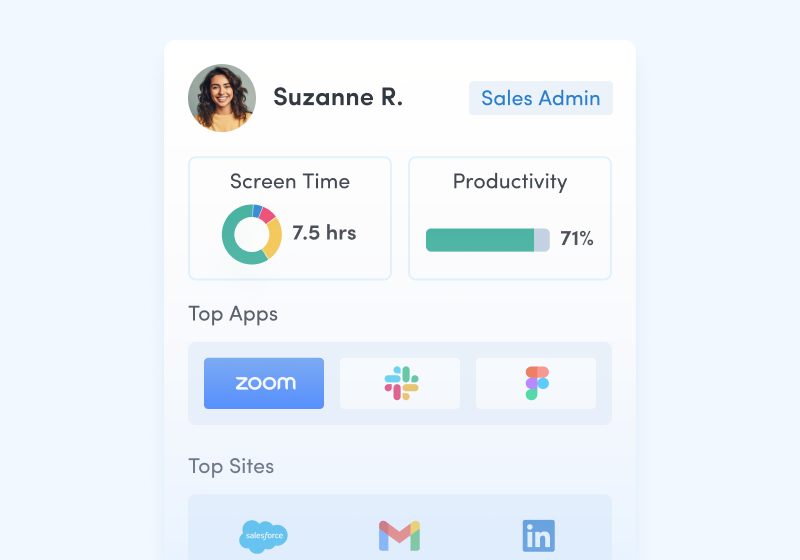
Get real-time visibility into team activity and productivity levels.
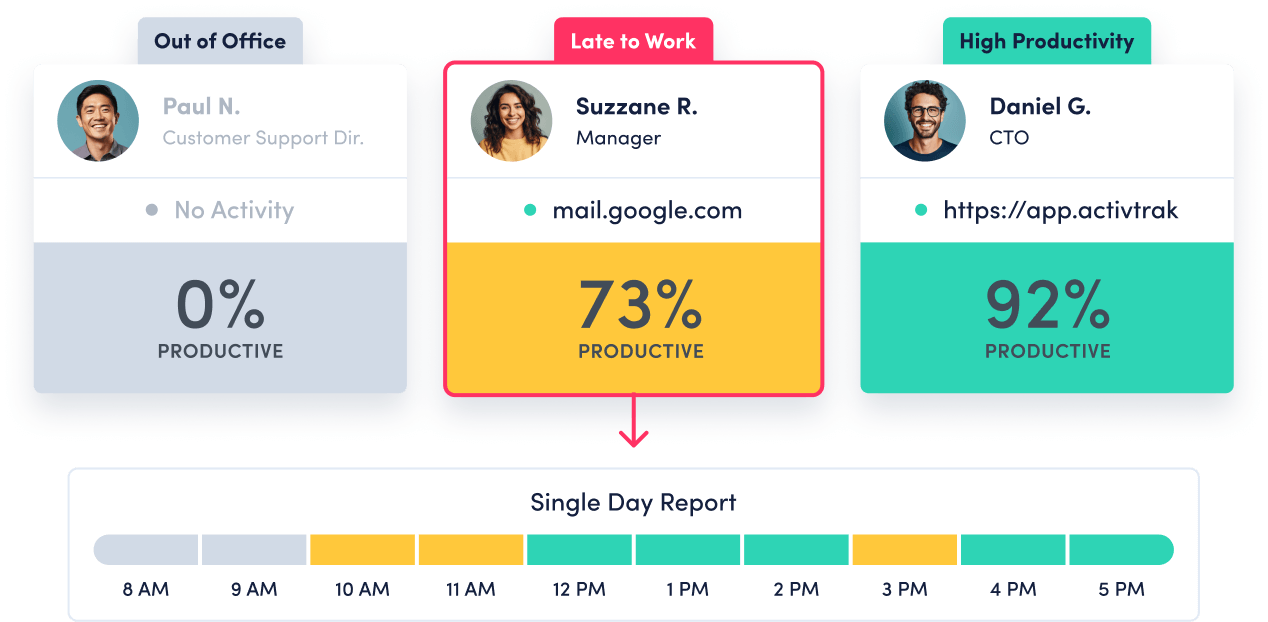
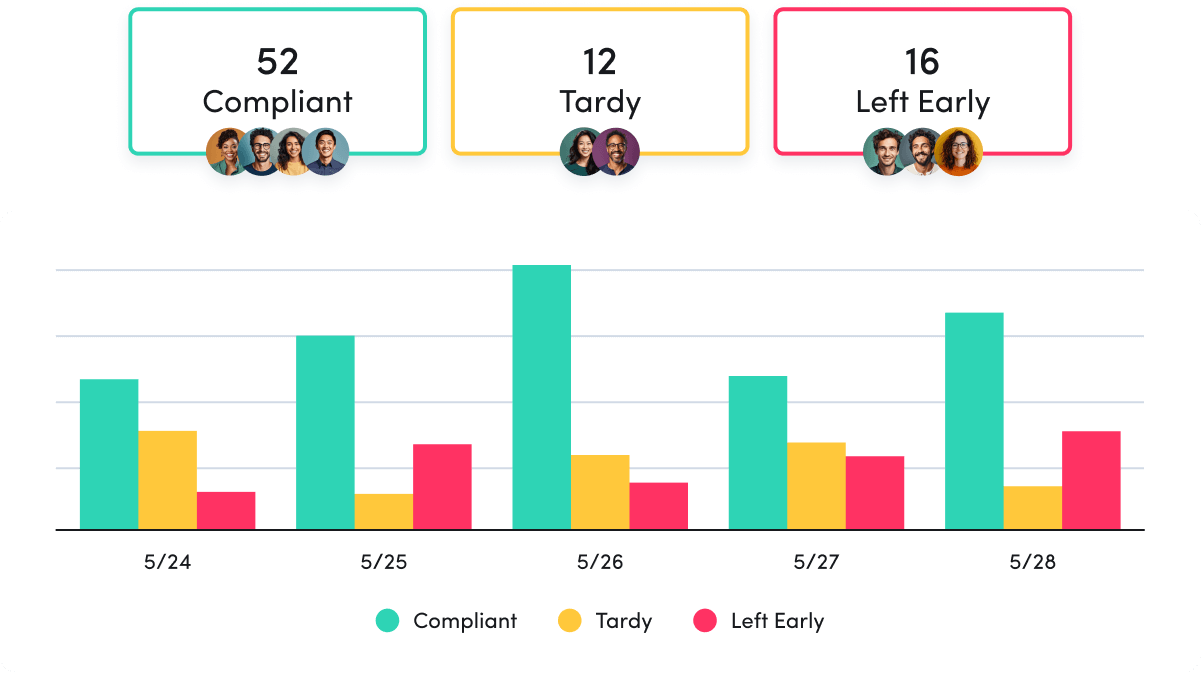
Schedule & Policy Adherence
Schedule & Policy Adherence
Monitor late starts, early departures and extended breaks in real time.
Contractor Billing Reconciliation
Contractor Billing Reconciliation
Confirm contractor hours billed match hours worked.
Timesheet Reconciliation
Timesheet Reconciliation
Automatically verify reported hours against actual work activity to catch errors and prevent overpayments.
Productivity Optimization
Productivity Management
Productivity Management
Make data-driven decisions to fuel productivity across teams and individuals.

Performance Optimization & Coaching
Performance Optimization & Coaching
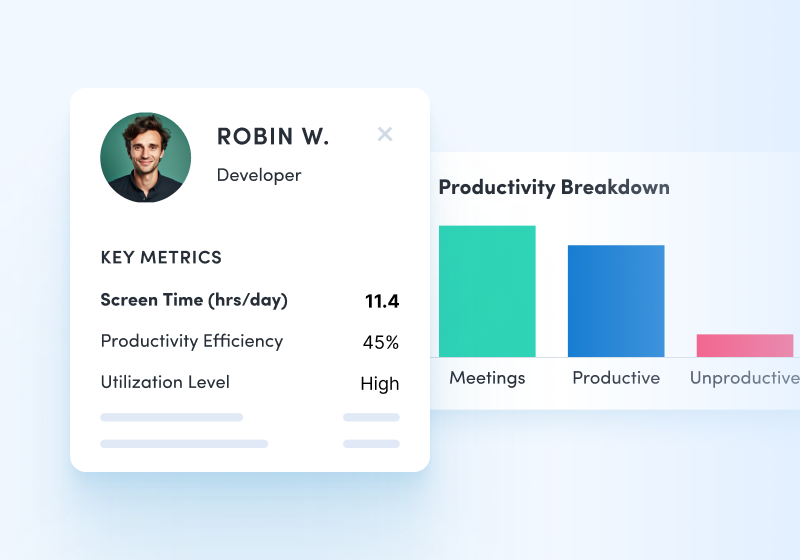
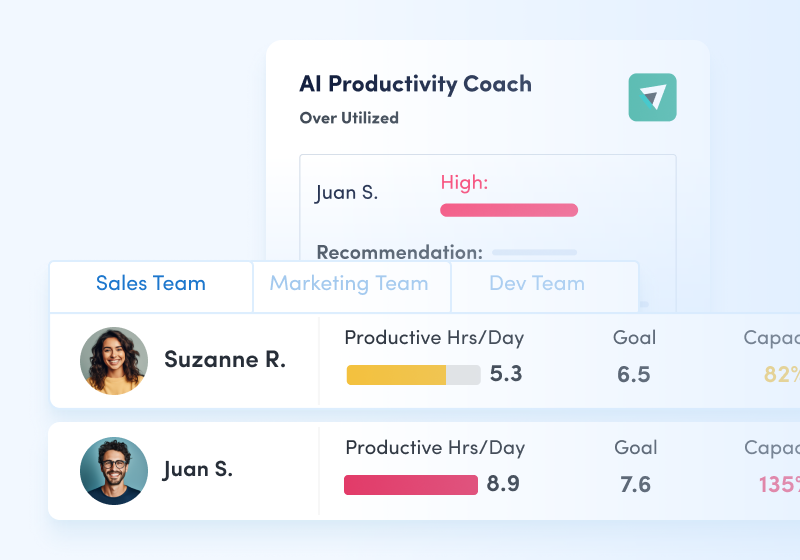
Leverage AI-powered insights to understand and optimize team performance.
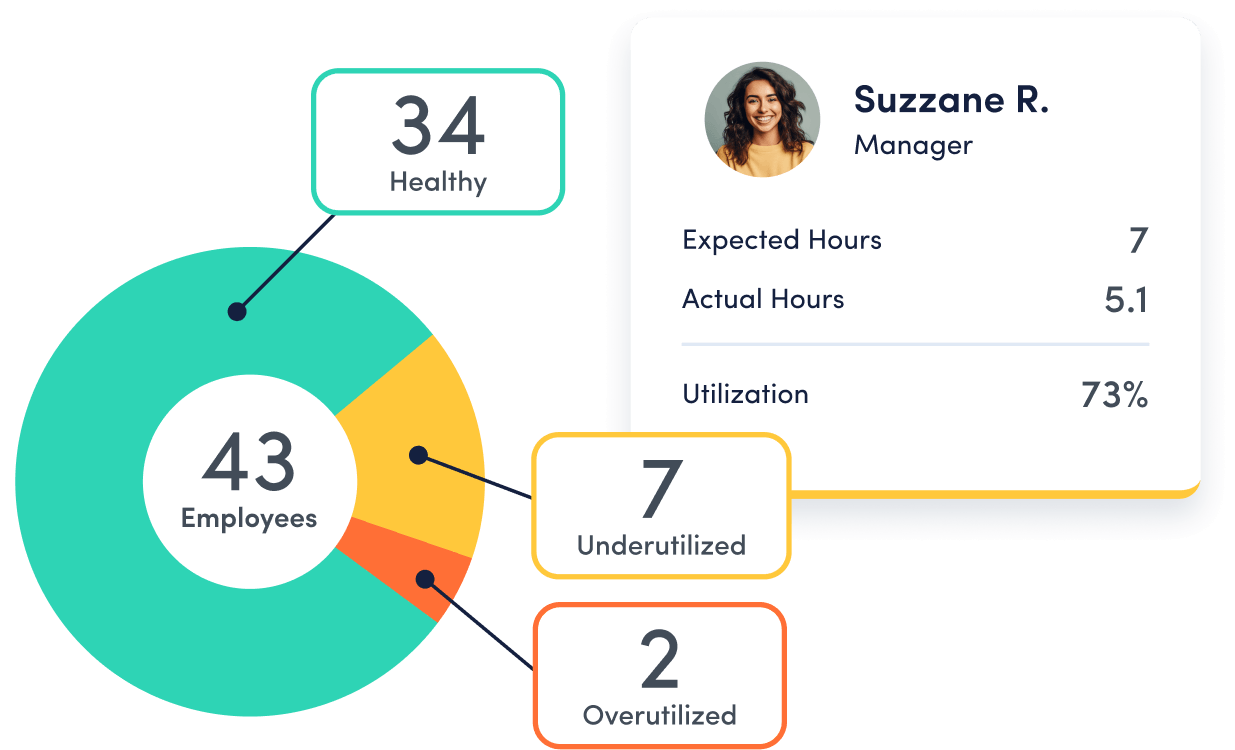
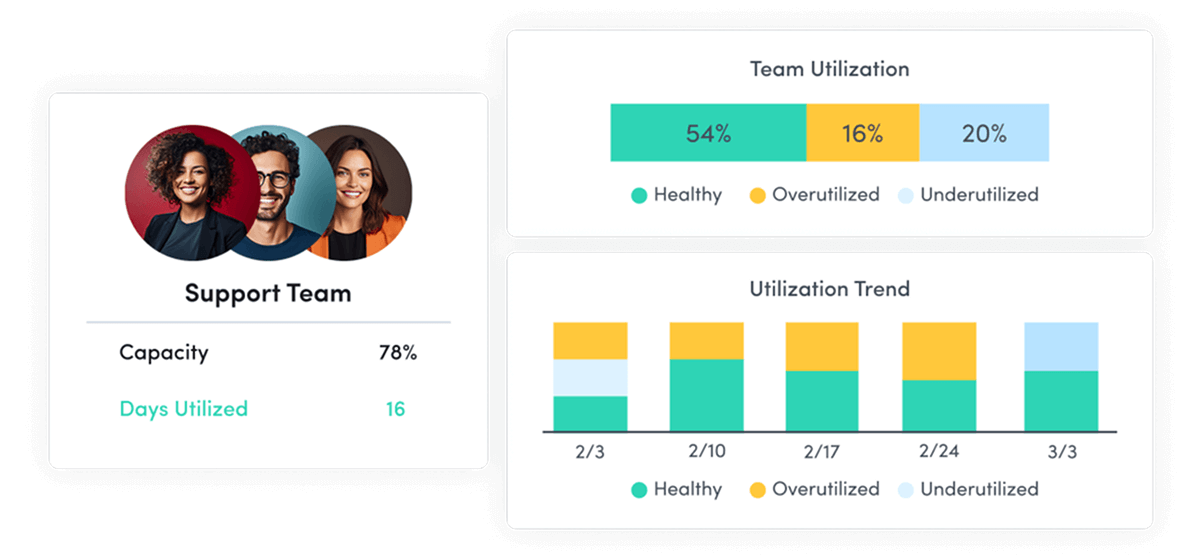
Employee Engagement & Burnout
Employee Engagement & Burnout
Assess employee utilization to detect burnout and balance workloads.
Workforce Planning
Workforce Optimization & Cost Savings
Workforce Optimization & Cost Savings
Uncover hidden inefficiencies to cut costs and boost profitability.
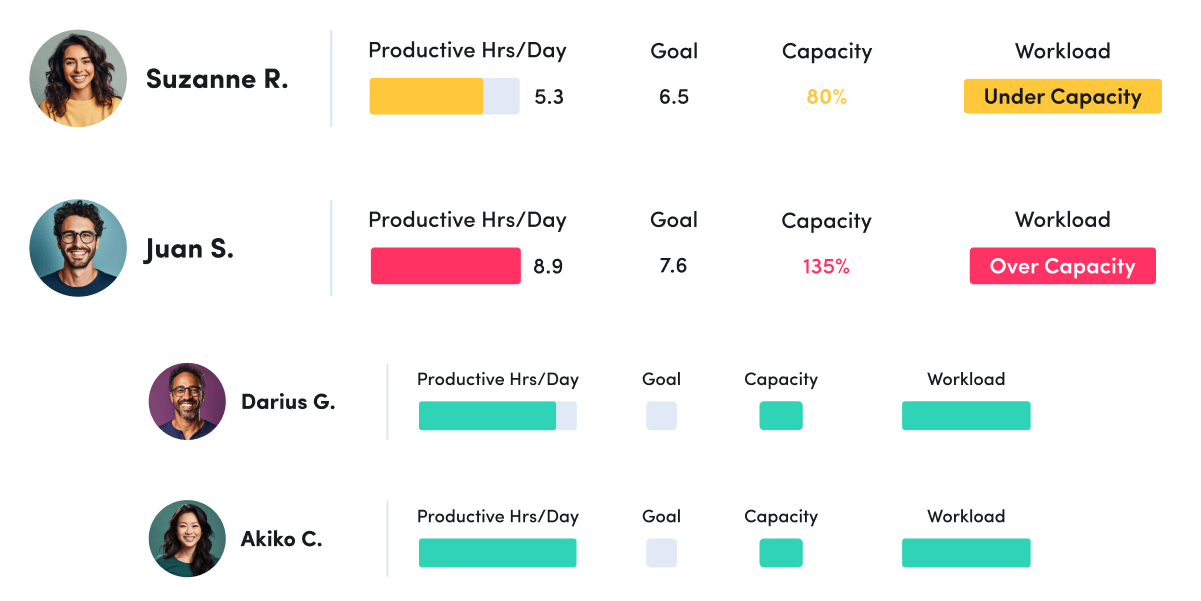
Capacity & Headcount Planning
Capacity & Headcount Planning
Analyze workload capacity to allocate resources and identify staffing needs.
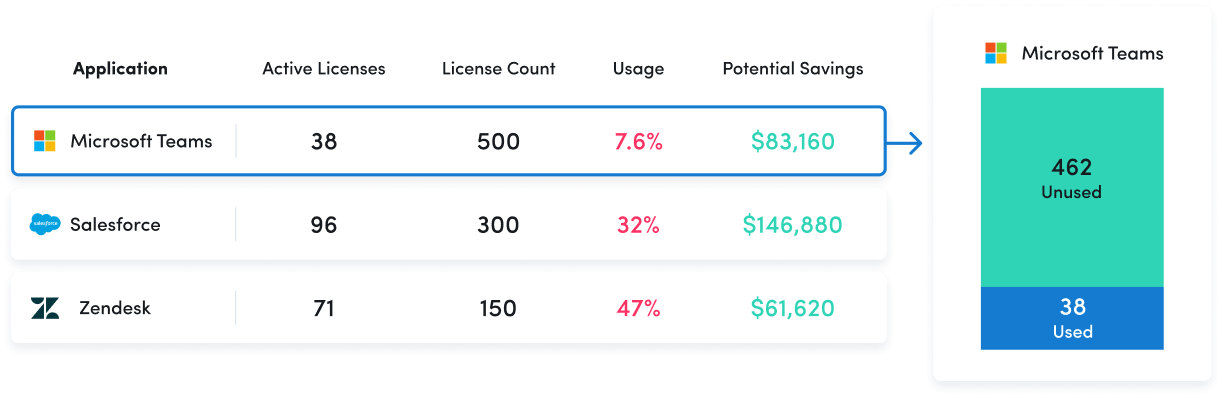
Technology Optimization
Technology Optimization
Track technology usage to identify unused licenses and cut unnecessary costs.
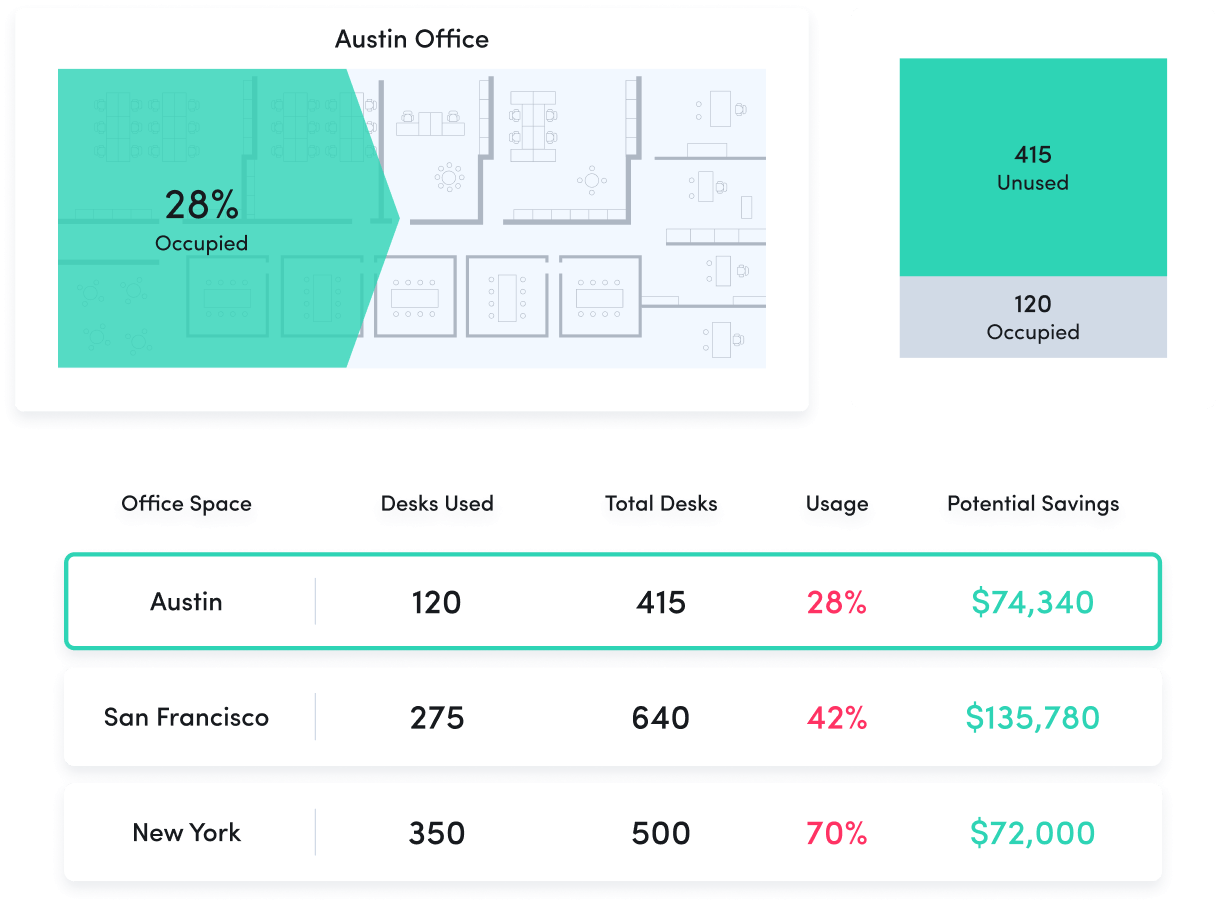
Office Space Planning
Office Space Planning
Right-size real estate investments with insight into office space utilization.
Remote Workforce Management
Track employee productivity by work location to guide workplace policy decisions.
Employee Monitoring
Get real-time visibility into team activity and productivity levels.
Schedule & Policy Adherence
Monitor late starts, early departures and extended breaks in real time.
Contractor Billing Reconciliation
Confirm contractor hours billed match hours worked.
Timesheet Reconciliation
Automatically verify reported hours against actual work activity to catch errors and prevent overpayments.
Productivity Management
Make data-driven decisions to fuel productivity across teams and individuals.
Performance Optimization & Coaching
Leverage AI-powered insights to understand and optimize team performance.
Employee Engagement & Burnout
Assess employee utilization to detect burnout and balance workloads.
Workforce Optimization & Cost Savings
Uncover hidden inefficiencies to cut costs and boost profitability.
Capacity & Headcount Planning
Analyze workload capacity to allocate resources and identify staffing needs.
Technology Optimization
Track technology usage to identify unused licenses and cut unnecessary costs.
Office Space Planning
Right-size real estate investments with insight into office space utilization.
ActivTrak fits your stack
Get deeper insights, integrate with any app.
Saleforce

Microsoft Teams
Slack
ServiceNow
Zendesk
Zoom
Microsoft Viva
Lattice
Qualtrics XM
Jira Software
Workday
ADP
Culture Amp
Asana
How it works
Capture employee activity
Capture employee activity including hours worked, schedule adherence, location policy compliance and app & website usage.
Analyze productivity trends
Analyze productivity trends on employee focus, engagement and utilization to make data-informed decisions on resource allocation.
Optimize team performance
Optimize team performance with benchmarks, goal-tracking and AI coaching recommendations to improve workforce productivity.
See what customers say about ActivTrak
Powered by![]()