Show Hide Topic Menu
- Employee Engagement & Experience
- How it Works
- Learn Why
- What Is Employee Engagement?
- Quantitative Employee Engagement Metrics
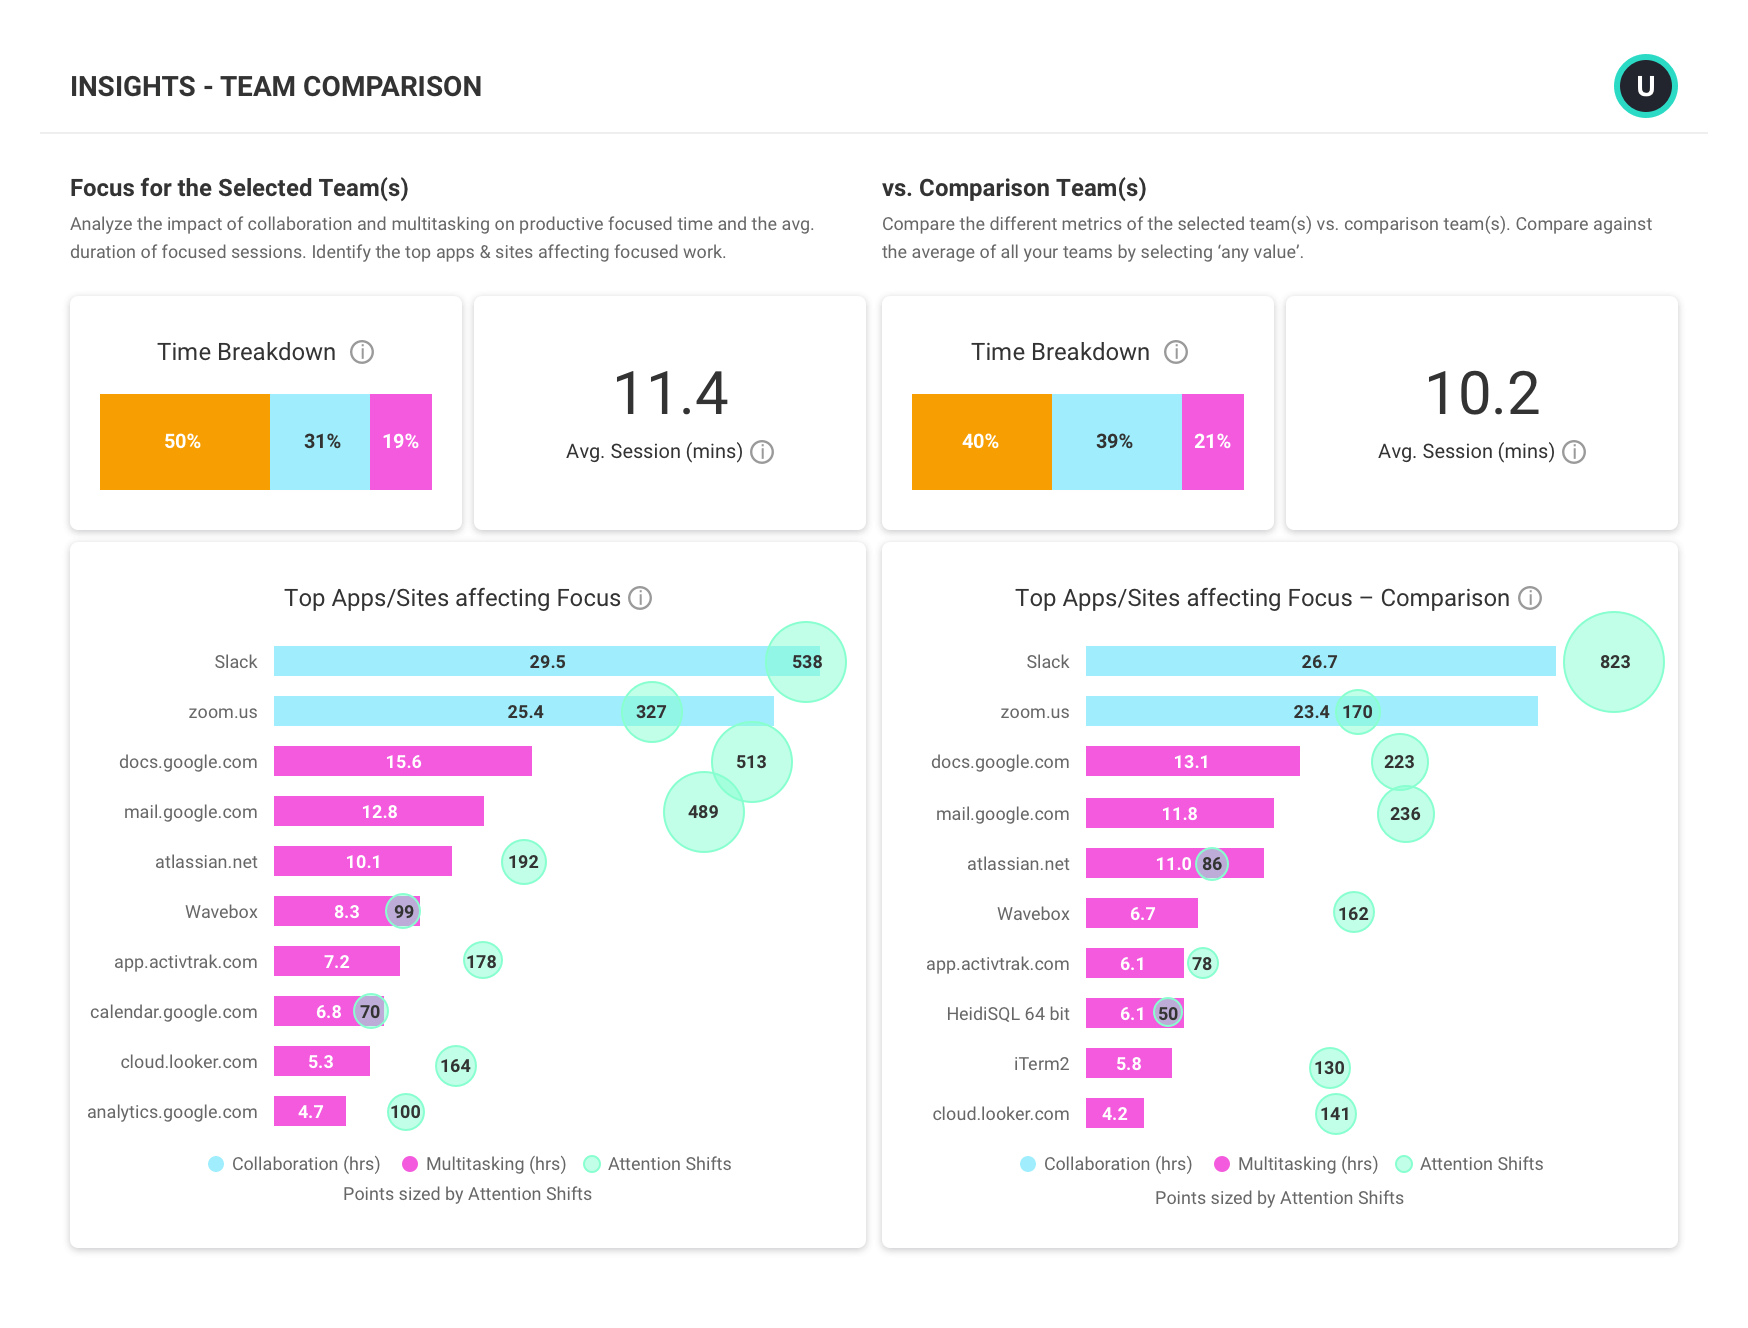
- How To Measure Employee Engagement in the Modern Workplace
- How To Manage Remote Employee Engagement
- The Importance of Improving Employee Wellbeing
- Remote Worker Employee Experience
- How To Boost Remote Team Engagement
- Employee Experience Management to Empower Workers
- Improving the Digital Employee Experience
- Employee Engagement Best Practices for Company Success
- What is Workforce Engagement Management (WEM)?
Employee Engagement & Burnout
Trusted by 9,500+ global brands and organizations
EMPLOYEE ENGAGEMENT & BURNOUT
Improve employee engagement & experience with personalized insights and coaching support
Employee engagement and experience are critical to retention and performance but can be difficult to measure objectively.
ActivTrak enhances feedback from HR surveys and sentiment analysis with objective data to provide a more complete picture of employee engagement and well-being.
- Proactively address burnout, quiet quitting, and disengagement by spotting early indicators
- Assess and optimize workload balance across teams
- Set team goals to motivate and drive improvement
- Empower employees to improve personal work habits and well-being
- Integrate employee activity data with other business data (surveys, PTO, etc.) for deeper insights

“[Our] team utilizes the insights and data from ActivTrak to drive better conversations between leadership and employees… and identify in advance potential burnout or change in behaviors. This tool also helps employees see how they might be more productive within their working hours to drive greater self awareness and their own self management. ”
– Executive in Human Resources
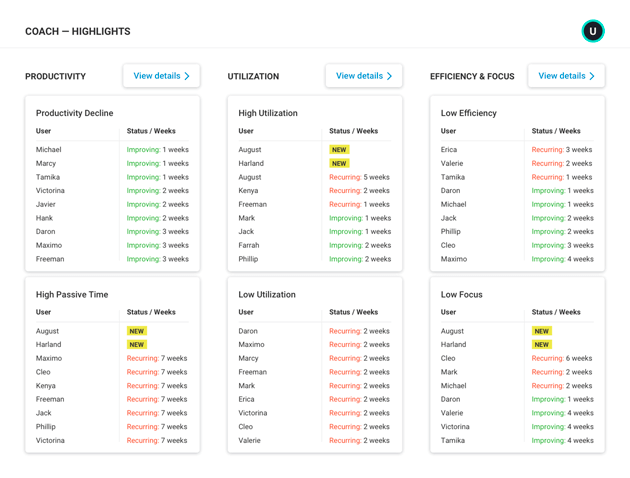
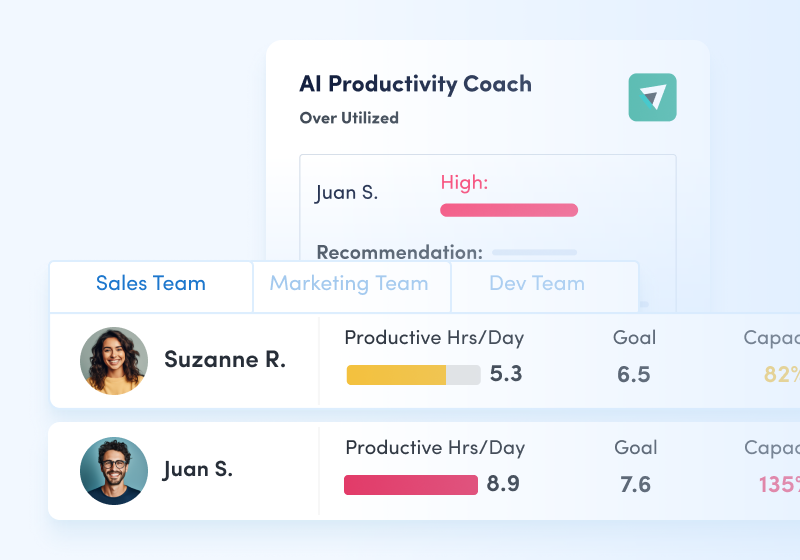
AI-POWERED COACHING
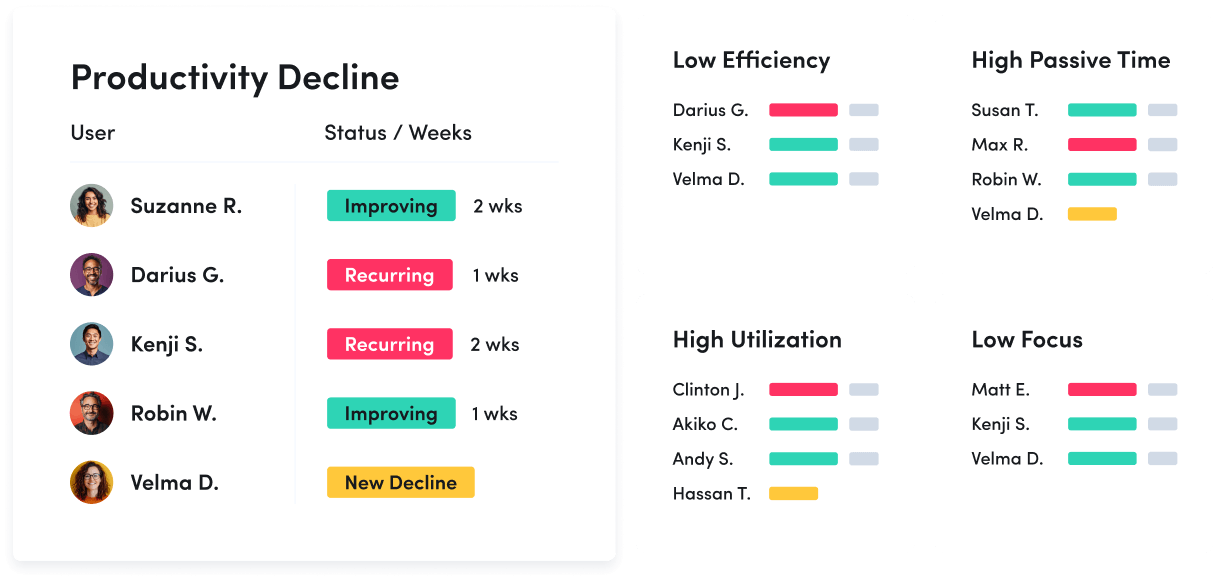
Proactively address burnout, quiet quitting, and disengagement by spotting early indicators
- Leverage AI-powered insights to surface patterns and provide tailored coaching advice
- Quickly intervene before signs of burnout or disengagement become larger performance issues
- Track the impact of coaching to identify areas that need additional improvement or support
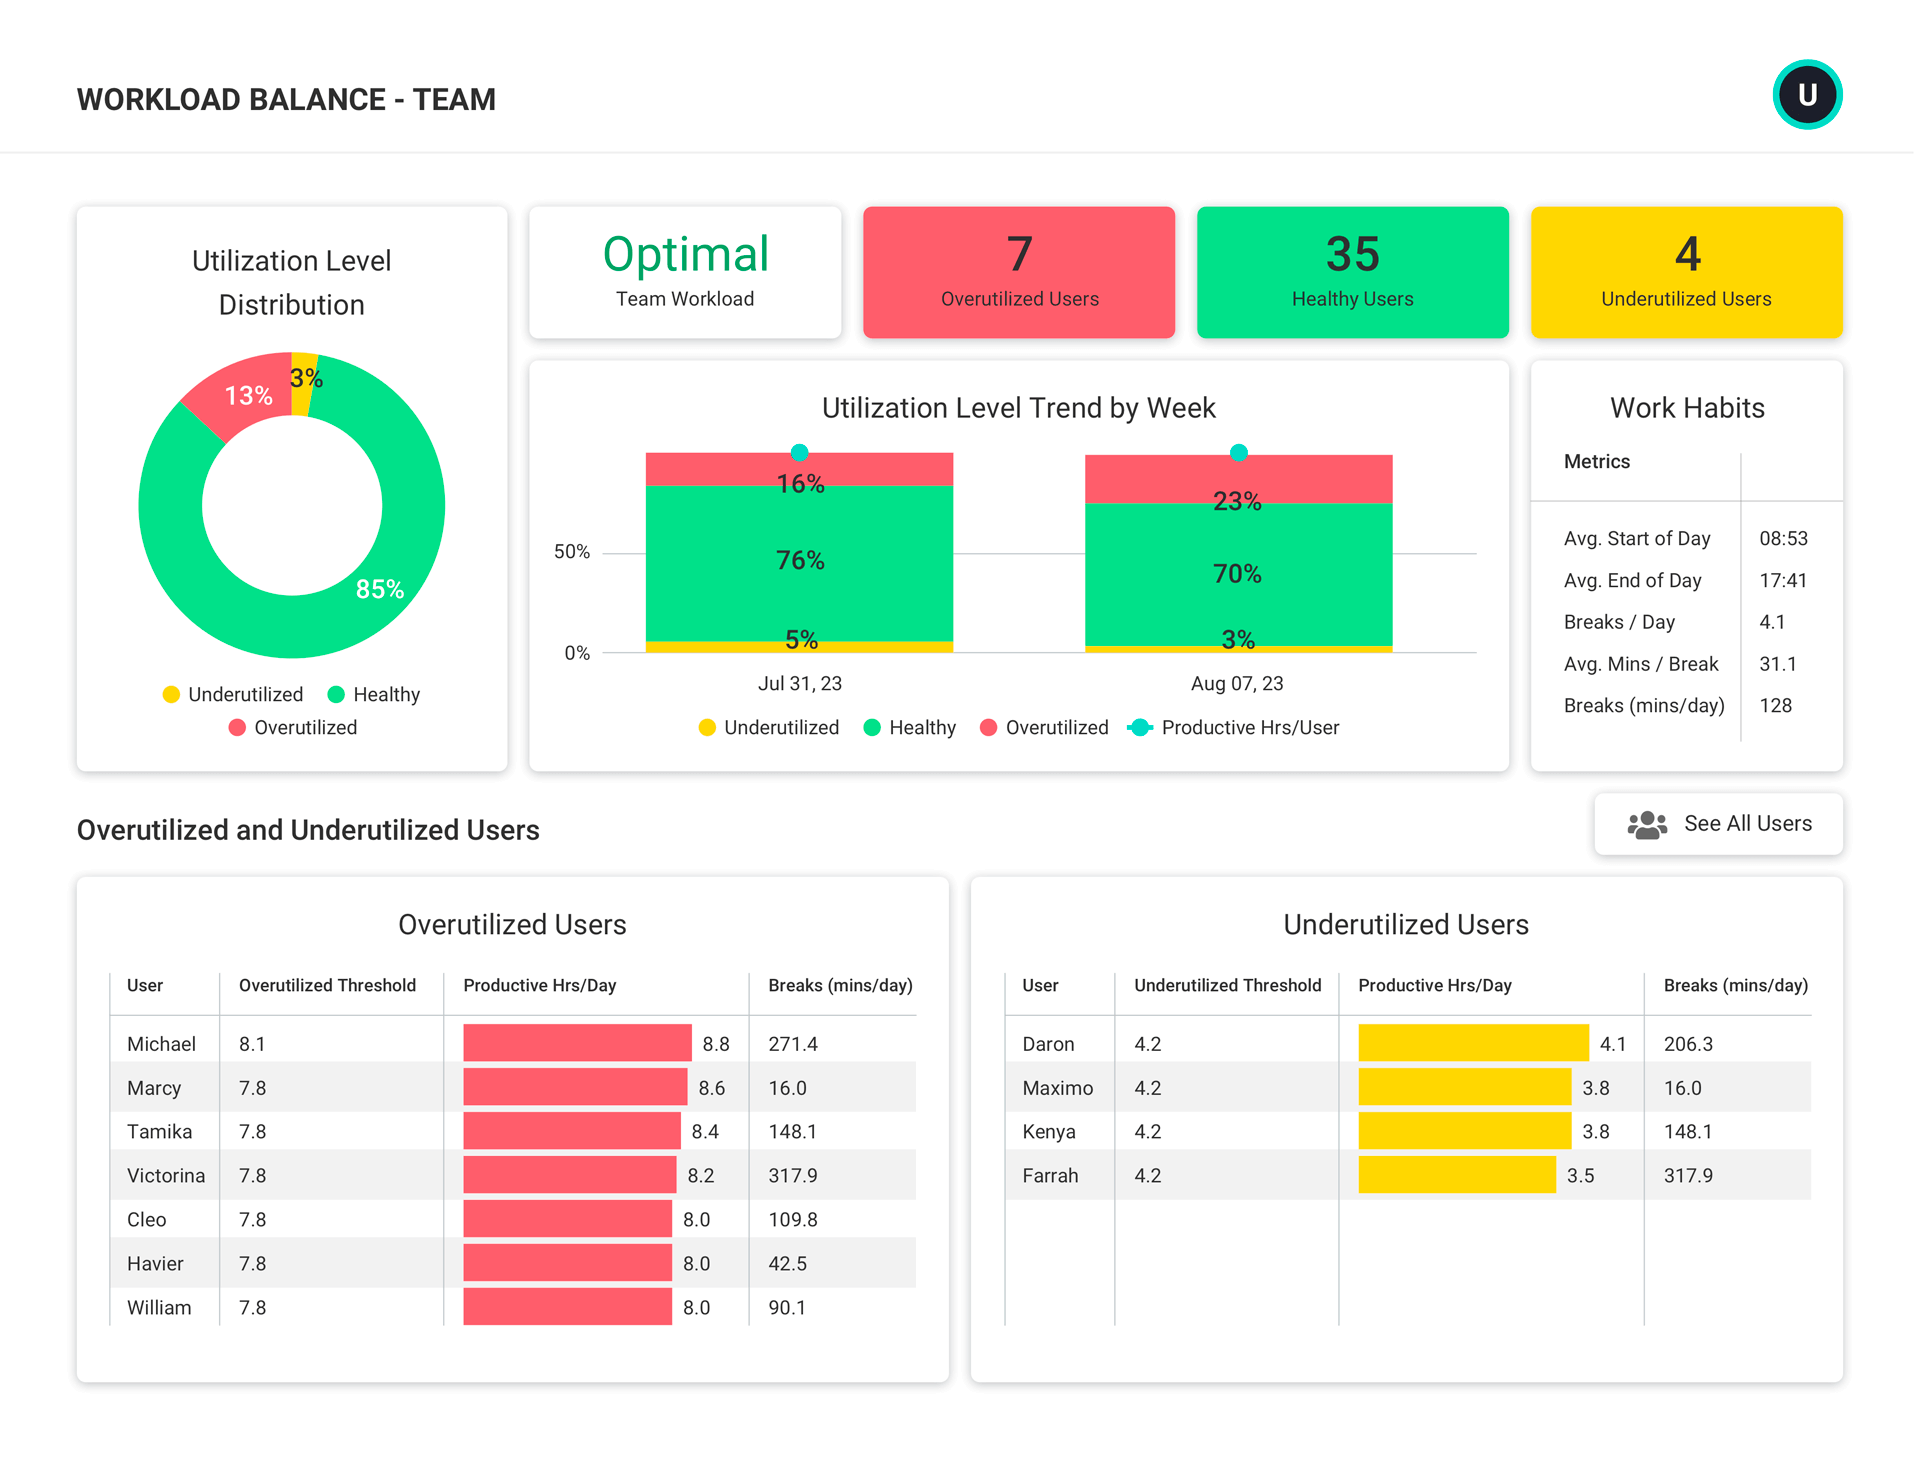
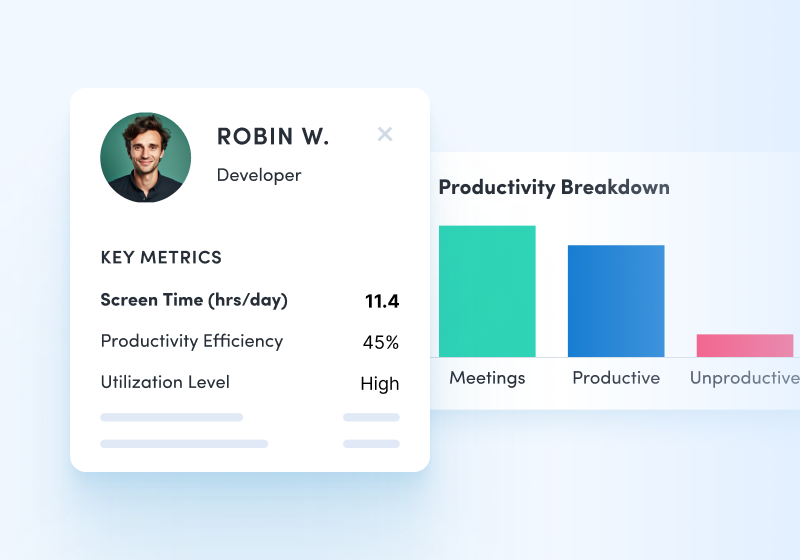
WORKLOAD BALANCE
Assess and optimize workload balance across teams
- Distribute work to prevent burnout and re-engage quiet quitters or under-utilized employees
- Make data-driven decisions about headcount and resourcing needs based on team capacity
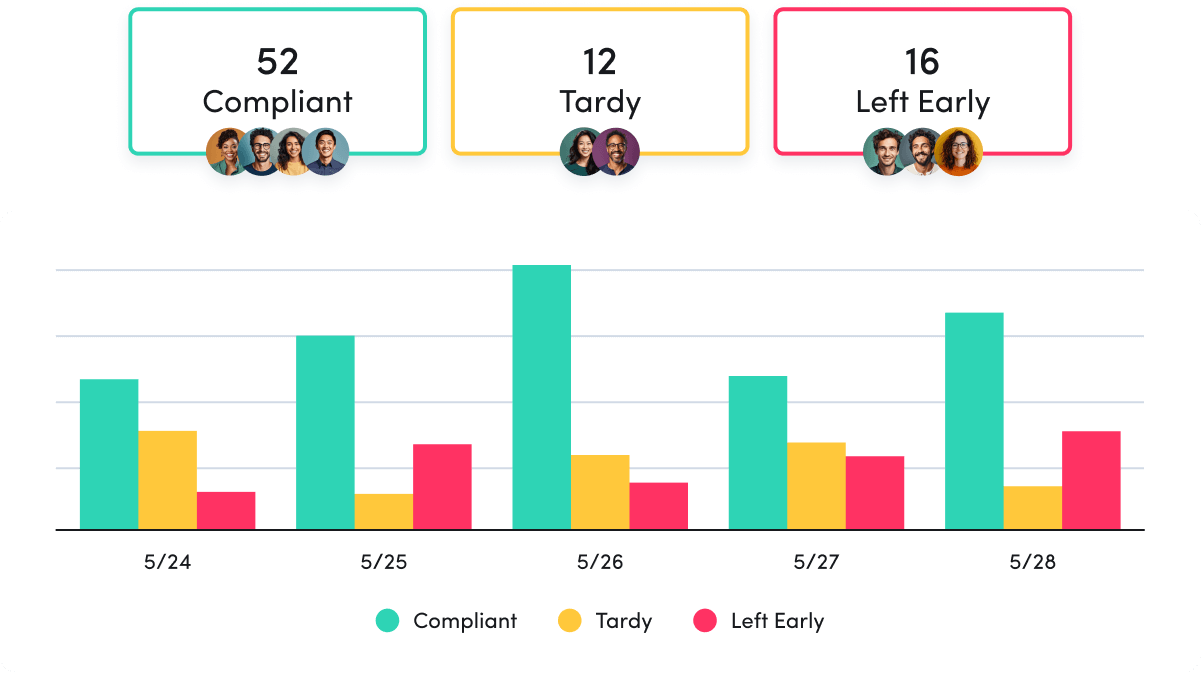
- Determine if remote work contributes to higher burnout by comparing remote and in-office employee utilization
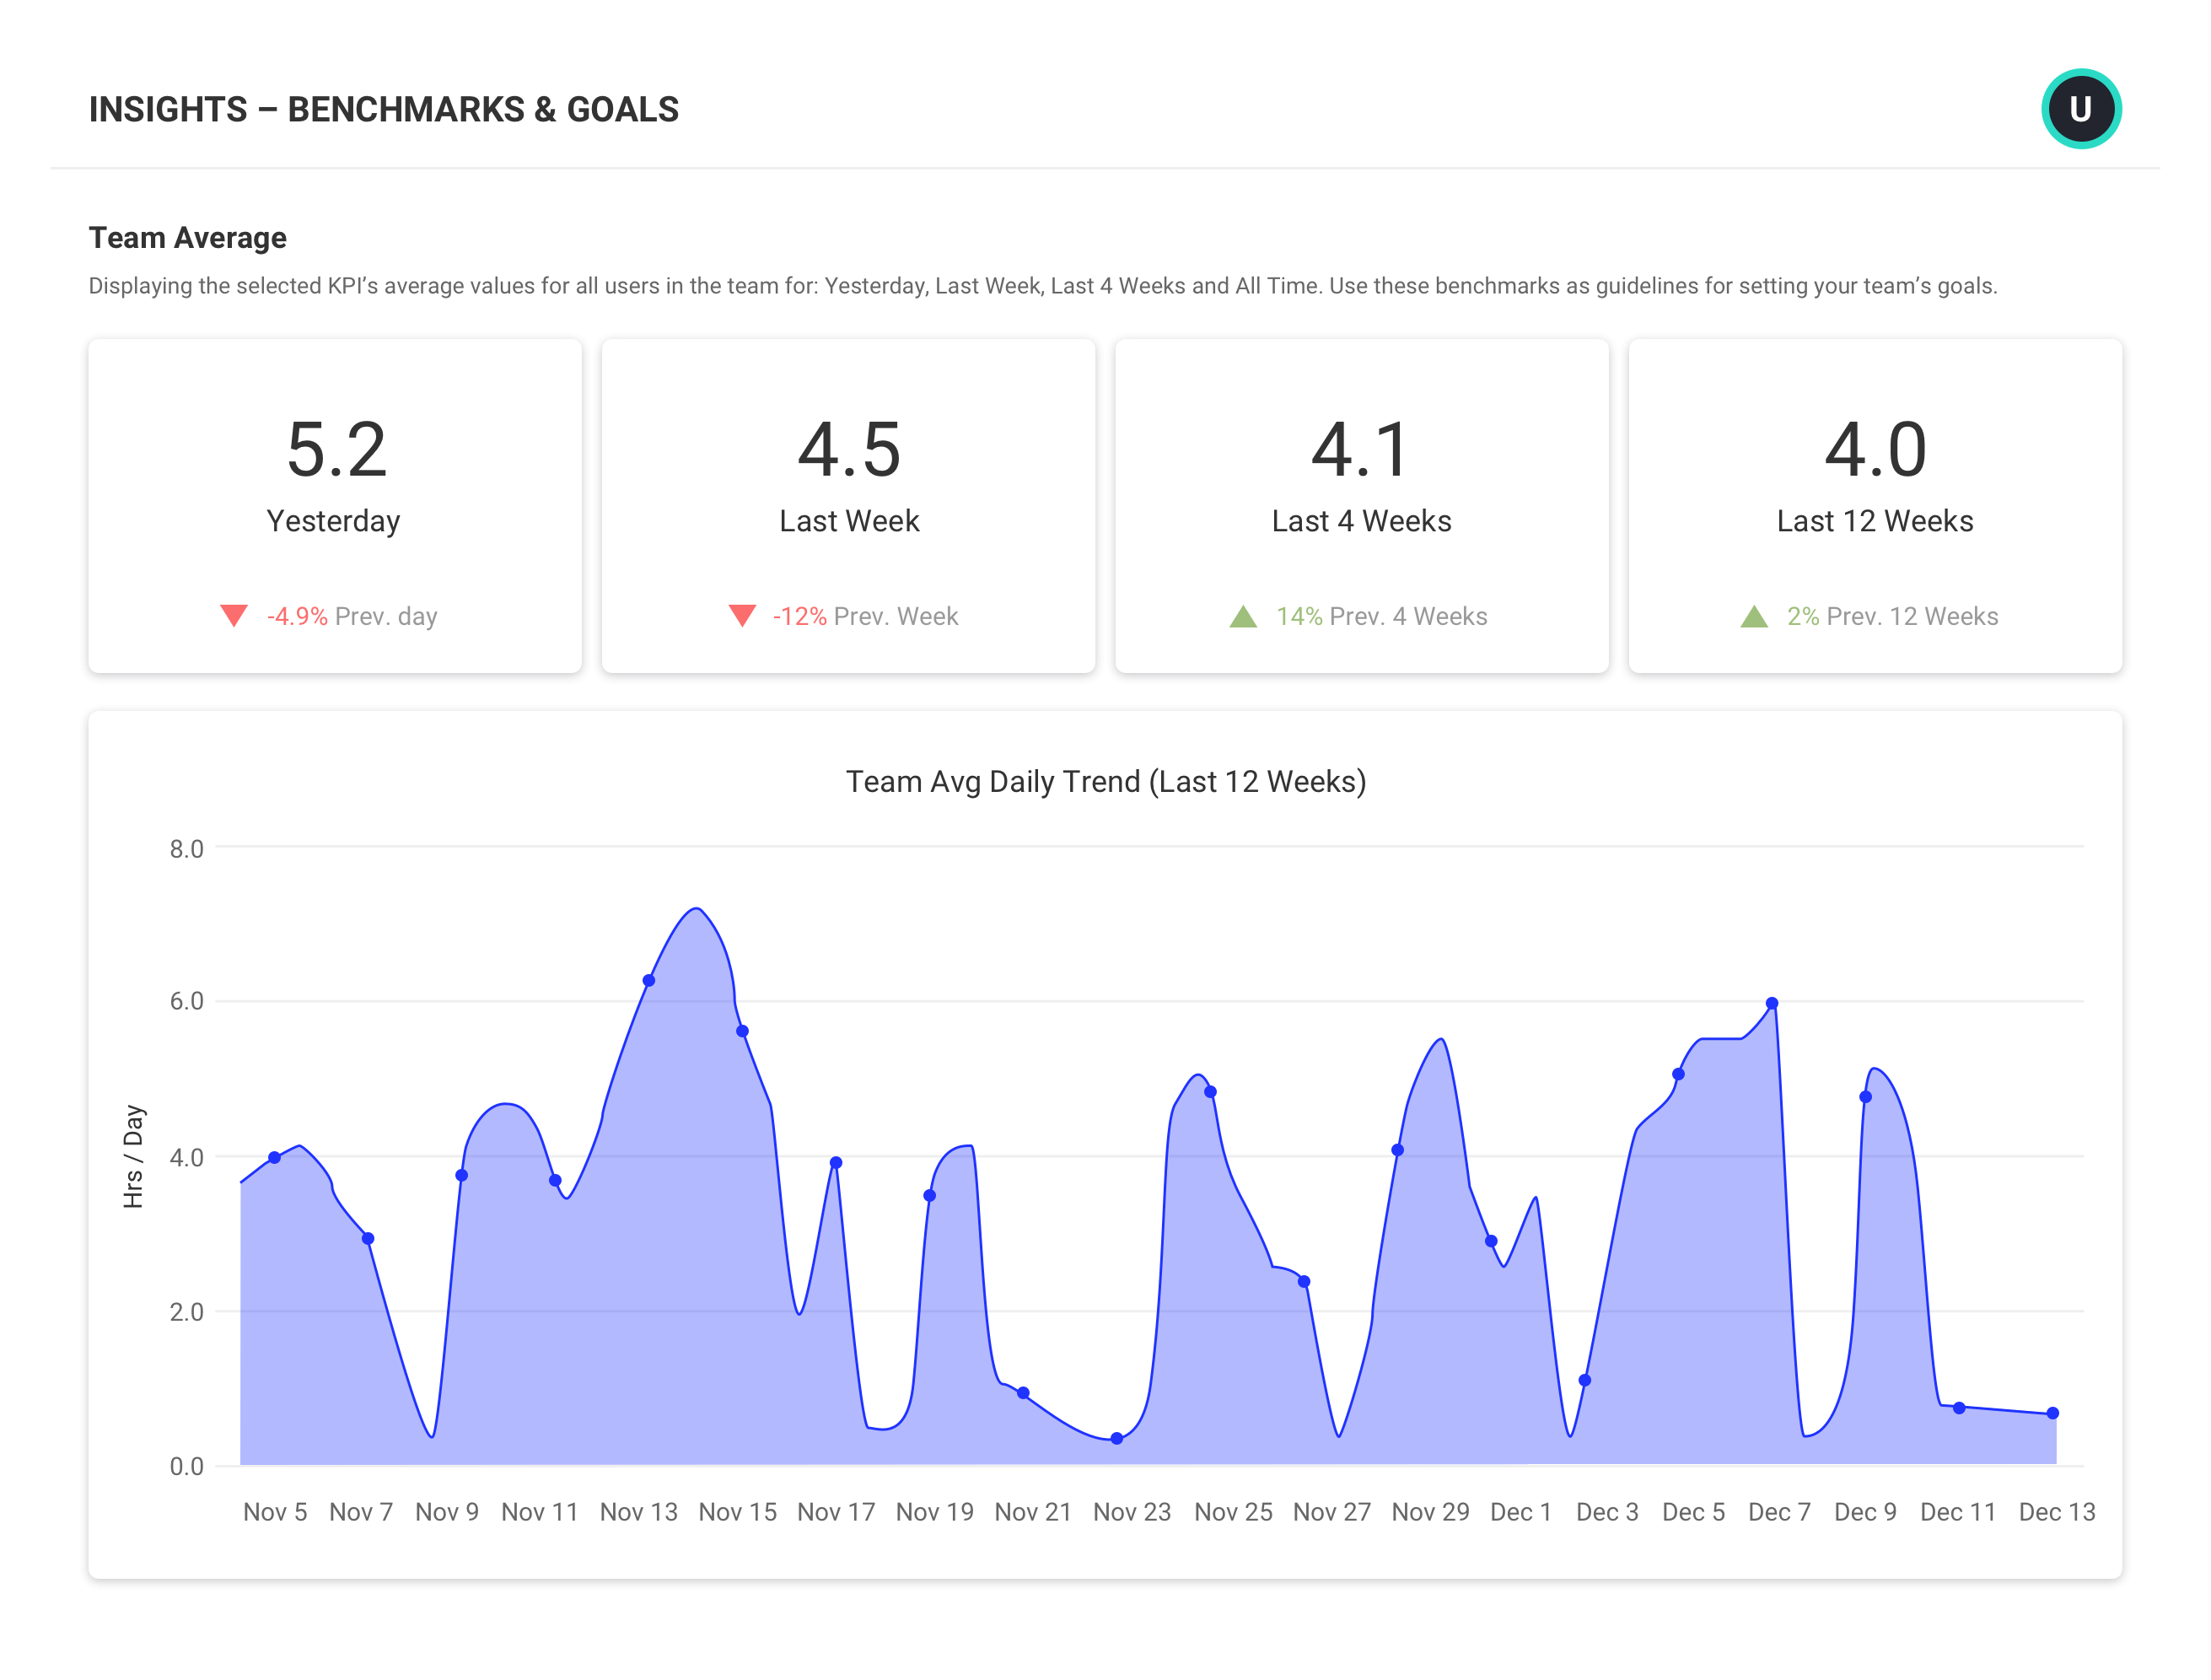
BENCHMARKS & GOALS
Set team goals to motivate and drive improvement
- Set goals for productive, focused, and collaboration time that align with team roles and responsibilities
- Get trend data (Yesterday, Last Week, Last 4 Weeks, etc.) to establish benchmarks and define team goals
- Engage and motivate employees by sharing progress and celebrating improvements
- Help employees track personal goals with weekly emails from their Personal Insights Dashboard
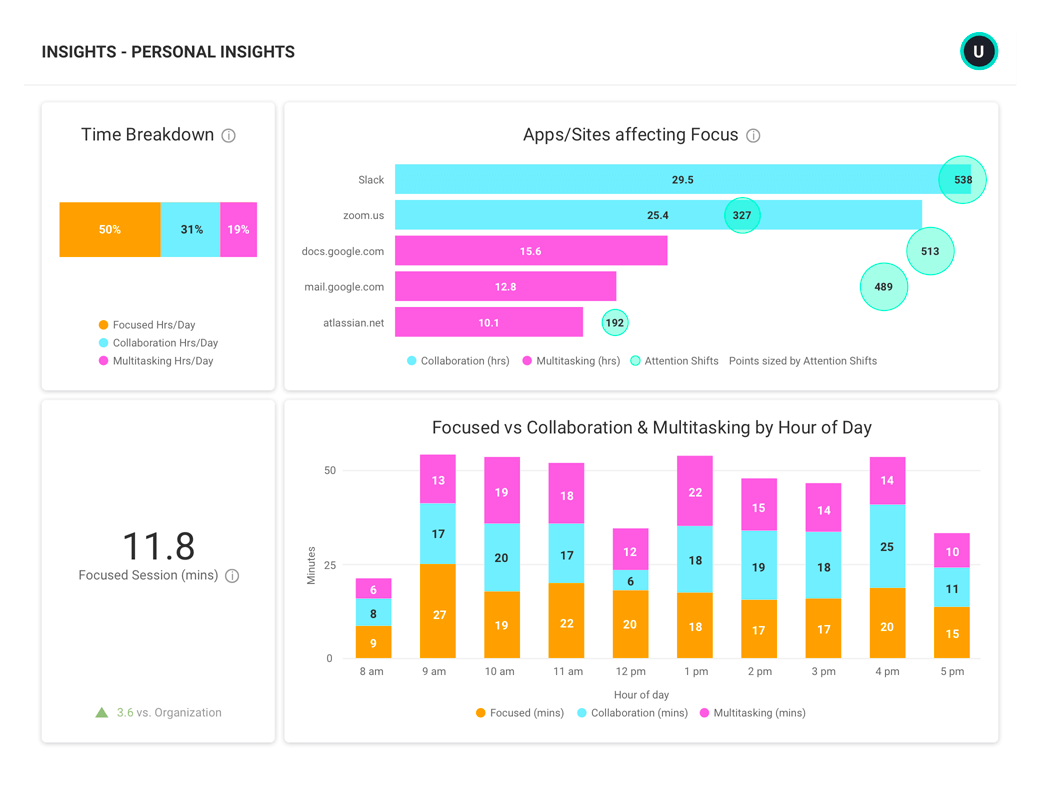
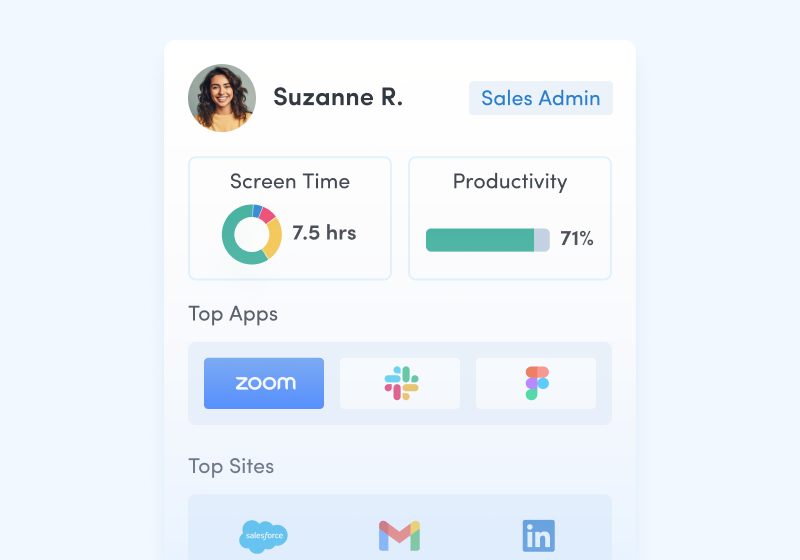
PERSONAL INSIGHTS
Empower employees to improve personal work habits and well-being
- Give employees visibility into personal productivity data and patterns
- Use data to support collaborative conversations about workload or focus time concerns
- Visualize and correct imbalances in time spent on focus, collaboration, and multitasking
- Compare personal productivity metrics against team benchmarks to understand work habits in context
INTEGRATIONS
Integrate employee activity data with other business data for deeper insights
- Complement OKR data and feedback from HR surveys and sentiment analysis with quantitative data
- Combine ActivTrak data with other software such as Salesforce, ZenDesk and Lattice to gain deeper insights into employee engagement and experience
- Run custom queries or leverage free starter templates for business intelligence tools including Microsoft Power BI, Tableau and Looker Studio.
What you can do with ActivTrak
ActivTrak gives you the work intelligence to understand how work happens across people, tools and AI. Measure productivity, improve efficiency, and see how AI is changing workflows—so you can improve performance across your organization.
Executive Insights
Transform workforce data into boardroom-ready insights. See cross-team performance, identify hidden cost savings and make confident decisions that drive measurable business outcomes.
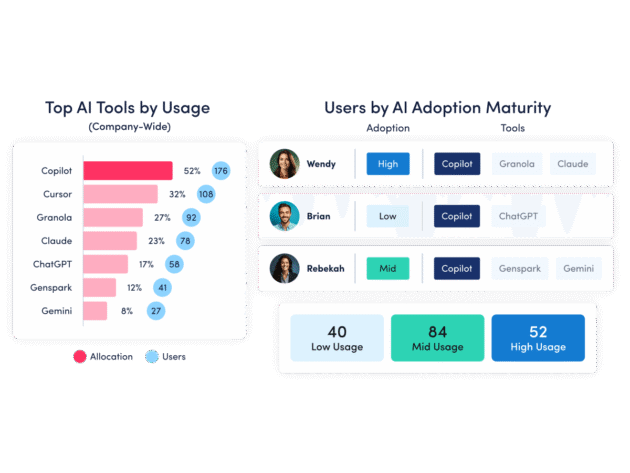
AI Insights
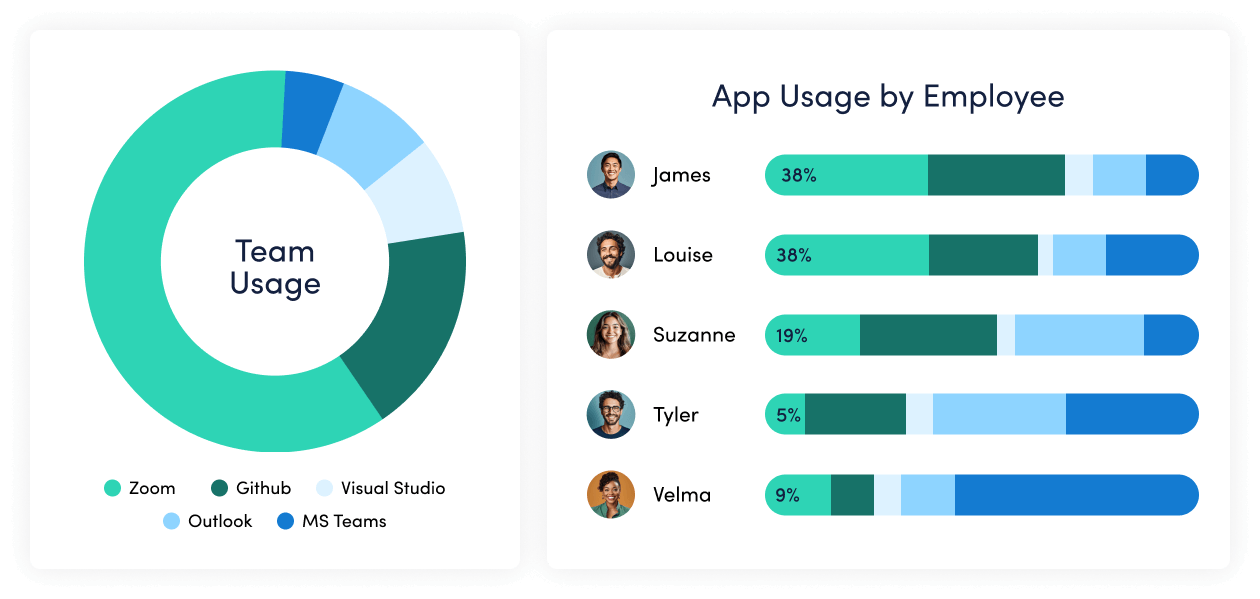
Understand how tools — and AI — are shaping work. See how applications and AI tools are used. Identify what’s driving value, where licenses are underused and how workflows are evolving.
Workforce Management
Understand how work happens across your organization. Analyze work patterns across teams, roles and tools to see where time goes, where friction exists and where performance can improve.
Productivity Optimization
Improve performance with data-driven insight. Quantify productivity, identify capacity and help teams work in more effective, sustainable ways.
Technology Usage & Compliance
Optimize technology investments and ensure compliance. Understand which applications and websites employees use to drive adoption or cut costs, and enforce policies aimed at mitigating risk.
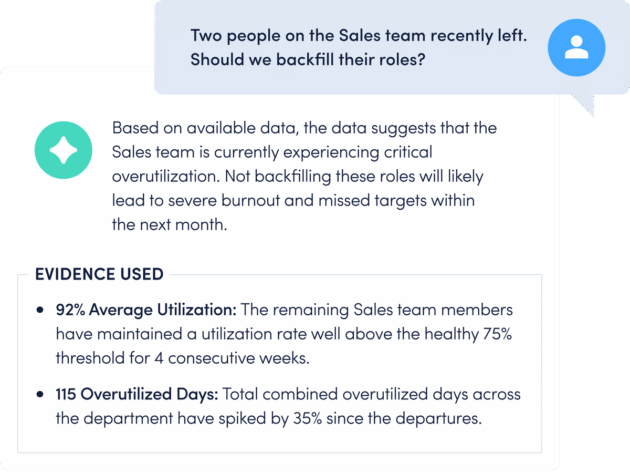
Work Advisor
Let ActivTrak’s conversational AI assistant pull directly from your data for evidenced-backed answers to pressing questions. Skip the manual analysis and get instant insights on work habits, staffing needs, attendance and more.
Connect work intelligence across your tech stack
Integrate existing tools to combine workforce activity, AI usage and business data for deeper, more actionable insights.
Workday
ADP

Microsoft Teams
Outlook

Google Calendar
ServiceNow
Zendesk
ChatGPT
Claude
Gemini
Microsoft Viva
Jira Software
Salesforce
Slack
How It Works
Capture behavioral activity
Capture behavioral activity including hours worked, schedule adherence, location policy compliance and app & website usage.
Analyze productivity trends
Analyze productivity trends on employee focus, engagement and utilization to make data-informed decisions on resource allocation.
Optimize team performance
Optimize team performance with benchmarks, goal-tracking and AI coaching recommendations to improve workforce productivity.
See what customers say about ActivTrak
Powered by![]()
Getting started is easy. Be up and running in minutes.
Frequently asked questions about employee engagement
What is employee engagement?
Employee engagement is the extent to which employees feel passionate about their jobs and are committed to the organization. Studies confirm that employee engagement drives performance and productivity. In fact, 71% of executives say that employee engagement is critical to their company’s success. When employees care – when they are engaged – they use discretionary effort. When employees are engaged, organizations are more likely to outperform their competition, retain top performers, and attract new talent. Ongoing measurement and management of employee engagement helps organizations identify early signs of unbalanced workloads, poor engagement, and workplace burnout. Leveraging a platform like ActivTrak, workforce analytics insights – including focus, habits, trends, and interruptions – can be shared with employees to proactively drive new habits and deliver support in advance of productivity and performance challenges.
What are examples of employee engagement?
Employee engagement is the emotional commitment the employee has to the organization and its goals. They use discretionary effort – not just working for a paycheck, but working on behalf of the company’s goals. For example, this means an engaged sales professional follows up to answer a customer question, even if it’s after hours. Or, the engaged website developer works overtime when needed, without being asked.
How do you build employee engagement?
Initiatives to build and continuously improve employee engagement starts with understanding how your organization is doing. Administering an employee engagement survey provides a moment-in-time snapshot, however, pairing that with actual workplace data collected on an ongoing basis, can give you a true picture of employee engagement. Leverage these insights – technology usage, activity breakdown, focus, sources of inefficiencies – as a coaching tool to help increase employee engagement and job satisfaction.
With this type of real data, organizations are able to develop meaningful employee engagement strategies, training programs, and initiatives to raise levels of engagement and elevate productivity and performance across the business.