About This Report
The ActivTrak Productivity Lab is committed to challenging workplace assumptions — and this year’s data gives us plenty to challenge. Spanning more than 443 million hours of work activity across 1,111 organizations and 163,638 employees over three years, this year’s report is one of the most comprehensive and objective studies of productivity behaviors to date.
The prevailing assumption about AI and modern work is that both make the workday lighter. Shorter. More manageable. AI handles repetitive tasks, collaboration tools reduce friction and employees do more with less effort. It’s a compelling story. It’s also not what the behavioral data shows.
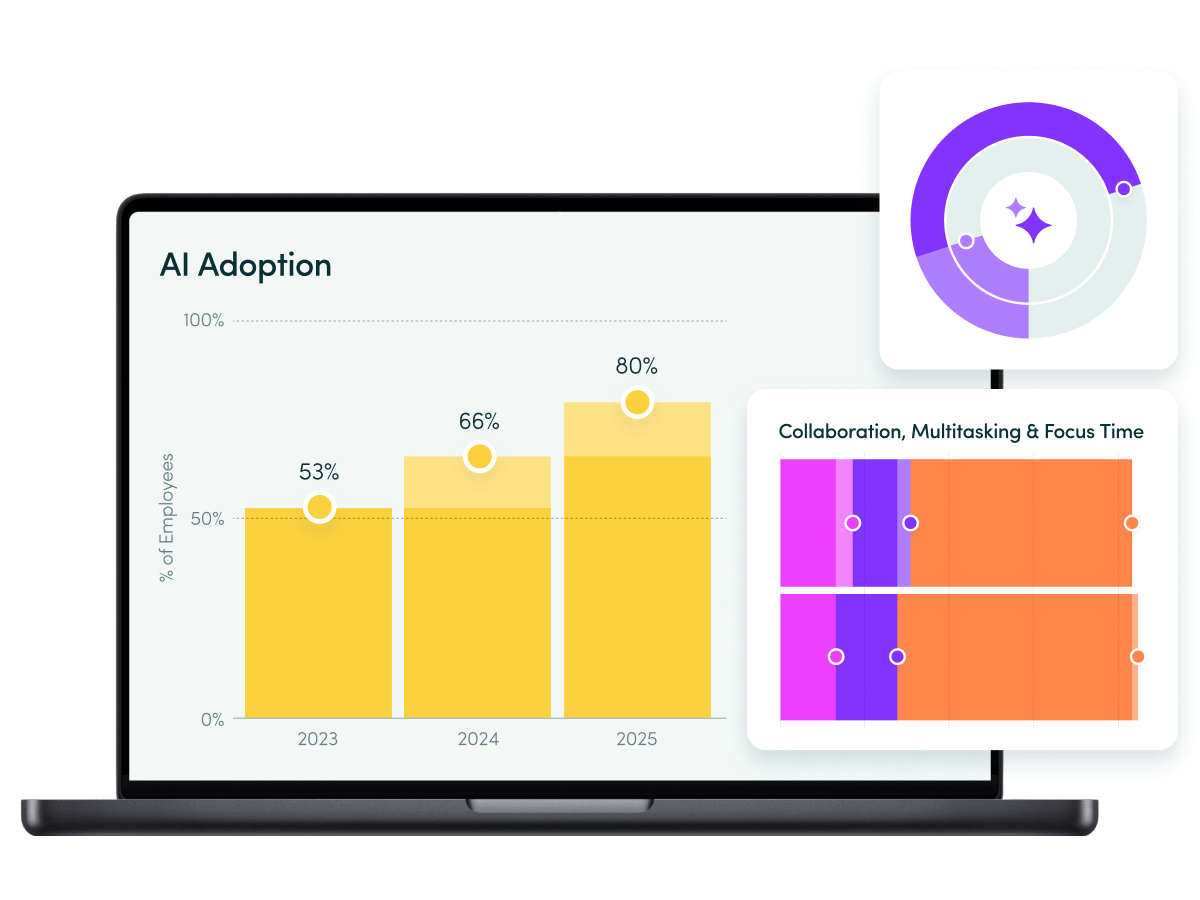
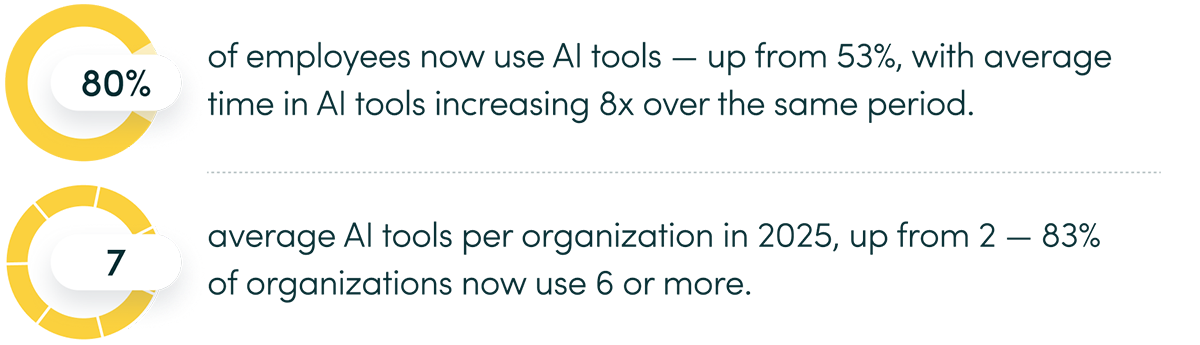
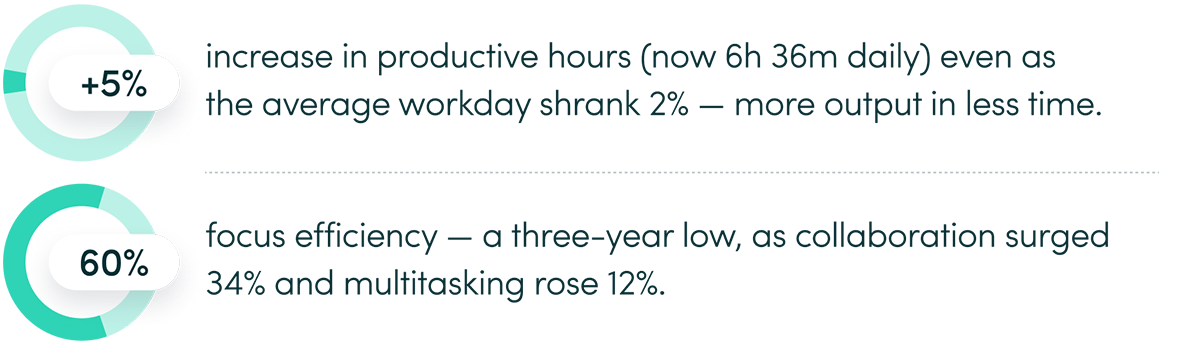
Workdays are shorter, yes. But productive hours increased 5%. AI adoption hit 80%. Time spent in AI tools increased eightfold. And collaboration surged 34%. AI isn’t replacing work. It’s amplifying it.
But beneath those gains, structural tension is building. Focus efficiency, the percentage of work time spent in focused, uninterrupted activity, declined to 60% — a three-year low. Risk of disengagement jumped 23%. And while burnout is down — a genuine win — more employees than ever are chronically under-challenged rather than overextended. The workplace is now better at preventing exhaustion. But not so much at deploying capacity.
What most organizations still lack, however, is clear visibility into how those changes actually impact productivity, focus and workforce capacity.
This is the defining challenge of 2026: the systems governing attention, focus and workforce alignment haven’t kept pace with the acceleration happening around them. The question for leaders is no longer whether to adopt AI or determine where and when work happens. It’s whether their operating model is designed for a workforce that works differently — and unevenly.
Unless noted, all findings reflect behavioral data collected between January 1, 2023 and December 31, 2025, across 1,111 companies, 163,638 employees and more than 443 million hours (Data Set A).
Work location findings use a location-tagged subset of 401 companies and 130,177 employees (Data Set D).
What Leaders Need to Know
The Workday Is Shrinking. The Workload Isn’t.
Ask most leaders how work is going, and the answer follows a familiar arc: AI is handling more, workdays are more manageable, and efficiency gains are starting to show. The data from 2025 supports that — to an extent.
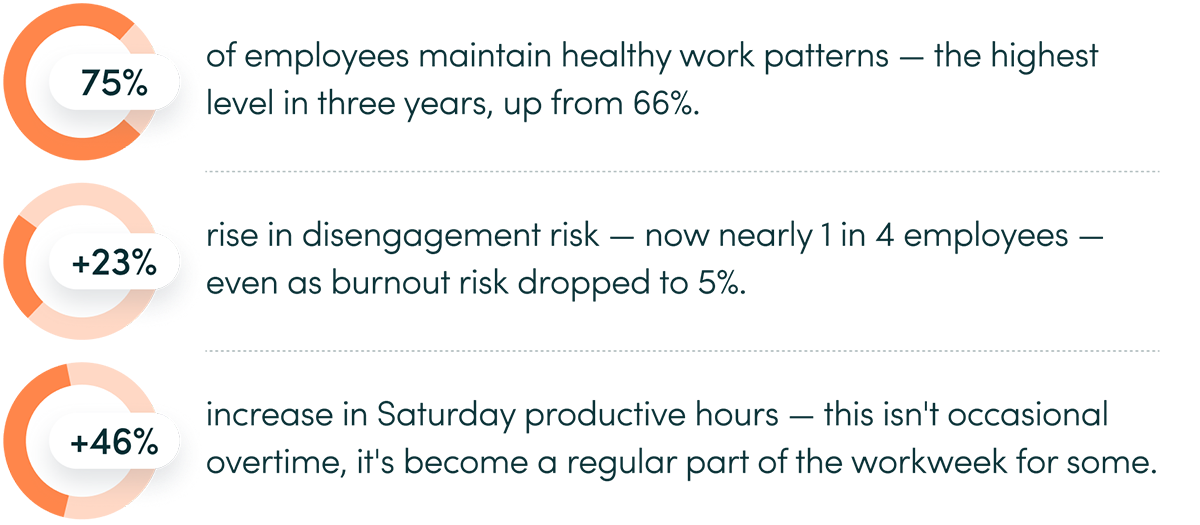
Healthy work patterns reached a three-year high, with 75% of employees maintaining balanced utilization. Burnout risk fell 22%. Productive hours increased even as workdays got shorter. AI adoption surged to 80% of employees — up from just 53% two years ago — with AI usage retention averaging 92% month over month. By conventional measures, the workplace is improving.
But the behavioral data tells a different story.
Focus efficiency dropped to 60% — a three-year low — as collaboration time surged 34% and multitasking climbed 12%. Disengagement risk rose 23%, meaning that while fewer employees are burned out, a growing number are chronically under-challenged. Maximum output and sustainable performance are not the same thing.
What emerges across every dimension of this year’s data is a consistent pattern: work is accelerating faster than the systems designed to manage it.
AI is adding to workloads rather than redistributing them. Collaboration is expanding faster than attention can support it. Productivity gains are real but increasingly funded by fragmentation rather than depth. The organizations that improved employee wellbeing did so by reducing overload. Fewer have figured out how to actively redeploy the capacity that freed up — largely because they lack visibility into how AI is changing work.
This gap between AI adoption and understanding its real impact on productivity, focus and workforce capacity is what we call the AI Measurement Gap.
Closing that gap is the central leadership challenge of 2026. Not whether to adopt AI, not where employees should sit, not how to measure hours — but whether organizations have the visibility and operating discipline to govern an accelerating workforce aligned with the outcomes that actually matter. The workplace is being reshaped in real time. The question is whether leaders are the ones shaping it, or being shaped by it.
The Bottom Line
The modern workday is shorter, but work itself is becoming denser, faster and more fragmented. AI is accelerating throughput without reducing workload, creating a new leadership challenge: governing amplified work rather than simply adopting new tools.
Key Findings at a Glance
What This Means for 2026
Three years and over 443 million hours of behavioral data now point in a consistent direction. The productivity story is improving by most conventional measures. The alignment story is not. Here is what the ActivTrak Productivity Lab believes leaders should be paying attention to.
The question has shifted from AI adoption to orchestration
For the past three years, AI adoption was the headline. It no longer is. Eighty percent of employees already use AI tools, and 95%+ of organizations have adopted AI in some form. The organizations that pull ahead won’t be the ones still debating whether to adopt — they’ll be the ones developing the operating discipline to deploy AI strategically. Closing the AI measurement gap will be a defining challenge for the next phase of AI adoption. That means understanding which employees use which tools, at what intensity, and to what effect. It means moving from tracking adoption rates to measuring AI effectiveness. The sweet spot our data identifies — 7–10% of total work hours in AI — suggests there is an optimal zone that most organizations haven’t mapped, let alone managed toward. And with average tool counts at 7 per organization and rising, AI governance is no longer a future concern. It’s a present one.
Disengagement is the next workforce crisis
Burnout dominated the post-pandemic workforce conversation. The data suggests that conversation needs to shift. The share of employees at risk of disengagement is now larger than the share at risk of burnout — and it grew 21% in a single year. These are not employees who are checked out; they are employees whose capacity isn’t being used. Organizations have invested heavily in reducing overload. Few have invested equally in redeployment. The behavioral data makes it possible to see exactly where underutilized capacity lives. The organizations that act on that visibility will have a meaningful advantage in an environment where workforce efficiency is increasingly tied to competitive outcomes.
Focus is becoming a managed resource, not a default state
The three-year decline in focus efficiency is not noise. It is a structural shift driven by the simultaneous rise of collaborative tools, AI platforms and hybrid work norms — each of which fragments attention in different ways. In 2025, the average focused session lasted just 13 minutes 7 seconds, down 9% from 2023. Deep, sustained focus is increasingly rare, and the data suggests it is getting rarer. Organizations that treat focus as something employees manage on their own will continue to see erosion in the metrics that predict long-term performance. Those that design for it — through meeting norms, async workflows, protected time blocks — will see the difference in their data.
Findings
AI Adoption & Impact
What the Lab Studied:
- How pervasive is AI adoption — and does it actually change how work gets done?
- Are organizations consolidating around a few tools or fragmenting across many?
- What is the relationship between AI usage and productivity outcomes?
Key Findings:
Eighty percent of employees now use AI, but with the average organization running seven platforms — and only 3% of users hitting the productivity sweet spot — the real work is learning to govern it, not just greenlight it.
Adoption
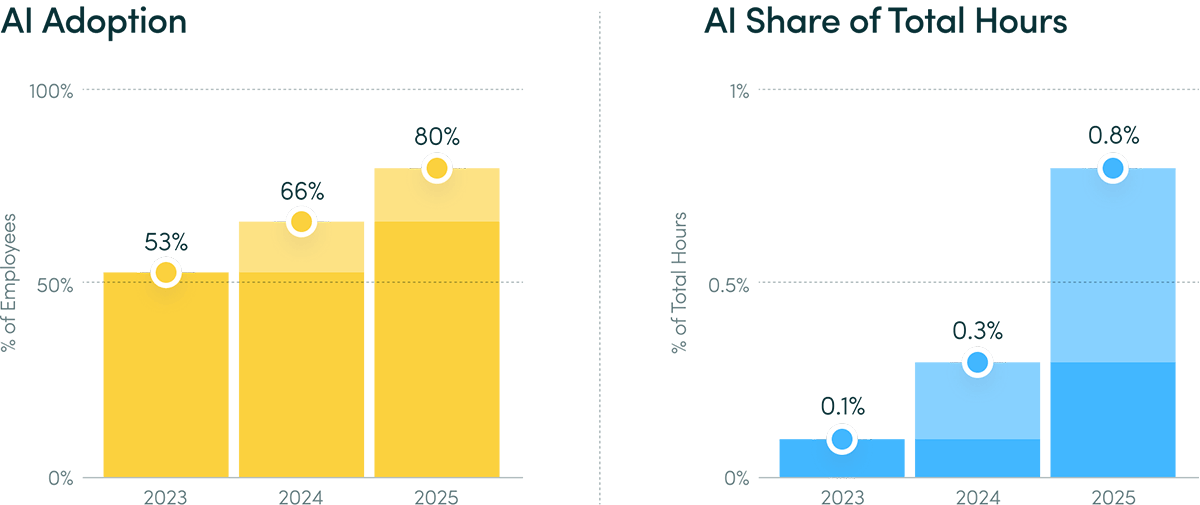
- 80% of employees use AI tools — up 52%
- Average AI time as a share of total hours increased 8x (0.1% → 0.8%)
- 92% average month-over-month retention in AI usage — adoption is sticky, not experimental
- 39% of AI users have 13+ consecutive months of use; only 9% used it once
Impact
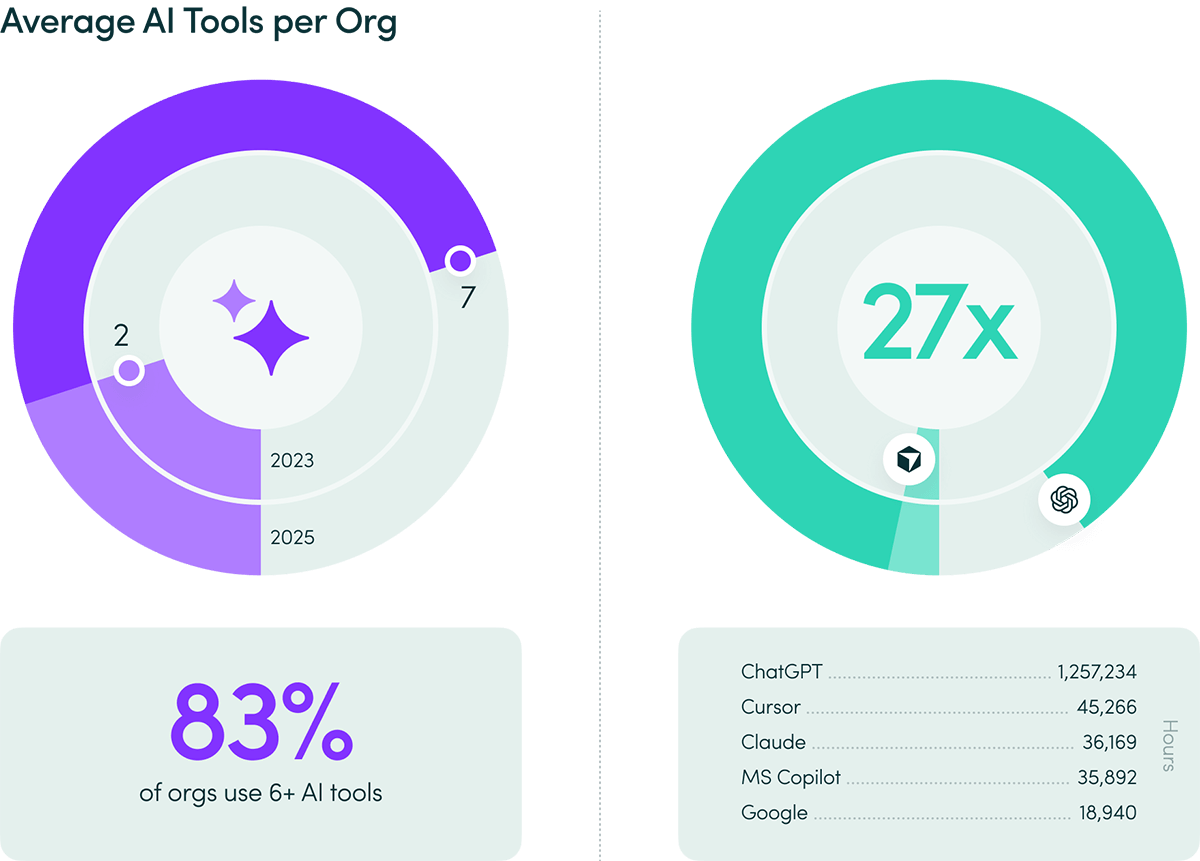
- 7 average AI tools per org, up from 2
- 83% of orgs use 6+ AI tools — sprawl is dominant and growing
- ChatGPT leads by hours (27x over Cursor, at #2); Microsoft leads by users
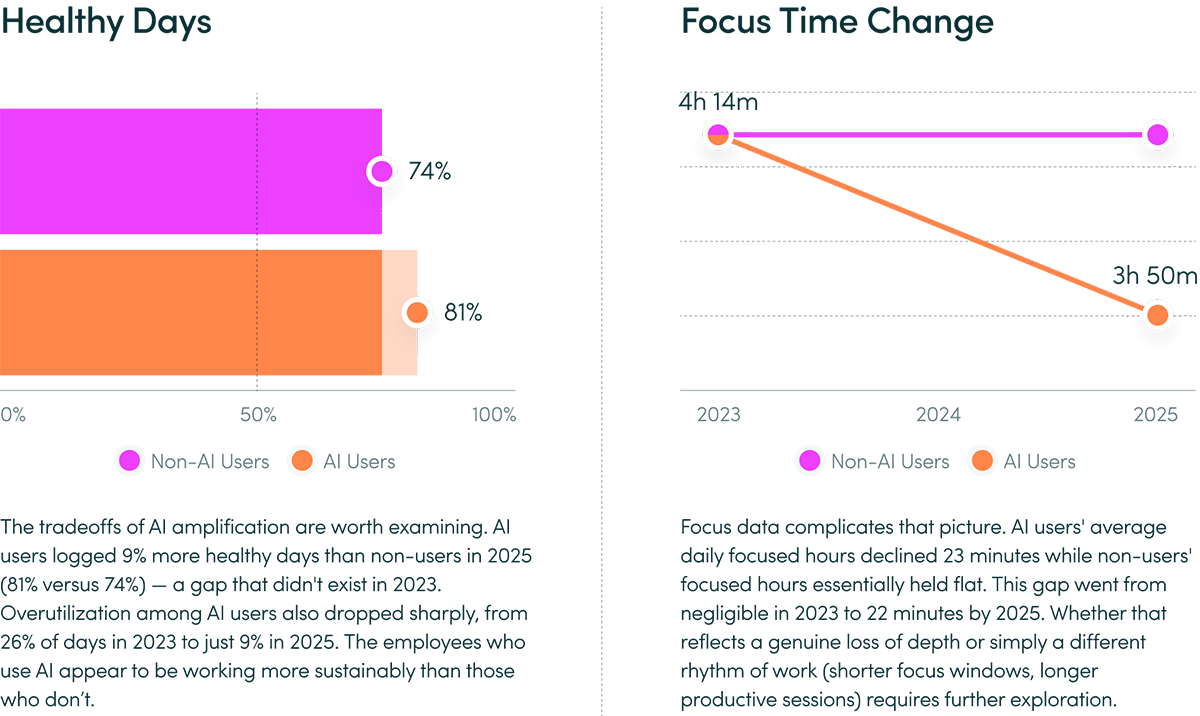
- AI users spent 9% more days in healthy utilization patterns than non-users
- AI users’ daily focus time declined 9%, compared to virtually no change for non-users
AI Adoption & Impact
Adoption Is No Longer the Story
The percentage of employees who use AI tools reached 80%, up from 53%. But the more telling figure is usage depth: time spent in AI tools increased eightfold. And monthly retention has averaged 92% since January 2024 — with no single month dropping below 88%. Thirty-nine percent of AI users have logged AI time for 13 or more consecutive months since Jan 2024, while only 9% have used it for just a single month. Despite near universal adoption, there is no evidence that AI frees capacity at this time.
Adoption is no longer the question. The question is what’s happening inside it. Most organizations can track AI adoption, but very few can measure how it changes work — a gap the ActivTrak Productivity Lab calls the AI Measurement Gap.
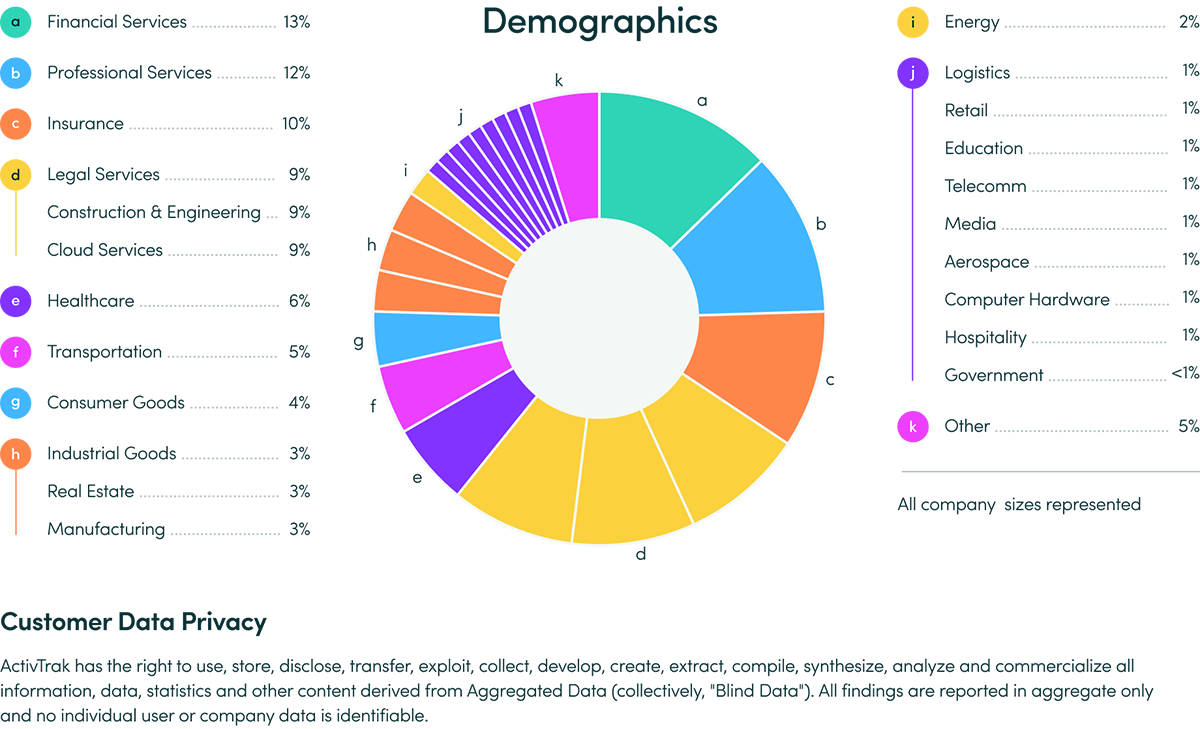
Industry & Business Size Snapshot
AI adoption is remarkably consistent across organization sizes. By early 2025, 95%+ of organizations across every size tier had adopted AI to some degree — from companies with <50 FTEs to those with 1,000+.
Smaller organizations (<200 FTEs) were faster early adopters in the first half of 2023, growing at 2–13x the rate of larger organizations. But by February 2025, the gap had essentially closed.
Average AI usage as a share of total hours is virtually identical across organization sizes — ranging from 0.6% to 0.7% — suggesting that intensity use has plateaued at a similar level across the board.
AI Adoption & Impact
Tool Sprawl Is Standard
In 2023, the average organization used 2 AI tools. In 2025, that number was 7 — and 83% of organizations used 6 or more. Organizations aren’t consolidating around trusted platforms; they’re expanding across them. ChatGPT dominates total usage hours — by 27x over Cursor, the next most used AI tool. But the landscape is fragmenting, not converging. Chatgpt.com became the 5th most used website by total hours, up from #19 in 2024, with a 145% year-over-year increase.
This has real implications for AI governance. When the average company uses 7+ AI tools and employees work across several tools simultaneously, questions of oversight, consistency and impact become exponentially harder to answer.
88% of organizations now use AI in at least one business function, up from 78% the prior year — but most remain in experimenting or piloting stages, with roughly one-third having begun to scale. — McKinsey & Company, The State of AI: Global Survey 2025
AI Adoption & Impact
AI Amplifies Work, It Doesn’t Replace It
The data is unambiguous: AI does not reduce workloads. Among a subset of 10,584 users comparing 180 days before and after AI adoption (Data Set B), time spent across every measured work category increased between 27% and 346% — with email up 104%, chat and messaging up 145% and business management up 94%. No activity category decreased after adoption.
AI is being used as an additional productivity layer, not a substitute for existing work. High-performing employees are adopting it and doing more — not the same amount more efficiently.
Before/After AI Adoption
Collaboration time +5%
Time spent in email +104%
Time spent in chat & messaging +145%
Time spent in business management tools +94%
Activities with a decrease None
AI Adoption & Impact
There Is a Sweet Spot, and Most Users Aren’t In It
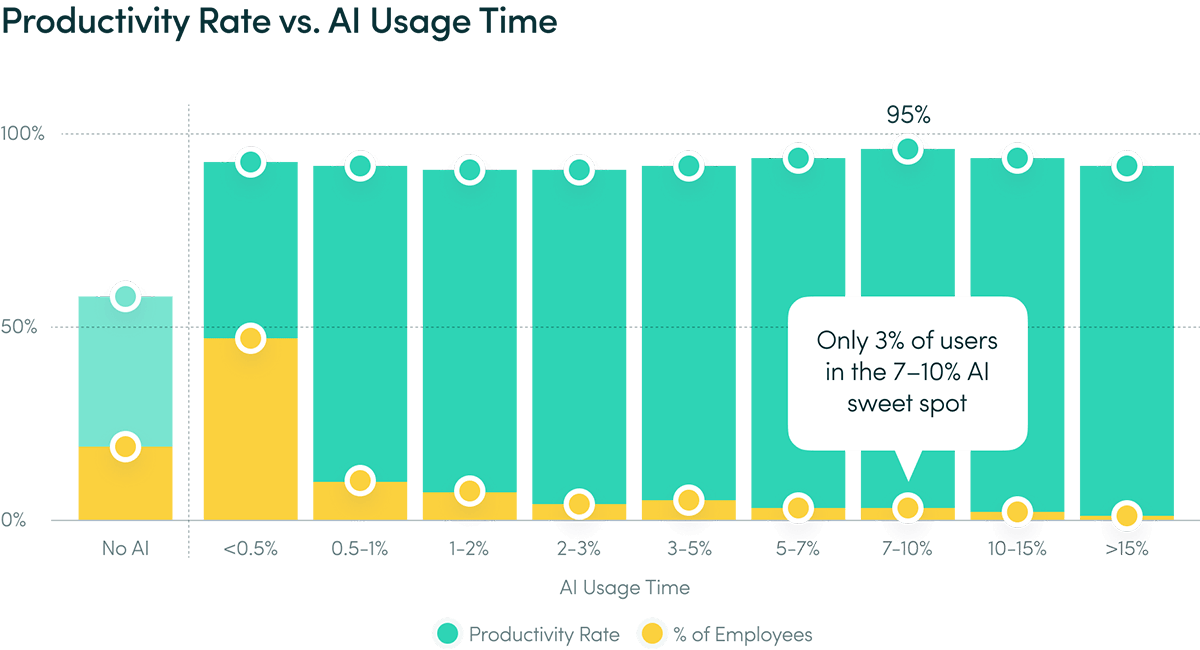
Across 2023-2025 combined, employees who spend 7–10% of their total work hours in AI tools show the highest productivity (95%) of any usage tier — higher than both lower and higher usage brackets. Yet only 3% of users currently fall within that range. The largest segment — 57% — spends less than 1% of total hours in AI tools.
The implication: most organizations have adoption. Very few have optimized or operationalized it at scale.
Productivity growth in industries most exposed to AI nearly quadrupled since 2022, and those industries now see 3x higher revenue-per-employee growth than the least exposed. — PwC, 2025 Global AI Jobs Barometer
Only one-third of organizations use AI to deeply transform — creating new products or reinventing core processes — while 37% use it at a surface level with little change to how work gets done. — Boston Consulting Group, AI Radar 2026
75% of CEOs say trusted AI is impossible without effective AI governance — yet only 39% say they have good generative AI governance in place today. — IBM, Institute for Business Value 2024 CEO Study
ActivTrak Customer Survey Data
Nearly three-fourths (71%) of respondents say they actively use or are piloting AI tools across teams, but 50% of respondents do not measure AI’s impact on their workforce.
Top challenges: managing AI security and data privacy (33%), ensuring effective AI use (25%), and understanding actual productivity impact versus hype (22%) (Data Set C).
Findings
Productivity
What the Lab Studied
- How has the shape of the average workday changed over three years?
- What is happening to focused work — and what is replacing it?
Key Findings
The workday is shorter and more productive, yet focus efficiency declined year over year to 60% — its lowest point in three years. Collaboration is surging, multitasking is rising and focused sessions now average just 13 minutes. Output is up, but the conditions that sustain it are eroding.
Workday Patterns
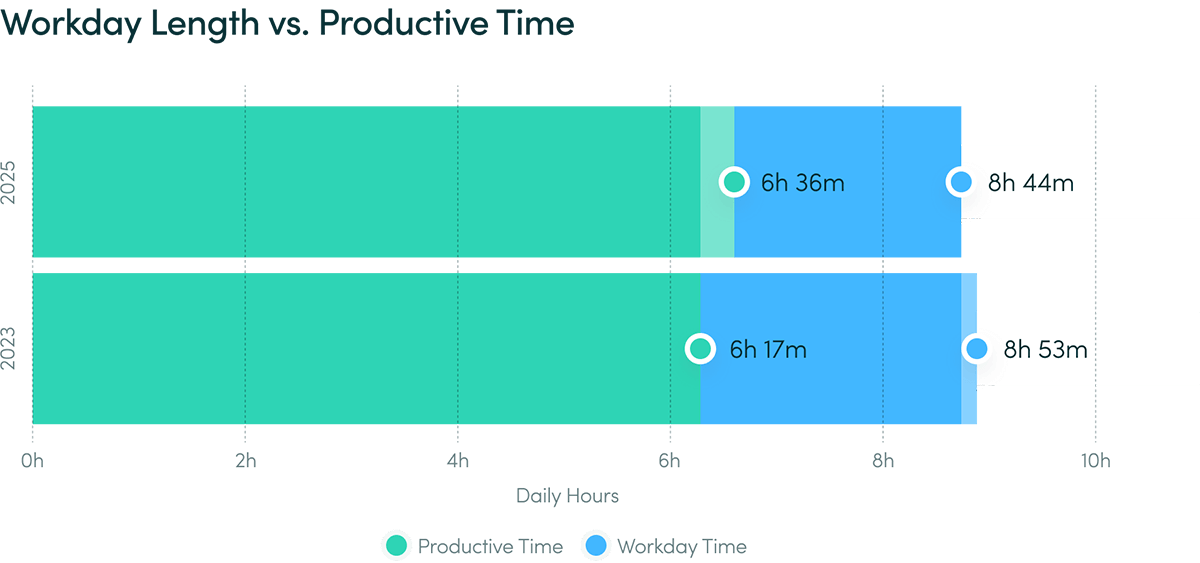
- Workday shrank 2% (8h 53m → 8h 44m)
- Productive hours increased 5% (+19m) to 6h 36m daily
- Employees start earlier (7:48 a.m. vs 8:02 a.m.)
- Productive sessions grew 13% — from 24m 25s to 27m 30s daily
Focus & Collaboration
- Focus efficiency fell to 60% — a three-year low (vs 63% in 2023)
- Average focused session declined 9% — from 14m 23s to 13m 7s daily
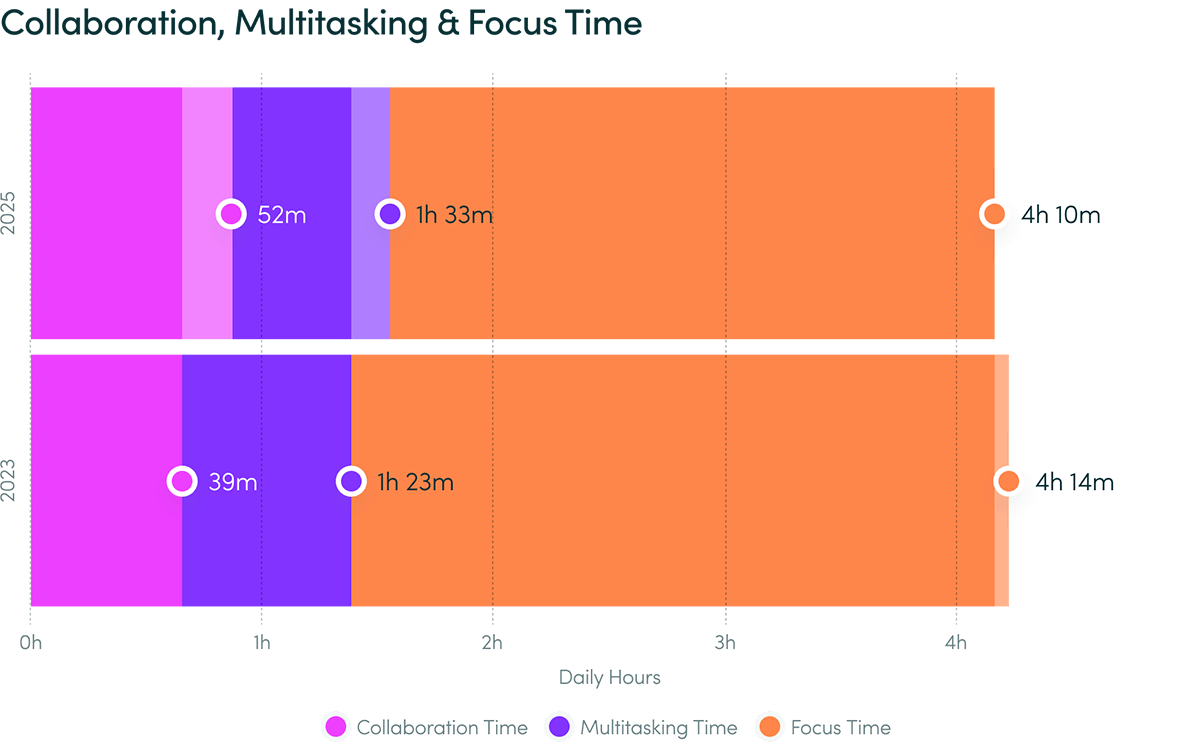
- Collaboration surged 34% (+13m) to 52m daily
- Multitasking rose 12% (+10m) to 1h 33m daily
Productivity
The Workday Is Compressing and Getting More Productive
The average workday shrank from 8 hours 53 minutes in 2023 to 8 hours 44 minutes in 2025 — a 2% decline. Yet productive hours increased 5% over the same period, rising to 6 hours 36 minutes daily. Employees also start their days earlier: average first activity shifted from 8:02 a.m. to 7:48 a.m. The workday isn’t just shorter — it’s denser.
Productive session length grew 13%, from 24 minutes 25 seconds in 2023 to 27 minutes 30 seconds in 2025, meaning individual bursts of productive work are longer even as the total workday shrinks. Productivity efficiency held at 95%. The data consistently supports a ‘working smarter, not harder’ narrative. The complication is what’s happening to focus alongside it.
38% of employees globally are feeling pressure from their employer to increase productivity, caused by pace of change (38%), workload changes (36%), and cost cutting (33%). — Qualtrics, 2025 Employee Experience Trends Report
Microsoft telemetry shows employees are interrupted every two minutes — 275 times a day — by meetings, emails or notifications. Nearly half (48%) say their work feels chaotic and fragmented. — Microsoft, 2025 Work Trend Index Annual Report
Global employee engagement fell to 21% in 2024 — matching pandemic-era lows — with the decline costing the global economy $438 billion in lost productivity. — Gallup, State of the Global Workplace, 2025
Productivity
Focus Is Eroding
Focus efficiency — the share of total work time spent in focused, uninterrupted work — fell to 60% in 2025, a 5% drop since 2023. This is not a one-year anomaly. It is a consistent, three-year downward trend.
The average focus session length declined 9% — from 14 minutes 23 seconds to 13 minutes 7 seconds — and focused hours fell an additional 2% (-4 minutes). Meanwhile, collaboration time surged 34% and now accounts for 13% of all productive hours, up from 10% in 2023.
The productivity gains in the workday are real. But they are increasingly funded by switching between tasks rather than sustained depth. These two trends may be a signal that AI is absorbing the cognitive load that focus time used to carry.
Interruptions are the top productivity barrier across all workforce segments, cited by 53% of workers. Less productive workers are nearly twice as likely to report poor communication as a barrier, while moderately productive workers more often cite workplace distractions and inadequate digital tools. — Deloitte, Capital H Blog, 2024
Findings
Employee Wellbeing & Engagement
What the Lab Studied
- Do employees maintain healthy work patterns, and how is that trend evolving?
- How are disengagement and burnout risks trending?
- What does the data show about weekend work?
Key Findings
Burnout risk has fallen to 5%, healthy work patterns are at a three-year high and overutilization has dropped sharply. This is real progress. But as overload declines, another risk is rising: unused capacity. Nearly one in four employees is now at risk of disengagement.
The Wins
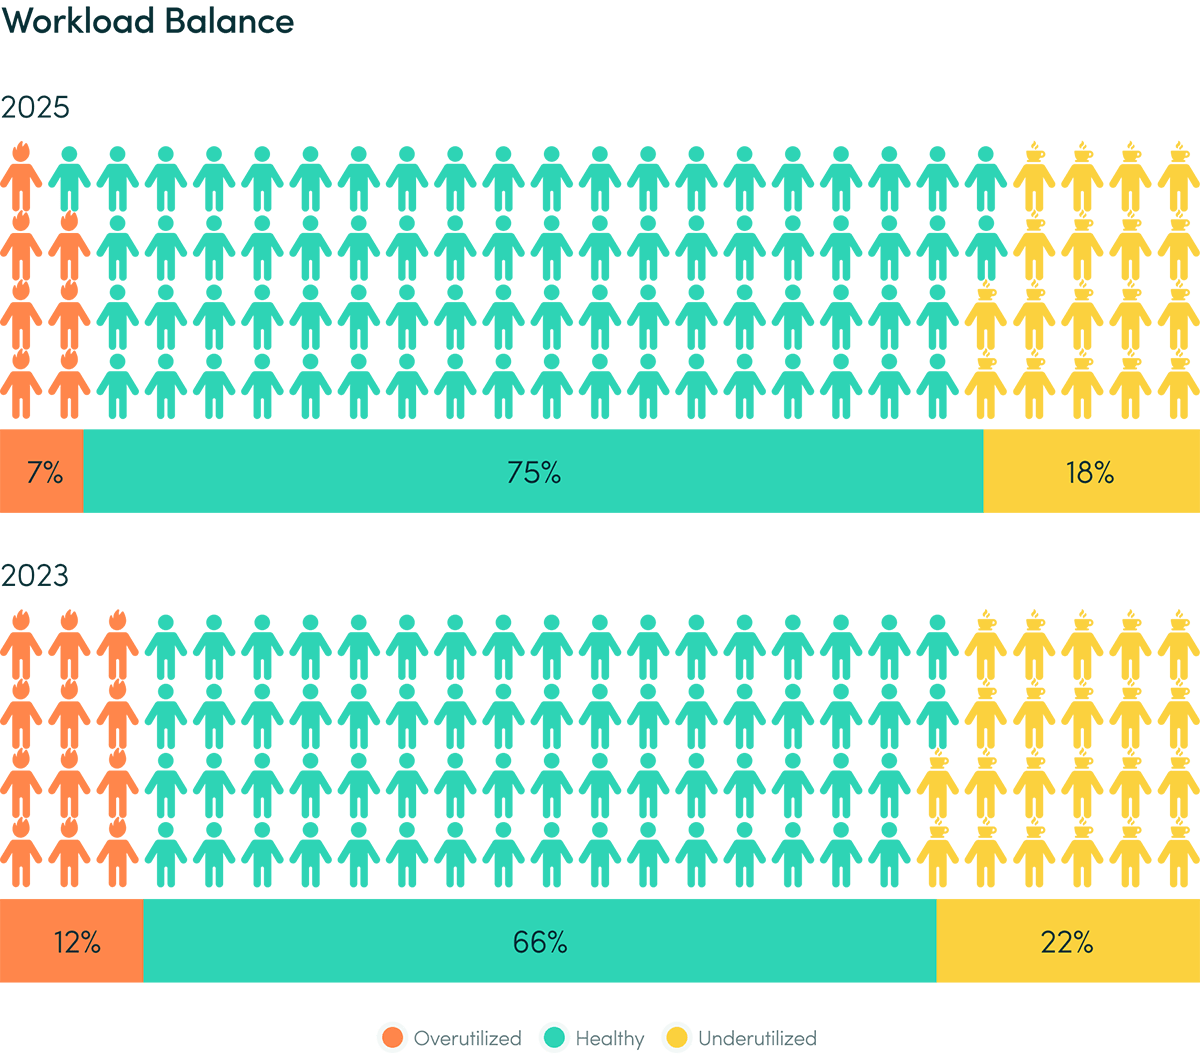
- 75% of employees maintain healthy work patterns — a three-year high (up from 66%)
- Burnout risk fell 22% — now just 5% of employees
- Overutilized employees dropped 42% — from 12% to 7%
- Underutilized employees declined from 22% to 18%
The Tensions
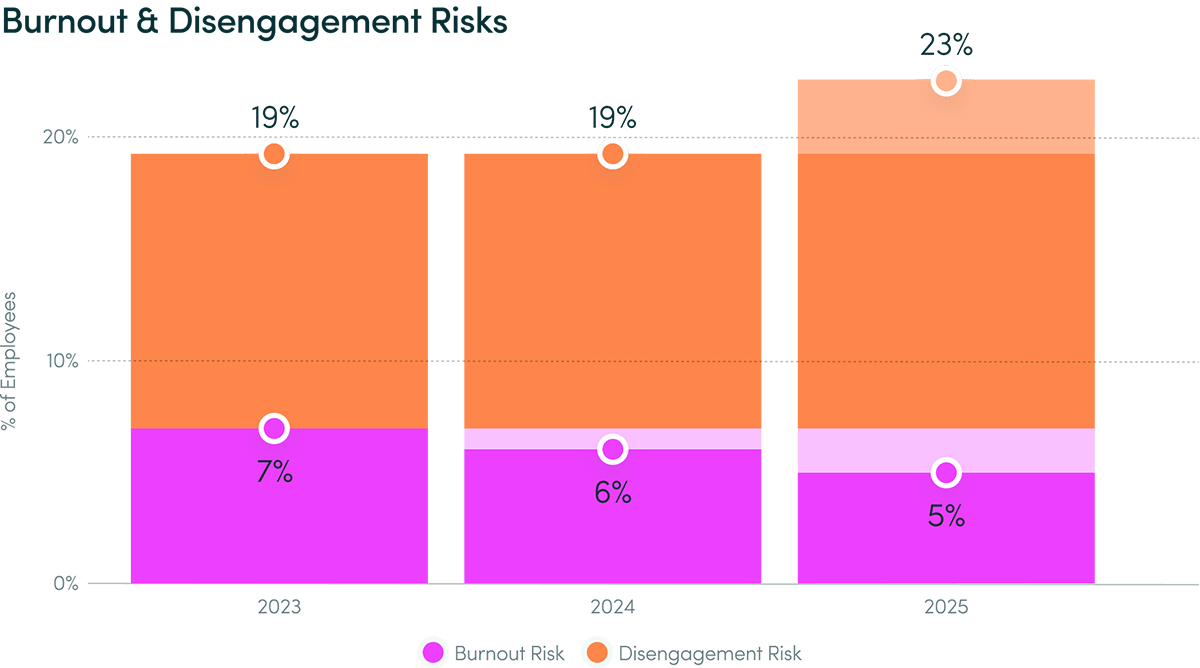
- Disengagement risk affects nearly 1 in 4 — now 23% of employees (up from 19%)
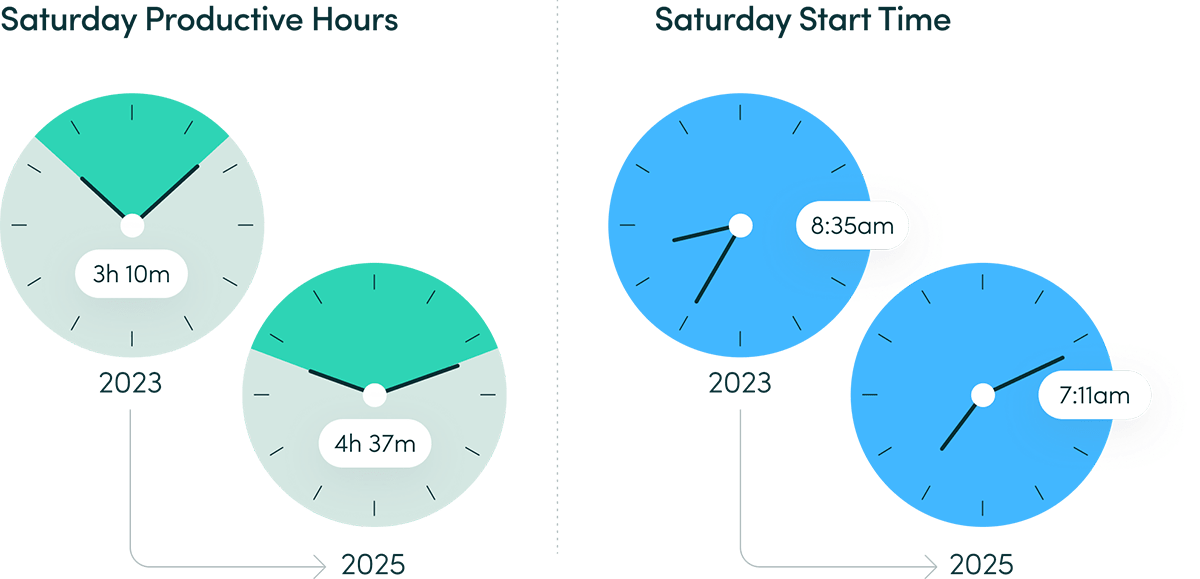
- Saturday productive hours jumped 46% to 4h 37m daily average
- Saturday start times shifted from 8:35 a.m. to 7:11 a.m. — 1h 24m earlier
Employee Wellbeing & Engagement
The Burnout Story Is a Genuine Win
Seventy-five percent of employees maintained healthy work patterns — the highest level in three years and a 13% increase. Burnout risk fell 22% to 5%, while overutilization declined 42% to 7%, reaching its lowest point in Q4 and continuing a consistent year-end improvement trend.
These are real improvements, and they reflect meaningful organizational progress — shorter workdays, more sustainable rhythms and a three-year trend away from chronic overload.
Employee Wellbeing & Engagement
But Disengagement Is the New Risk
At the same time, the share of employees at risk of disengagement rose 23%, jumping sharply from 19% to 23% — with the majority of that increase happening from 2024 to 2025. These are employees who spend more than 75% of their work year in an underutilized state: not burned out, but chronically under-challenged and under-deployed.
The two trends are connected. As overload decreases, freed-up capacity is not automatically redirected toward higher-value work. Without intentional design, it drifts toward disengagement. The burnout crisis has eased. The alignment crisis is only beginning.
Disengagement and attrition could cost a median-size S&P 500 company between $228 million and $355 million a year in lost productivity. — McKinsey Quarterly, 2023
Employee wellbeing is at its highest when work is not unnecessarily burdensome – when their job makes good use of their skills and capabilities, the workplace adapts to new ways of working, and stress levels are manageable. — Qualtrics, 2025 Employee Experience (EX) Trends Report
62% of employees globally are “not engaged” (showing up and doing the bare minimum), while 15% are “actively disengaged” (resentful and actively undermining their company). — Gallup, State of the Global Workplace, 2025
Employee Wellbeing & Engagement
Weekend Work Is No Longer a Margin Phenomenon
Weekend work has become a structural feature of workforce activity data. Saturday productive hours increased 46%, from 3 hours 10 minutes to 4 hours 37 minutes per worker, while Sunday productive hours rose 58%, from 2 hours 30 minutes to 3 hours 58 minutes. Weekend start times are shifting earlier every year: the average start time on Saturdays moved from 8:35 a.m. to 7:11 a.m. — 1 hour 24 minutes earlier. Sunday starts shifted from 12:24 p.m. to 10:58 a.m.
This isn’t a story about a small group of workaholics. It’s a structural shift in how weekend time is used, trending consistently in one direction across three years.
Industry & Business Size Snapshot
Insurance, Legal and Financial Services have the most employees with healthy utilization at 79% each.
Education has the fewest employees with healthy utilization at 43% — nearly half the overall average and 32 points below it.
Only five industries saw an increase in burnout risk, with Logistics now at 9%, followed by Cloud and Legal Services (both 8%).
Insurance has the lowest disengagement risk (14%), while Education leads at 64% — nearly 3x the overall average of 23%.
Findings
Work Location
What the Lab Studied
- How do productivity and wellbeing metrics vary across work location types?
- What are the tradeoffs between remote, hybrid and in-office work?
Key Findings
No single work model holds a clear advantage across every performance measure. While many leaders contend with the “return to office” question, the more important query is whether their operating model gives employees the conditions to do their best work regardless of where they sit.
Remote
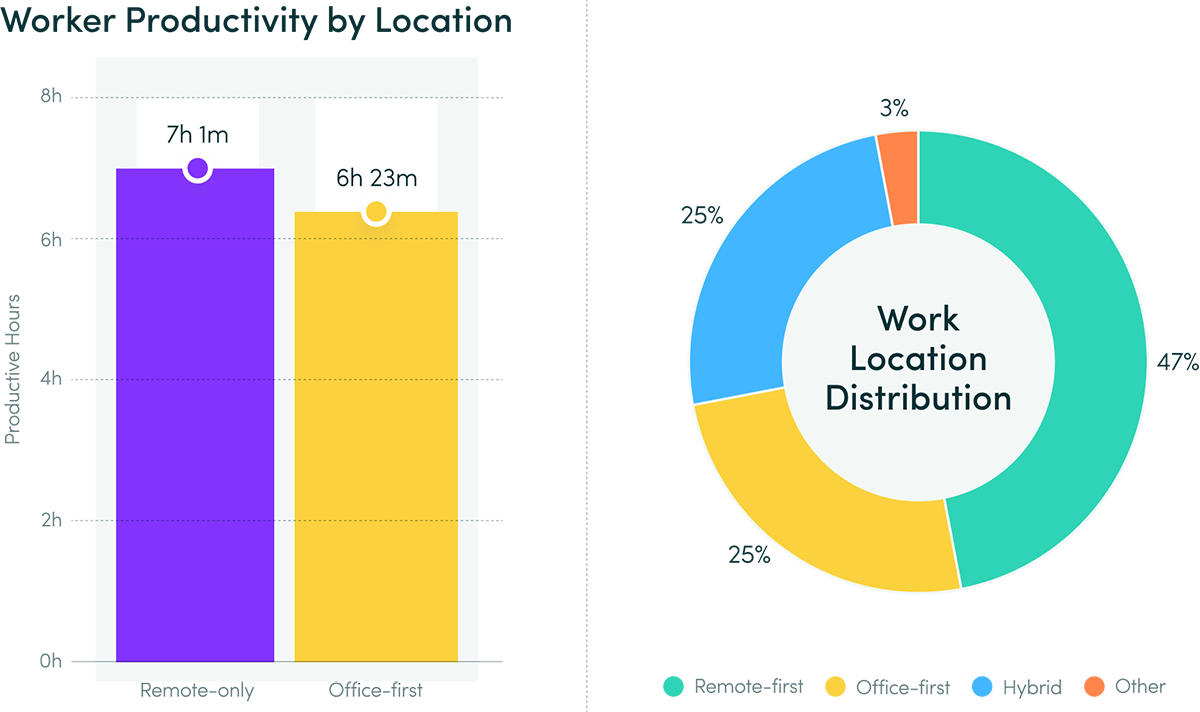
- 47% of companies are remote-first; 25% office-first; 25% regular hybrid
- Remote-only workers: highest productive time (7h 1m daily)
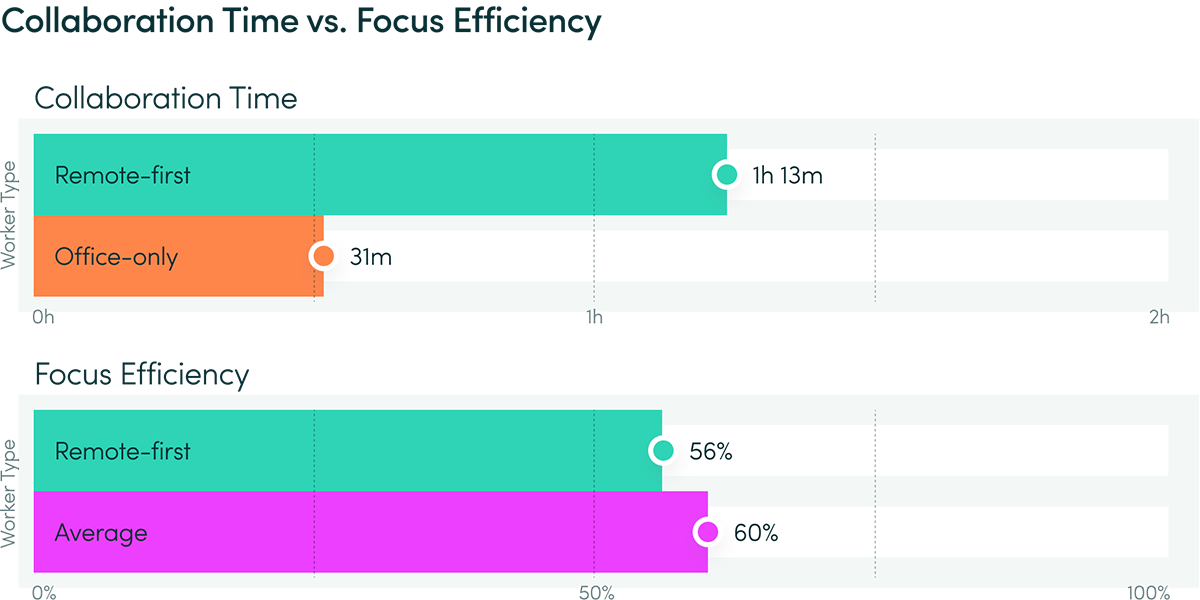
- Remote-first workers: longest collaboration time (1h 13m daily — 43m more than office-only)
- Remote-first companies: longest productive sessions (33m daily)
- Remote-first workers: lowest focus efficiency (56%)
Office & Hybrid
- Office-only workers: highest focus efficiency (64%) and longest productive sessions (41m)
- Office-first companies: highest share of underutilized employees (20%)
- Hybrid workers: longest workday span (9h 45m) but lowest productive and focused time
We examined work location three ways: by how companies are structured (e.g., remote-first, office-first, hybrid), by how individual workers spend the majority of their days and by what happens within a single workday (workers spending time at only one location vs splitting time between two). Each level reveals something different about how location shapes performance.
Work Location
Different Locations, Different Patterns
No single work model has a monopoly on performance. What matters more than where employees sit is whether the systems around them are built to support how they actually work.
Remote-only workers show the highest daily productive time at 7 hours 1 minute — 38 minutes more than office-first. Office-only workers have the highest focus efficiency at 64% and the longest productive sessions at 41 minutes. Hybrid workers — those splitting a single day between office and remote — span the longest workdays (9 hours 45 minutes) but log the lowest productive time and focused hours of any location type.
Fully remote workers report the highest engagement at 31% — but only 36% report thriving overall, compared to 42% of hybrid and on-site remote-capable workers. Remote workers are also the most likely to be actively job hunting. — Gallup, State of the Global Workplace: 2025.
Clear expectations and team alignment — not physical proximity — are the strongest predictors of performance in hybrid environments. — Microsoft, 2024 Work Trend Index Annual Report
90% of CEOs report that their current hybrid work model is a primary factor in reducing overhead costs, yet 83% of global CEOs anticipate a full-time return to office by 2027. — KPMG, 2025 Global CEO Outlook
Work Location
Structure Matters More Than Setting
Remote-first workers show a notable paradox: they have the longest collaboration time (1 hour 13 minutes daily — nearly 2.5x more than office-only workers) but the lowest focus efficiency at 56%. More connection doesn’t automatically translate to more depth.
Location type is a proxy for work design. The question organizations should ask isn’t ‘remote or office’ — it’s whether their operating model gives employees the conditions to do their best work regardless of where they sit.
Work Location Snapshot
Remote-first is the dominant company model, representing 47% of companies in the location subset — nearly double the share of office-first (25%) or regular hybrid (25%).
Regular hybrid and remote-first companies have the highest share of healthy employees at 76% each — however regular hybrid have more underutilized (18% vs 14%), while remote-first have more overutilized (11% vs 6%).
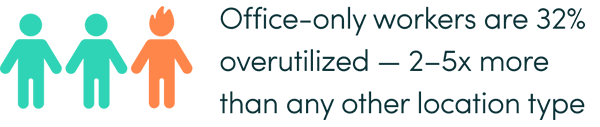
Office-only workers have the highest overutilization rate by 2–5x, with 32% overutilized — a significant outlier that warrants attention for organizations pushing hard RTO policies.
Methodology
About This Data
This report analyzes more than 443 million hours of behavioral workforce data collected through the ActivTrak Workforce Intelligence Platform, recorded between January 1, 2023 and December 31, 2025. Unless noted, all findings use the primary data sample (Data Set A).
Primary (A)
Companies
1,111
Users
163,638
Notes
All findings unless noted
Work Categories Before/After AI Adoption (B)
Companies
376
Users
10,584
Notes
Analysis compares users 180 days before and after AI adoption
Customer Experience (C)
Companies
164
Users
—
Notes
ActivTrak customer survey
Location Insights (D)
Companies
401
Users
130,177
Notes
Work location analysis
Note: For Saturday & Sunday average start and end times, edge cases around timezone conversion may exist.
Glossary
AI Measurement Gap
The gap between widespread AI adoption and an organization’s ability to measure AI impact on workforce performance, operational strategy and the way work gets done.
Burnout
Employees at risk spend >75% of their time overutilized annually.
Capacity
Total number of productive hours worked as a percentage of expected productive hours.
Collaboration
Work time spent using digital collaboration tools like meeting software, and chat and messaging applications.
Disengagement
Employees at risk spend >75% of their time underutilized annually.
Efficiency
The percentage of productive, focus or collaboration time relative to Total Time.
Focus Time
Work time engaged in a single task without interruptions, attention shifts or collaborative activities.
Focus Efficiency
The percentage of focused time relative to Total Time.
Focus Session
The average time employees work without multitasking (interruptions or attention shifts) or collaboration activities.
Healthy Utilization
When an employee is within +/-% threshold of their daily productive hours goal.
Hybrid
Across the workforce, office and remote workdays are relatively balanced, with neither accounting for >60% of total working hours.
Multitasking
Work time spent in productive applications that involves frequent attention shifts between activities.
Office-first
Employees collectively spend >60% of their work days in an office location, indicating a primarily office-based work model.
Office-only
Employees collectively spend >95% of their work days in an office location.
Overutilization
When an employee is more than X% over their daily productive hours goal (set by employer).
Productive Time
Time spent in productive apps and sites, including focus, collaboration and multitasking activities, per person per day.
Productive Efficiency
The percentage of productive time relative to Total Time.
Productive Session
Average time employees work without disruption, calculated based on the frequency of non-business activities relative to total hours worked.
Remote-first
Employees collectively spend >60% of their work days in remote locations, indicating a primarily remote work model.
Remote-only
Employees collectively spend >95% of their work days in remote locations.
Total Time
The average time an employee spends on a computer screen.
Underutilization
When an employee is more than X% under their daily productive hours goal (set by employer).
Unused Capacity
Expected productive hours minus actual productive hours (default: 7 hours per day).
Utilization
A measure of employee engagement and well-being based on the average productive hours per day relative to the goal set for their team.
Workday
Time between the first and last activity reported on an employee’s computer.