How to use workforce analytics to drive success across your organization
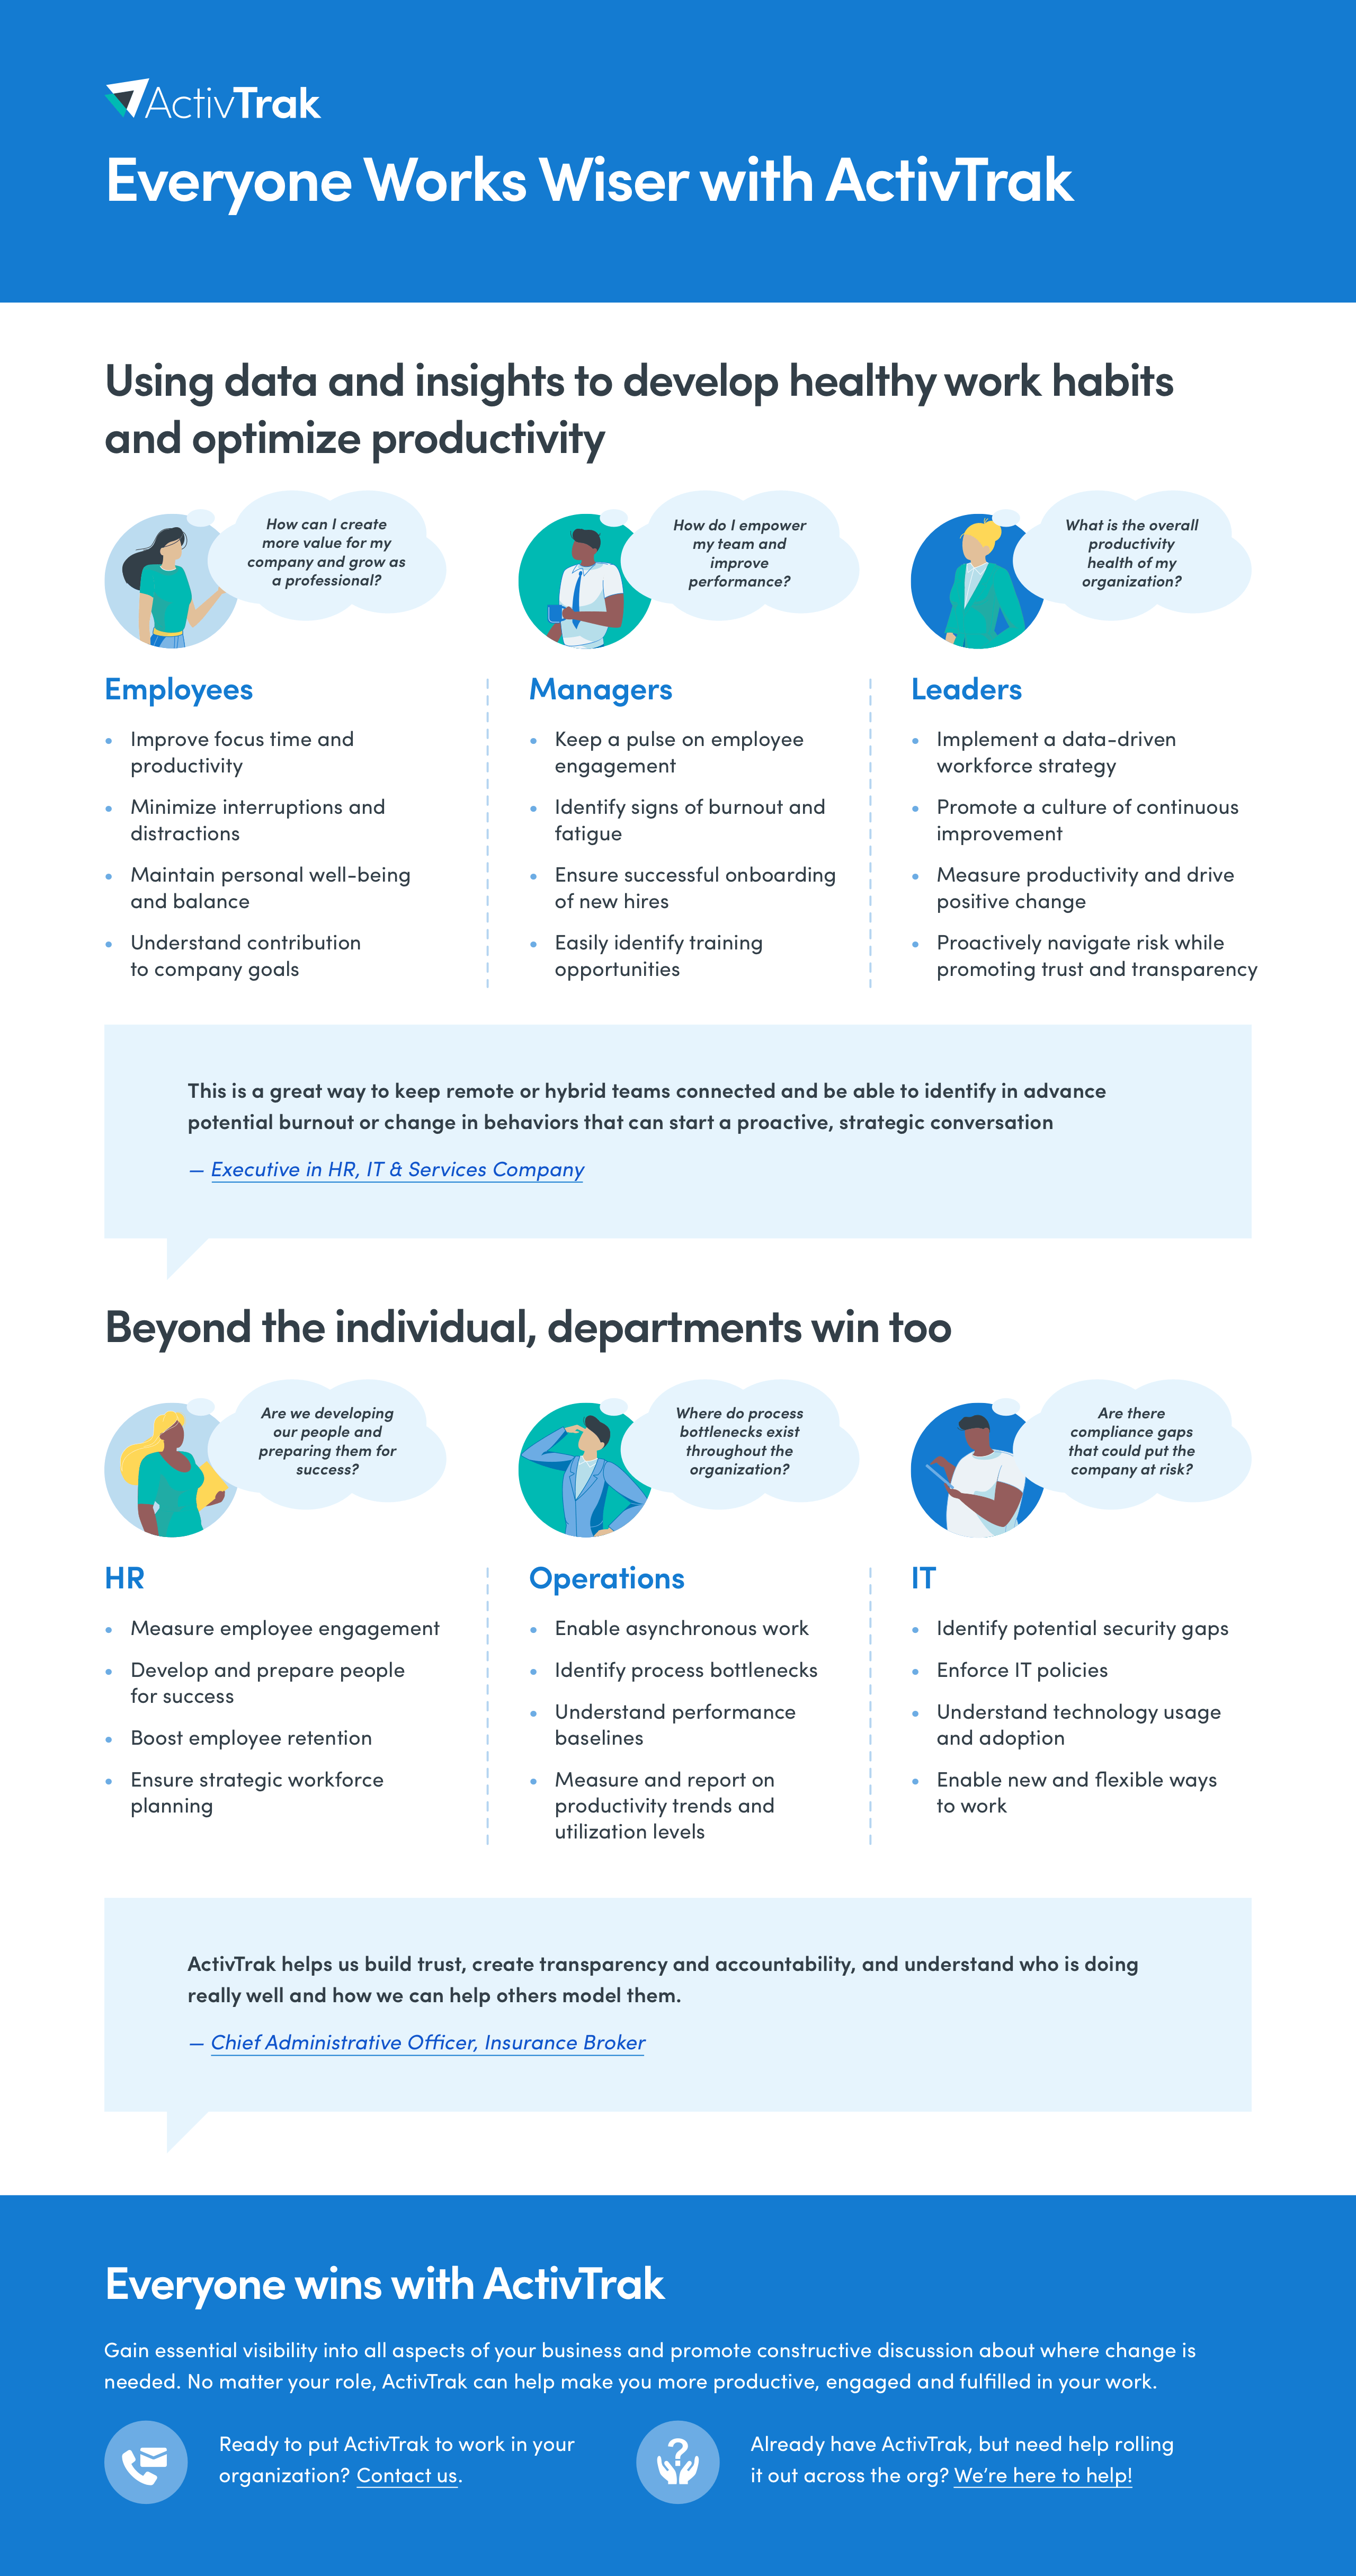
With much of today’s work happening across remote and hybrid locations, employees, managers and company leaders need new data and insights to optimize productivity while maintaining healthy work habits. They want to know:
- Is my schedule optimized so I can take time to unplug from work and avoid burnout?
- Do employees feel engaged in their work and are they using their time efficiently?
- How do we use workforce patterns and trends to make better macro-level adjustments?
More and more organizations are adopting workforce analytics solutions to get the visibility they need to drive success across the organization. But exactly what type of visibility they need varies significantly by role, whether that’s an executive, a manager or an individual contributor
Help employees achieve their goals
Employees want their work to be fulfilling and ensure career growth while also cultivating healthy work habits. Achieving meaningful outcomes — both for the business and themselves — is rooted in understanding how they get work done.
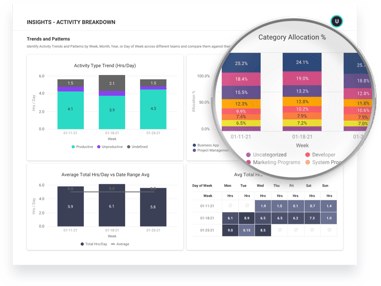
ActivTrak’s Personal Insights Dashboard gives employees a single source of truth, including:
- Productivity insights that break down focus, collaboration and multitasking time.
- Wellness insights that show how they’re managing their workload to avoid fatigue.
- Technology insights that distinguish which tools boost productivity vs. create distractions and interrupt employees' ability to focus on their work.
Access to this data helps employees assess their work habits so they can manage their time more efficiently and communicate their preferred way of working to coworkers and managers.
For example, a financial services company used workforce analytics to uncover widespread Zoom fatigue and devised a solution to improve the employee experience with more optional meetings and opportunities for focus time.
Help managers become better coaches
Workforce analytics provide valuable insights that help managers assess how their team is really doing and identify opportunities to improve performance and balance. These insights can support coaching discussions around issues such as distractions, collaboration fatigue, daily routines and break practices.
ActivTrak features unique pre-configured reports that highlight key takeaways and areas for improvement, and help managers better manage, coach and support their teams, including:
- Team Pulse reports that give a snapshot of productivity across teams, including summary details of each employee’s day.
- Workload Balance reports that show which team members are over- or underutilized based on their productive hours per day vs. the goals you have set together.
- Work Efficiency reports that contain a breakdown of how time is spent across a team, including ‘inefficiency sources’ that indicate what causes frequent distractions.
- Team Comparison reports that enable managers to compare productivity, focus, multitasking and collaboration time across teams and to the organizational average.
When SiteTech Systems was looking to make a rapid transition to remote work, their managers used ActivTrak reports to support employees in a new environment and help them use their time as efficiently as possible. This allowed them to keep productivity high during and after the switch. In addition, ActivTrak’s self-service platform was so easy to set up that they didn’t have to get the IT department involved.
Help leaders align priorities & manage risks
Workforce analytics improve decision-making, providing a clearer image of goals and objectives, and delivering value up and down the organization.
ActivTrak’s Executive Summary Dashboard gives executives a bird’s-eye view of business that helps leaders align on priorities and manage potential risks by identifying and prioritizing the areas that need their support the most. This includes the ability to:
- Pinpoint work processes and systems that need improvement.
- Spot signs that productivity, engagement, morale or overall mission are at risk.
- Make more informed decisions about technology and software procurement.
- Determine factors that might cause retention issues (e.g., burnout and disengagement trends).
For example, an executive could use this dashboard to quickly view the top and bottom three performing teams relative to productivity goals, or to search for untapped potential by gauging which teams have chronically underutilized team members.
The executive team at a healthcare company used ActivTrak insights to improve productivity and operational efficiency while simultaneously reducing the risk of burnout.
Harness the full potential of workforce analytics
A workforce analytics platform provides complete visibility into every part of the business empowering employees, managers and leaders to increase productivity, collaborate more effectively and practice greater transparency.
That’s especially important in departments such as HR, Operations and IT, where it’s important to know:
- If they are developing people and preparing them for success.
- Where process bottlenecks may exist throughout the organization.
- If there are compliance gaps that could put the company at risk.
Workforce analytics platforms like ActivTrak provide a powerful opportunity to make sense of all of the unseen digital work that happens on a daily basis — providing data-driven insights that empower people at all levels of the organization.